eISSN: 2641-936X


Research Article Volume 2 Issue 2
Department of Electrical and Computer Engineering, FAMU-FSU College of Engineering, Tallahassee, Florida 32310, USA
Correspondence: Simon Y Foo, Department of Electrical and Computer Engineering, FAMU-FSU College of Engineering, Tallahassee, Florida 32310, USA
Received: July 09, 2018 | Published: July 24, 2018
Citation: Khanam JJ, Simon YF. Modeling of a photovoltaic array in MATLAB simulink and maximum power point tracking using neural network. Electric Electron Tech Open Acc J. 20182(3):40-46. DOI: 10.15406/eetoaj.2018.02.00019
In this paper, we present our work on Maximum Power Point Tracking (MPPT) using neural network. The MATLAB/Simulink is used to establish a model of photovoltaic array. The Simulink model is tested with different temperature and irradiation and resultant I-V and P-V characteristics proved the validation of Simulink model of PV array. We collected a set of data from the Simulink model of PV array after simulated under a range of irradiation and temperature. The data collected from the system is used to train the neural network. When we tested the neural network with different irradiance and temperature, we see that the neural network can accurately predict the maximum power point of a photovoltaic array. In this paper, the backpropagation training algorithm is used to train the neural network. Comparisons of MPPT with P & O algorithm and without MPPT tracker are also shown in this paper. It is demonstrated that the neural network based MPPT tracking require less time and provide more accurate results than the P&O algorithm based MPPT.
MPPT, maximum power point tracking; MPP, maximum power point maximum; Pmax/Pmp, power voltage at maximum power point; NN, neural network; P&O, perturb and observe; Irr, irradiance; PV, photovoltaic.
Maximum Power Point Tracking (MPPT) is very useful tool in PV application. Solar radiation and temperature are the main factor for which the electric power supplied by a photovoltaic system varies. The voltage at which PV module can produce maximum power is called ‘maximum power point’ (or peak power voltage).1–3 The main principle of MPPT is responsible for extracting the maximum possible power from the photovoltaic and feed it to the load via dc to dc converter which steps up/steps down the voltage to required magnitude. Various MPPT techniques have been used in past but Perturb & Observe (P&O) algorithm is most widely accepted.4–6 P&O algorithm has also been shown to provide wrong tracking with rapidly varying irradiance.7–10 In this paper we are implemented neural network based MPPT method. Artificial Neural Network (ANN) is an artificial network that can able to mimic the human biological neural networks behavior. ANN widely used in modeling complex relationships between inputs and outputs in nonlinear systems. ANN can also be defined as parallel distributed information processing structure. The ANN consists of inputs, and at least one hidden layer and one output layer. These layers have processing elements which are called neurons interconnected together. To calculate error contribution of each neuron after a batch of data processing a method called ‘back propagation’ is used. Back propagation is commonly used by the gradient descent optimization algorithm to adjust the weight of neurons by calculating the gradient of the loss function. This technique is also called back propagation error. This is because the error is calculated at the output and circulated back through the network layers.11
Mathematical solar array modeling
In this paper at first, we modelled a 60 WPV array. The basic building block of PV arrays is the solar cell, which is basically a p-n semiconductor junction, shown in Figure 1.12
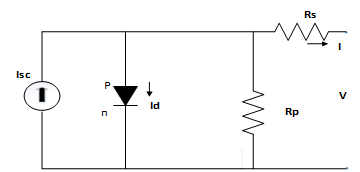
The following equations define the model of a PV panel:
Eq:1
Eq:2
Eq:3
Eq:4
Eq:5
Eq:6
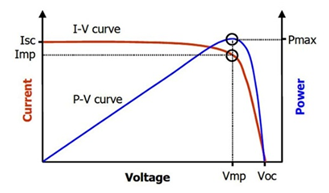
Where, ‘Ipv’ is the light generated current (it is directly proportional to the solar irradiation), ‘Is’ is the saturation or leakage current of the diode. The reverse saturation current of a cell is ‘Irs’, ‘I’ is output current from the PV panel. ‘Id’ is diode current or dark current. ‘A’ is the ideality constant of a silicon diode. ‘Tc’ and ‘Tref’ are the working temperature of cell and reference temperature, respectively in °K. ‘Ns’ is number of cells in series for a PV module. Np is number of parallel module. Eg is the band gap energy of semiconductor. Voc is the open circuit voltage and Isc the short circuit current. Rs and Rsh are series and parallel resistances of solar cell, respectively.13 The typical PV characteristics of a solar cell shown in Figure 2.14 In the figure we can observe that at voltage ‘Vm’ the power is at the maximum. This is the maximum power point of PV characteristics that we need to track using MPPT algorithm.
Modeling and simulation of 60W PV array
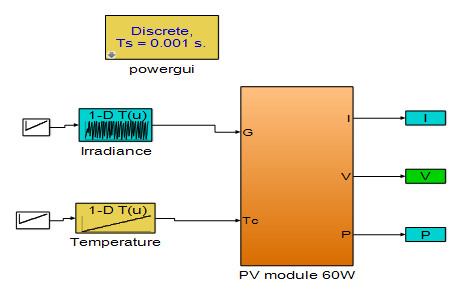
The solarex MSX60 PV array is chosen for our modeling and simulation. The typical electrical characteristics of MSX60 modules, each consisting of 36 polycrystalline silicon solar cells, is given in Table 1. P-V characteristics curves obtained from the simulation for MSX 60 modules at Tc=25°C (298°K) and Gr=1000W/m2, A=1.3, Ns=36, Np=1; Tref=298°K(25°C); Eg=1.12eV; Rsh=1000Ω; Rs=0.1Ω.15 For the modeling of PV array, we used MATLAB Simulink. The simulation model in Figures 3˗7 are based on equations 1 to 6. Simulink model of an MSX 60 PV array subsystem is shown in Figure 8. P-V characteristics of the PV array with variation of irradiance and temperature shown in Figure 9 & Figure 10.
Description |
MSX 60 |
Maximum power |
60W |
Voltage at Pmax (Vmax) |
17.1 V |
Current at Pmax (Im) |
3.5A |
Guaranteed minimum Pm |
58 W |
Short Circuit current (Isc) |
3.8A |
Open circuit voltage (Voc) |
21.1 V |
Temperature coefficient Ki |
|
Table 1 Electrical Characteristics of MSX 60 PV module
The effect of series and shunt resistance on I-V characteristics is shown in Figure 11 & Figure 12 respectively. The output obtained from the model exactly matches with the data provided by the P-V characteristics of MSX 60. In Figure 9 we observed with irradiance increased, power increased. In Figure 10 we observed with temperature increased, power decreased. From Figure 11 & Figure 12 with series resistance increased, current decreased, whereas if shunt resistance increases, current increases. Hence our Simulink model is exactly able to determine the characteristics of PV array. Hence the Simulink model is accurate.
Classical P&O algorithm
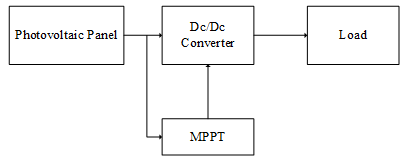
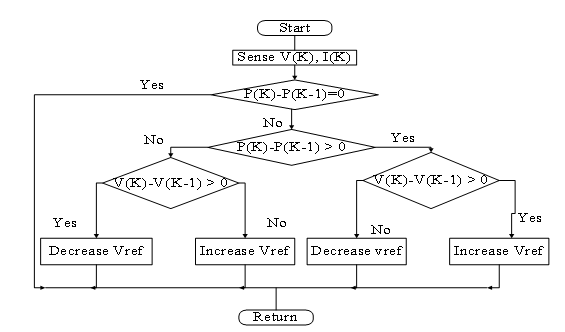
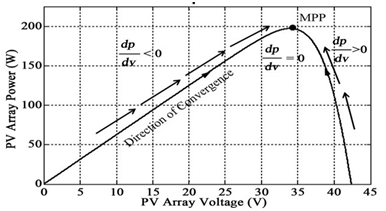
Here the P & O algorithm MPPT technique is used in 60 W modelled PV array to find maximum power point. The block diagram of general MPPT Photo Voltaic system is shown in the following Figure 13.16 To track the MPP of PV module, P&O MPPT algorithms have been used. The P&O algorithm shown in Figure 14.17 The P&O starts working at first, by perturbing (increasing and decreasing) the PV array terminal voltage or current at regular interval and then P&O compare the output power of PV array P(K) with that at the previous perturbation P(K-1). In reference voltage perturbation, the PV array output voltage reference is used as the control parameter in conjunction with a controller (PI/ PID controller) to adjust the duty ratio of the MPPT converter. From Figure 1518 we can see that if the power is increase after the perturbation in terminal voltage (dP/dV >0), the perturbation should be kept in the same direction otherwise the perturbation is moved to the opposite direction. The perturbation cycle is repeated until the maximum power is reached at the dP/dV=0.19–22 The perturbation size is kept very small intentionally. It helps to keep the power variation small. PV array with P & O algorithm based MPPT tracking is shown in Figure 16. The comparison between with and without MPP tracking is shown in Figure 17, where we can see that, without MPPT tracker the maximum power point is 37.31W. While, when we used P&O based MPPT tracking the maximum power point become 53.94W. The simulation results of the solar PV with MPPT P&O algorithm is shown in Figure 18, From Figure 18 we can see that at 14.33V we are getting maximum power 53.94W. We also have observed that it takes only 0.07213 minutes to track the maximum power point.
Neural network based MPPT technique
Here neural network is used to track MPP of our implemented 60W PV array. In our work, the Levenberg-Marquardt algorithm is implemented using MATLAB to train the neural network. The Levenberg-Marquardt method is a very fast and accurate technique for solving nonlinear least squares problems. Since the variations of temperature and irradiance effect are highly nonlinear in producing the output power and voltage, we decided to use the Levenberg-Marquardt algorithm to train the neural network. The following steps describe how we implement the neural network based MPPT for a PV array.
The input information is connected to the hidden layers through weighted interconnections where the output data is calculated. The number of hidden layers and the number of neurons in each layer controls the performance of the network. Neural network is a trial and error design method. The ANN developed in this paper with two inputs solar irradiance and temperature, one output layer consists of two neurons (Vmax, Pmax) and one hidden layer, shown in Figure 19. As the problem is not linearly separable hence it will require a hidden layer with neurons with “tan sigmoid” activation function. Sigmoid function is used because it is differentiable. The one output layer has two neurons with “purelinear” activation function which is linear transfer function.
The Simulink model of PV array is simulated for a range of solar irradiances and temperatures to find corresponding Pmax and Vmax shown in Figure 20. A set of 104 Pmax and Vmax data points are derived from the Simulink simulation.
From the set of 104 data points, 94 data points are used as training data. The training points are passed into the designed network to teach it how to perform when different points than the training points are inserted to it.
After training of the neural network is completed, then 10 of the collected data points are used as test points. The function of test points is to evaluate the performance of the designed ANN after its training is finished. The error is then feedback to the neural network for further training. The network is trained using the MATLAB NNET tool box shown in Figure 21.
The network which was fully trained with the lowest error is capable to be used in the testing process. Performance of ANN to minimize the RMS error is shown in the training performance curve of Figure 22. Network was trained until it achieved a very small MSE typically 0.67707e-5 which reached after 1000 epochs. From the regression plot in Figure 23, we can observe that the outputs from the neural model closely match the target values. For 10 new testing input irradiance and temperature data points the neural network has been tested. These data point are [Irr (W/m2), T(°K)]=[800,291], [1000,300], [500,300], [240,310], [600,293], [400,302], [700,312], [500,313], [125,299] and [440,296] shown in Table 2. In shown in Figure 24 & Figure 25 we can see that, at each time, the neural network provided Pmax and Vmax data points clearly matched with measured data points from the actual Simulink model (Figure 20).
Test point |
Irradiance W/m2 |
Temperature in°K |
Vmp actual |
Vmp NN |
Pmp actual |
Pmp NN |
1 |
[800,291] |
291 |
17.724 |
17.8007 |
41.0356 |
41.0449 |
2 |
[1000,300] |
300 |
16.88 |
16.8174 |
51.1766 |
51.1813 |
2 |
[500,300] |
300 |
15.614 |
15.6228 |
20.405 |
20.4183 |
4 |
[240,310] |
310 |
11.816 |
11.8301 |
5.9104 |
5.9089 |
5 |
[600,293] |
293 |
16.88 |
16.8582 |
27.52 |
27.3494 |
6 |
[400,302] |
302 |
14.77 |
14.7676 |
14.4407 |
14.4022 |
7 |
[700,312] |
312 |
14.77 |
14.6336 |
29.7503 |
29.7581 |
8 |
[500,313] |
313 |
13.926 |
13.8895 |
18.7714 |
18.8061 |
9 |
[125,299] |
299 |
6.752 |
6.9196 |
1.6425 |
1.5521 |
10 |
[440,296] |
296 |
16.036 |
15.8739 |
17.2106 |
17.2097 |
Table 2 For 10 irradiance and temperature data input, the actual and neural network output data Pmp and Vmp
Extracting the maximum power out of the PV array is a critical step in harvesting renewable energy. The goal of the MPPT technique is to extract the maximum power available in the PV array. 60WPV array is developed by using MATLAB/Simulink. The irradiance and temperature are two factors for which the PV array output power varies. The comparison between without MPPT and with MPPT (using P&O algorithm technique) is shown by using the actual Simulink model of 60 WPV array. The Simulink model of MPPT using P&O algorithm is simulated for a constant irradiation of 1000 W/m2 and temperature of 27°C (300°K) for which we get 53.94W across the load at 14.33V. It has been shown that simulations of solar PV array without MPPT provided 37.31W of power. This shows that the use of MPPT in PV arrays have improved the efficiency of solar PV system and maximized the output power. The comparison between P&O algorithm for MPPT and neural network technique for MPP tracking also observed in this paper. The neural network is trained by using Irr and T(°K) input data and Pmp and Vmp output data. From the regression plot, we observed that the tested data exactly matched with target values, hence training of neural network has been proved accurate. We tested the neural network for 10 new input data (Irr, T (°K)), we observed from the graph that the output (Pmp, Vmp) of neural network exactly matched with actual 60 W PV array output. By using the neural network at an irradiance of 1000 W/m2 and temperature of 27°C (300°K), we were able to obtain the output power of 51.1813W at 16.8174V. The actual 60 W Simulink model of PV array shows the maximum power of 51.1766W at 16.8800V. Hence the neural network algorithm can predict more accurate results than the classic P&O algorithm based MPPT method. We have observed that it takes only 0.07213 minutes to track the maximum power point by using P&O algorithm, whereas the neural network techniques take only a few seconds. In P&O based MPPT, we developed MATLAB code for P&O algorithm and DC-DC buck boost converter Simulink model for changing the PV’s terminal voltage to track the maximum power. We observed that the neural network is quite simple to develop. For different temperature and irradiance, the neural network provides more accurate and faster results than P&O based MPPT. The future work can be, the implementation of a neural network MPPT technique for a real PV panel.
The research article data used to support the findings of this study are included within the article.
This work is funded in part by Florida A&M University and Florida State University.
The authors declare that there is no conflict of interest regarding the publication of this paper.

©2018 Khanam, et al. This is an open access article distributed under the terms of the, which permits unrestricted use, distribution, and build upon your work non-commercially.