eISSN: 2575-906X


Research Article Volume 1 Issue 3
1Department of Botany, Jai Hind College, India
2Department of Botany, Rizvi College of Arts, India
Correspondence: Ambika Joshi, Department of Botany, Jai Hind College, A-Road, Church Gate, Mumbai-400 020, Maharashtra, India
Received: August 15, 2017 | Published: September 20, 2017
Citation: Joshi A, Kalgutkar A, Joshi N. Quantitative analysis of seasonal variations in undisturbed areas of Sanjay Gandhi national park (SGNP). Biodiversity Int J. 2017;1(3):75-78. DOI: 10.15406/bij.2017.01.00012
The Sanjay Gandhi National Park; a 103 sq. km. protected area is present in the suburban region of Mumbai. The aim of this study was to determine the diversity of the undisturbed habitat in the park across seasonal variations. Through the analysis of the Quadrat studies it has been discerned that species alter with seasonal variations and hence the study of diversity during different seasons play a crucial role in determining the diversity and also the changing dominance of species. Also, with the study encompassing comparison between undisturbed habitat, inference can be drawn from data analyzed that the diversity has immensely changed from the monsoon season to the winter season, marking the fact that seasonal and climatic conditions have a profound effect on the diversity of the area which was determined and ministered by the diversity indices. The protection of the undisturbed areas becomes an inherent and imperative aspect to owing to the exclusive species present in these areas which have already been included in various categories of the IUCN Red Data List. Species encountered during the study in the park were Ceropegiavincifolia, Dipcadisaxorum and Chlorophytum borivilianum that have been classified as endemic and endangered in the Red Data List. The monsoon season, albeit being the most suitable season for the growth and propagation of many species including some exclusive floral species that have been considered Endemic, Rare, Threatened or Vulnerable, the pliant nature of other species allowed them to thrive in the harsh winter periods.
Keywords: protected area, diversity, undisturbed habitat, guadrat studies, seasonal variations, endemic, endangered, red data list
IUCN, international union for conservation of nature and natural resources; SGNP, sanjay gandhi national park
The Sanjay Gandhi National Park (SGNP) is an example of one of the least represented biographic zones - the Malabar Coast of the Western Ghats which forms only 0.4% of the Protected Area network. The official area of the park has expanded by five times since pre - independence era and presently covers 104sq. km., housing many rare, threatened and beautiful species.1 Present in the suburban region of Mumbai, it has four entry points - Borivali, Aarey Gate, Bhandup Complex and the Yeur Naka. Of these only Borivali and Yeur Naka are open to people. From the two mentioned, the Borivali end is easily accessible. It is used for morning walks, school and college picnics, lion and tiger safari and for nature walks. The forests at the Borivali end are classified under un-classed and reserved forest type. The Yeur Naka is accessible for research and educational purpose and is classified under reserved and protected forest type. Also, since the Yeur Naka is restricted to tourists, the extent of disturbance is low. Hence, the Borivali area was selected to carry out this study due ease of access.2
To determine vegetation differences between undisturbed areas for this study, a survey was carried out initially from the Borivali gate upto Kanheri caves by foot to identify possib
S. No. |
Areas Selected |
Disturbance Status |
Seasonal Study |
1 |
Shilonda Trail |
|
|
2 |
Near Kanheri |
|
|
Table 1 Areas selected for the study.
To measure the diversity of the park in the two undisturbed habitats as given in table 1, quadrats of 1m x 1m were laid along the Shilonda trail and near Kanheri Caves. Since, difference in Species Diversity may not be because of the relative location of the sampling area but because they were collected at different times of the year, 30 quadrats were laid at each site during each season i.e. monsoon - June to August, post - monsoon - October to November and winter - January to March to get a comprehensive value of the diversity of the areas selected for the study. The values of flora obtained from quadrats and tally marks were further expressed by use of indices like Index of Dominance and diversity indices like the Simpson’s Reciprocal Index, the Shannon - Weiner Index, Species Richness and Species Evenness. Plant identification was done using floras of Almeida M.R., and confirming the same.3‒5
Simpson’s Reciprocal Index:
Where,
D = Diversity Index
N = Total number of individuals of all species
n = Number of individuals of particular species.6
Shannon - Wiener index: 7
Species Richness: SR = log S
Where S = total number of species.8
Where H’= Shannon - Wiener diversity index; R = Species Richness.9
Index of dominance = 7
Where,
Monsoon season (June to August)
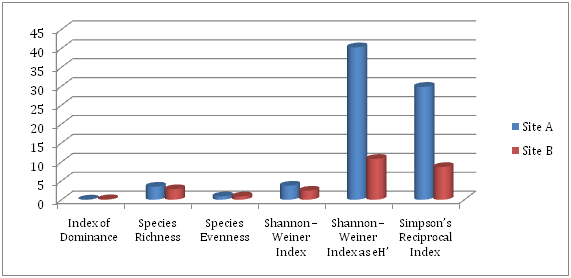
The monsoon season is marked by the growth and proliferation of a myriad of diverse floral species. Water is a key factor and also a limiting factor that regulates the growth and development of plants. As for the diversity indices calculated for site A shown in table 2, the Index of Dominance is computed to be 0.0338. The Site shows a Species Richness of 3.4341 and Species Evenness of 0.8727. The Shannon Weiner Index is 3.6952 and when expressed as eH’ is at 40.2530. As can be observed from the table given, the Simpson’s Reciprocal Index is at 29.82. For Site B, it has been established that the Index of Dominance, Species Richness and Species Evenness have corresponding values of 0.1173, 2.7726 and 0.8577 respectively, while the Shannon - Weiner Index, Shannon - Weiner Index expressed as eH’ and the Simpson’s Reciprocal Index demonstrate corresponding values at 2.3777, 10.7824 and 8.63 (Figure 1).
Diversity Index |
Site A |
Site B |
Index of Dominance |
0.0338 |
0.1173 |
Species Richness |
3.4341 |
2.7726 |
Species Evenness |
0.8727 |
0.8577 |
Shannon - Weiner Index |
3.6952 |
2.3777 |
Shannon - Weiner Index as eH’ |
40.253 |
10.7824 |
Simpson’s Reciprocal Index |
29.82 |
8.63 |
Table 2 Calculated values of various indices for species recorded by quadrat method of sites A and B during monsoon at SGNP.

Figure 1 Presentation of calculated values of indices for species recorded by quadrat method during monsoon at SGNP at the sites.
Index of Dominance was determined to achieve a relation between diversity and dominance which lays in the fact that low dominance indicates high diversity whereas high dominance indicates low diversity.7 Thus, in comparing the Index of Dominance with that of Species Richness it can be observed that Site B, although an area with low disturbance, reflects high Index of Dominance and low Species Richness. Nevertheless, this attribute and relationship between dominance and richness of site D is due to its hilly and undulating terrain that does not support the proliferation of flora unless being adapted to such topography. Species Richness of site A is the highest (3.4341), while the Index of Dominance is the lowest (0.0368) as against sites B. In consequence, it can be suggested that the Index of Dominance is inversely proportional to the Richness of Species from the recordings obtained during the monsoon season.
Site A being a protected area shows more variations in species and some species that have been noted in the IUCN Red Data list of Threatened Plants have been observed in this Site, namely, Gloriosasuperba L., Dipcadisaxorum Blatt. and Chlorophytum borivilianum Santapau & R.R. Fern. For example, Gloriosasuperba L.; enlisted as threatened and Dipcadisaxorum Blatt. and Chlorophytum borivilianum Santapau & R.R. Fern., both endemic and endangered species have been recorded only in this site. Therefore, the protection of this site is vital for conservation of heterogeneity and the inimitable flora thriving in it. Conversely, Site B also classified as undisturbed shows least diversity obtained by the indices but houses species like Ceropegia vincifolia Hook., classified as endemic and endangered.
Post - monsoon season (October to November)
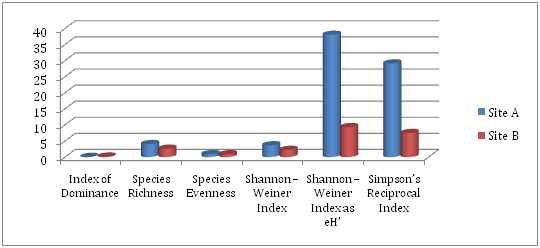
The monsoon season is followed by a period of warmer climate during the post - monsoon months of October to November. This results in decline of the species diversity and abundance due to fall in the favorable conditions that follow post the rains. It can be assumed that the vegetation growth and distribution will differ from that as observed during the monsoon season as favorable conditions may not prevail for the growth and propagation of all species (Figure 2).

Figure 2 Presentation of calculated values of indices for species recorded by quadrat method during post – monsoon at SGNP at the sites.
During the post monsoon season the abundance of vegetation differed as compared to that found during the monsoon season. Diversity indices calculated for site A shown in table 3 compute that the Index of Dominance is 0.031. The Site shows a Species Richness of 4.0254 and Species Evenness of 0.9037. The Shannon Weiner Index is 3.6376 and when expressed as eH’ is at 38.0006. As can be observed from the table given, the Simpson’s Reciprocal Index is at 29.1. From indices of diversity established for Site B, it can be seen that the Index of Dominance, Species Richness and Species Evenness have corresponding values of 0.1329, 2.5649and 0.8688respectively, while the Shannon - Weiner Index, Shannon - Weiner Index expressed as eH’ and the Simpson’s Reciprocal Index demonstrate corresponding values at 2.2285, 9.2857and 7.49.
Diversity Index |
Site A |
Site B |
Index of Dominance |
0.031 |
0.1329 |
Species Richness |
4.0254 |
2.5649 |
Species Evenness |
0.9037 |
0.8688 |
Shannon - Weiner Index |
3.6376 |
2.2285 |
Shannon - Weiner Index as eH’ |
38.0006 |
9.2857 |
Simpson’s Reciprocal Index |
29.1 |
7.49 |
Table 3 Calculated values of various indices for species recorded by quadrat method of sites A and B during post - monsoon at SGNP.
When compared with the Index obtained during the monsoon season, the Index of Dominance has shown a change in both Sites A and B, which implies that with the change in the abiotic factors of the park there is a change in the composition of the species, thereby causing alterations in the indices. It should also be noted that the unique species observed during the monsoon season as discussed in the previous data analysis have not been observed during the post monsoon season thereby reducing the diversity, though the change has been miniscule. Thus, it can is prominent that these exclusive species are known to emerge only in the monsoon, perishing by the post monsoon season and thus are driven by climatic conditions that optimize their successful life-cycle.
Winter (January to March)
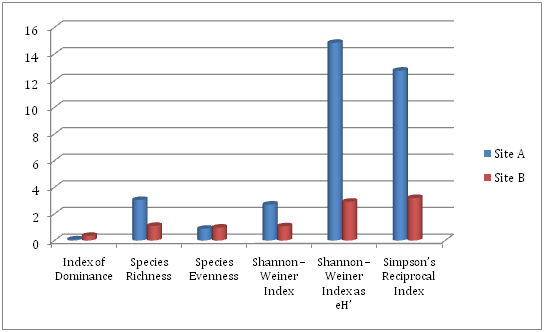
The season of winter is the most unfavorable season for the growth and development of plants as an important factor like water is a scarce resource during this time. Due to this, there is a drastic shift of diversity of species from being the maximum during the monsoons, gradually declining through the post - monsoons and deteriorating further during the winter months (Figure 3).

Figure 3 Presentation of calculated values of indices for species recorded by quadrat method during winter at SGNP at the sites.
The diversity index studies for Site A show that the Index of Dominance is 0.0813, while Species Richness and Species Evenness are recorded to be 3.0445 and 0.8859 respectively. The Shannon - Weiner Index and as expresses in eH’ are calculated to be 2.6972 and 14.8385 as can be seen in table 4. The Simpson’s Reciprocal Index shows a value of 12.75 for Site A. The Index of Dominance for Site B is determined to be 0.3519. Species Richness and Species Evenness, is 1.0986 and 0.9729 respectively, while the Shannon - Weiner Index is 1.0688. The index when expresses as eH’ gives a value of 2.9119 and the Simpson’s Reciprocal Index of diversity is 3.19 for Site B.
Diversity Index |
Site A |
Site B |
Index of Dominance |
0.0813 |
0.3519 |
Species Richness |
3.0445 |
1.0986 |
Species Evenness |
0.8859 |
0.9729 |
Shannon - Weiner Index |
2.6972 |
1.0688 |
Shannon - Weiner Index as eH’ |
14.8385 |
2.9119 |
Simpson’s Reciprocal Index |
12.75 |
3.19 |
Table 4 Calculated values of various indices for species recorded by quadrat method of sitesA and B during winter at SGNP.
Indices seen among the two chosen sites show greater variation to the indices estimated during the monsoon and post monsoon season. In contrary to the estimations made in the earlier two seasons, the Index of Dominance shows an increase suggesting a decrease in Species Richness. The Index of Dominance is the highest for Site B (0.3519), indicating decline in the diversity, presence of only the tolerant species and hence simplification of habitat, which indicates shrinking of the floral diversity owing to the effects of climatic alterations during the season. On comparing the data of the previous two seasons with winter, it is clear that there is a gradual decline in the floristic diversity, driven by abiotic factors, especially water as a limiting factor. Despite being an undisturbed area, site B recorded the least diversity due to its uneven terrain and changes in conditions. Calculations reiterate and show clear distinction between the diversity recorded in monsoon and winter season. A comparison in the Simpson’s Reciprocal Index between monsoon and winter seasons shows a decline by 54.24% of diversity of Site A and a decline of 63.03% in that of Site B, thus highlighting the influence of optimum climatic conditions for maximum diversity.
Recordings made from the undisturbed sites A and B showed further variations. Site A, regarded as an area of high species and genetic diversity illustrated an astounding 69 species of plants belonging to 33 families. On the contrary, Site B was characterized by 9 families and 16 species.
From the analysis made above in terms of dominance of species and diversity indices for the two sites during different seasons, it can be concluded that seasonal variations play a crucial role in determining the diversity and also the changing dominance of species. With the two sites taken under study determined undisturbed; they were areas supporting exclusive species, that are included in various categories of the IUCN Red Data List.
Furthermore, the diversity has immensely changed from the monsoon season to the winter season, marking the fact that seasonal and climatic conditions have a profound effect on the diversity of the area. The monsoon season can be considered as the most suitable season for the growth and propagation of many species. The exclusive species recorded during the monsoon in these sites perished at the onset of the post monsoon season. A gradual decline in the diversity and Species Richness and increase in the Index of Dominance can be clearly observed between the two Sites in monsoon and post monsoon seasons attributing the cause of change to the abiotic factors especially the monsoons.
Also in comparison, despite being an undisturbed area, site B recorded the least diversity due to it uneven terrain and changes in the edaphic conditions. In comparing the Index of Dominance with that of Species Richness it can be observed that Site B, although an area with low disturbance, reflects high Index of Dominance and low Species Richness. Nevertheless, this attribute and relationship between dominance and richness of site B is due to its hilly and undulating terrain that does not support the proliferation of flora unless being adapted to such topography, thus also showing lower diversity.
However, it should be noted that species identified during course of the study in the park have shown a higher degree of intrinsic value. Thus, it is imperative that all the sections of the park be protected in order to protect the vast variety of goods and services made available to mankind through forests like the SGNP.10‒12
None.
Author declares there is no conflict of interest.

©2017 Joshi, et al. This is an open access article distributed under the terms of the, which permits unrestricted use, distribution, and build upon your work non-commercially.