Advances in
eISSN: 2378-3168


Research Article Volume 12 Issue 3
University of Science Arts and Technology, BWI
Correspondence: Orien L Tulp, University of Science Arts and Technology, Montserrat, BWI
Received: June 15, 2022 | Published: June 24, 2022
Citation: Tulp OL. Effect of aging and obesity on energy intake, glycemic status and thyroidal actions in the congenic LA/Ntul//-cp rat. Adv Obes Weight Manag Control. 2022;12(3):95-99. DOI: 10.15406/aowmc.2022.12.00368
To determine the effects of aging and the obese phenotype on metabolic status, groups of congenic lean and obese female LA/Ntul//-cp rats were maintained on Purina stock diet and house water ad libitum from 5 until 36 months of age in lean rats and 5 until ~30 months of age in the obese rats. Body weights of obese > lean at all ages studied. Measures of daily caloric intake of obese>lean at all ages and decreased in the lean phenotype at the oldest age studied. Resting oxygen consumption at thermal neutrality (RMR, VO2), the thermic response to norepinephrine (NE, 100ug, s.c.), serum T3, T4, and T4:T3 ratios were determined at each age group. Measures of RMR were greater in lean than obese at each age (p=<0.05) and declined with age in both phenotypes with the most substantial decrease in the obese phenotype. Measures of T4 were greater at age 4 months than at older ages in both phenotypes and Serum T3 was unaffected in lean rats consuming the chow diet but increased progressively at each age in obese rats. Serum T4:T3 ratios decreased and T3:T4 increased with age in both phenotypes with the greatest change in the obese rats. Fasting plasma insulin concentrations were increased in the obese phenotype, but plasma insulin to glucose ratios of obese >> lean, consistent with moderate insulin resistance and in the presence of euglycemia in the obese phenotype. These observations are consistent with impaired age associated thyroidal actions in the lean and obese phenotypes in concert with insulin resistance in the obese phenotype and which metabolomic impairments may be contributory to the decline in resting metabolism with advancing age in both phenotypes but with the greatest impact in the obese phenotype.
Keywords: rat, congenic rat, insulin, glucose, glycemic status, thermogenesis, thyroidal hormone actions
The prevalence of overweight and obese conditions have now reached epidemic proportions in much of Westernized society, where they are commonly associated with NIDDM, hypertension, cardiovascular disorders, osteoarthritis, and other pathophysiologic comorbidities.1 In addition, the aging now represent the single most rapidly increasing segment of the population in Westernized countries, where they also harbor mostly treatable comorbidities including hypertension, renal dysfunction, atherosclerosis and cardiovascular disorders.1–3 While obesity is a significant contributing factor in the pathophysiology of its associated comorbidities, the hormonal and metabolic interactions are complex and incompletely clarified. As nations become progressively more industrialized and the socioeconomic levels of the populations more affluent, the physical demands of the typical workplace have decreased, while sadly individual appetites and food selection options have remained robust and include an increasing array of appetizing, manufactured and processed foods, and largely unaffected by the decreased energy requirements of individuals in the modern workplace. Thus, the demands on the healthcare systems have increased among the now burgeoning population of our older residents, currently the most rapidly increasing segment of Westernized countries.3
A congenic animal model of aging and obesity has been developed and characterized in our laboratory in an attempt to gain insight into specific biochemical, hormonal and pathophysiologic contributors associated with the metabolic characteristics of aging and obesity.4–8 The obese phenotype of the animal model demonstrates features marked obesity, insulin resistance, hyperamylinemia, hypercholesterolemia, an impaired capacity for non-shivering thermogenesis, and a propensity for a longer lifespan than has been reported in most other rodent strains.4 In contrast, the metabolic characteristics in the lean littermates remain within normal ranges for all elements measured.4 The effects of aging and obesity on metabolic, insulinogenic and thyroidal changes with advanced aging, and the capacity for energy expenditure via resting and noradrenaline stimulated oxygen consumption were determined in groups of congenic littermate lean and obese rats as described previously, where the presence of the obese trait (the -cp trait) represented the only known genetic difference between the lean and obese phenotypes. The origins of the LA/Ntul//-cp rat are depicted in Figure 1 and have been characterized by Michaelis, Tulp and others.4–8
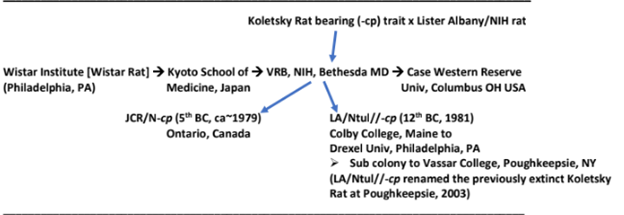
Figure 1 Origins of the LA/Ntul//-cp rat.
Adapted from Greenhouse.6
Groups of congenic lean and obese LA/Ntul//-cp rats were obtained from the Drexel breeding colony for progressive study of the metabolic effects of aging and obese phenotype from 5 to < 36 months of age (n=10 rats/group). Animals were fed Purina Chow #5054 with a reported caloric density of 3.4 kcals (14.2 kjoules per gram dry weight) ad libitum throughout the study. The diet composition analysis was listed by Purina as 55.6 % CHO, 22.5% protein, 4.5 % fat, 4.6 % crude fiber, 6% ash and 1.2 % essential vitamins and minerals including micronutrients. Body weights were determined periodically on an Ohaus animal balance to the nearest gram at 5, 15, 25, 30 (n=4 surviving obese only at ~30 months of age) and 36 months of age (lean phenotype only at 36 months of age).9,10 Measures of food intake computed as kcals/24 hours were determined in individual metabolic cages as described by Vedula et al.11 Measures of resting metabolic rate were determined with the animal canister compartment submersed in a circulating water bath at 30°C representing thermal neutrality with a Collins small animal respiration apparatus for rats (WE Collins Co, Braintree MA) as described earlier and expressed per kg BW-0.75 to allow for differences in surface area as described by Klieber & Weng et al.10,12,13 The thermic responses to noradrenaline (NE, 100 µg/kg BW, s.c.) taken 30 minutes post NE injection were determined immediately following the measures of RMR. The effect of cold exposure was determined after RMR by submerging the animal canister in ice water with a recorded temperature of 4°C and recording the values obtained 45 minutes after the cold exposure to minimize the immediate thermic effects that may have been secondary to initial shivering activity and expressed as ml. O2/min per kg BW0.75 as above. Fasting bloods were obtained at each age studied and serum isolated via centrifugation for determination of serum glucose concentrations (glucometer) and serum insulin, T4 and T3 concentrations via radioimmunoassay. Data were analyzed via standard statistical procedures. Trend lines are depicted as linear or polynomial (-3) best fit as indicated in the legend to each figure.14
Body weights or lean and obese rats are depicted in Figure 2 and indicate that the weight of obese rats was greater than twice the body weights of their lean littermates at 5 and 15 months of age and approached a 3-fold increase in body weights at 25 and 30 months of age. The differences in body weights were highly significant (p=<0.001) at all ages measured. Obese rats typically succumbed often before attaining 36 months of age, thereby limiting the availability of obese rats at older ages. Measures of energy intake were determined in replicate 24-hour measures and are depicted in Figure 3. These data indicate that daily energy intake of lean rats remained quite consistent at all ages measured at 5, 15 and 25 months of age, but decreased modestly in the oldest age group studied (36 months of age). In contrast, daily energy intake in the obese littermates demonstrated a 70% increase at 5 months of age and remained approximately approximately 2-fold greater than their lean littermates at all subsequent ages, reflective of the differences in body weights between lean and obese littermates as shown in Figure 2. The age-trend lines for body weights show a polynomial r2 value of 1.0 for both lean and obese phenotypes.
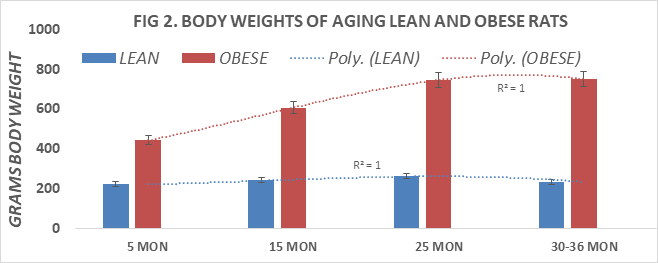
Figure 2 Body weights of lean and obese rats at 5, 15, 25, and 30-36 months of age, n= <10 rats/group.
Treatment groups by age.
Note: Final measurements in obese rats were taken at 30 months of age, in lean at 36 months of age.
No obese survived to 36 months of age in this study.
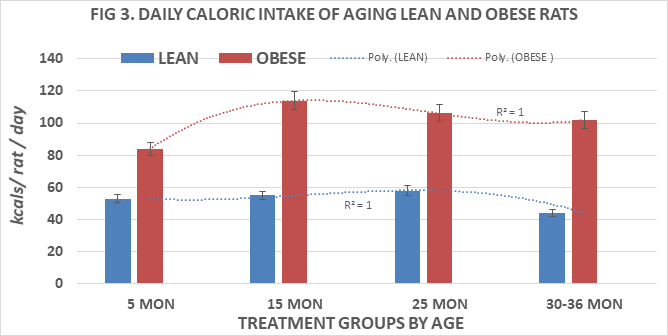
Figure 3 Effects of age and phenotype on daily caloric intake of rats. Data are mean±1 SEM, n= 10 rats/group except where noted (n=4 rats for the obese rats at 30 months of age due to premature mortality). P=<0.01 lean vs obese at all ages.
Measures of fasting serum insulin and glucose concentrations are shown in Table 1 below and indicate that all animals remained euglycemic throughout the age spectrum studies including only marginal increases in circulating glucose concentrations in the obese groups. In contrast, plasma insulin concentrations remained well within the normal range in lean animals but were markedly 3- to 4-fold elevated in the obese littermates at all ages studied. The resulting insulin to glucose ratios is depicted in Figure 4 and demonstrate that the insulin to glucose ratios became 4-to 5-fold greater in obese than in lean rats, consistent with decreased insulin sensitivity, development of moderate insulin resistance and progressive phenotype-linked increases in weight gain with aging (p=<0.01). The age-related polynomial trend lines for I:G ratios show an r2 value of 1.0 for both lean and obese phenotypes (Table 1).
Phenotype |
Lean |
obese |
||||
Age, months |
5 mon |
15 mon |
25 mon |
5 mon |
15 mon 25 mon |
|
Insulin, µU/ml |
30±6 |
35±611 22±7 |
139±12 |
113±11 |
109±2 |
|
Glucose, mM |
5.4±0.2 |
4.6±0.4 5.0±0.3 |
5.8±0.3 |
5.8±0.4 5.5±0.1 |
||
Table 1 Fasting serum glucose and insulin concentrations of aging lean and obese rats from 5 to 25 months of age
Data are mean ± 1 SEM, n= 10 rats/treatment group. P = < 0.01 for phenotype for Insulin, P=<0.05 for serum glucose at 15 months of age, and p=>0.05 for glucose at 5 and 25 months of age.
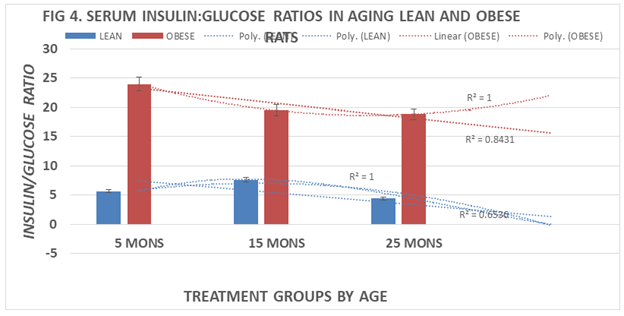
Figure 4 Effects of age and phenotype on serum Insulin: Glucose (I: G) ratios of rats. Data are mean±1 SEM, n= 10 rats/group except where noted (n=4 rats for the obese rats at 30 months of age due to premature mortality). P=<0.01 lean vs obese at all ages 5, 15, and 25 months of age.
Measures of serum T4 and T3 are depicted in Figures 5A & 5B and of T4:T3 nM ratios and T3:T4 nM ratios in Figures 6A & 6B, respectively. Serum T4 was greater at 5 months of age in both phenotypes than at all older ages and decreased significantly (p=<0.05 cf. to 5 months age data) thereafter in both lean and obese rats with the lowest values at the oldest ages measured. Serum T3 concentrations of lean and obese rats are depicted in Figure 5B and indicate that the serum T3 concentrations or lean rats increased only modestly between 5 and 15 months of age, remained only modestly greater than initial values at 25 months of age but decreased at 36 months of age to concentrations similar to those at 5 months of age. In contrast, serum T3 concentrations of obese rats were significantly greater than those of their lean and similarly fed lean littermates at each corresponding age, and continued to increase through 25 months of age with only a partial return to 5 month values by 30 months of age, the oldest age at which obese rats could be studied due to declining numbers of survivors beyond 25 months of age. Both T4:T3 ratios and T3:T4 ratios are depicted in Figure 6A & 6B respectively and indicate that serum T4:T3 ratios decrease progressively with age in both phenotypes, while the reciprocal serum T3:T4 ratios increase progressively with age in both lean and obese phenotypes with the most dramatic changes the obese phenotype. These observations are suggestive of differences in the outer ring T4-5’-deiodination process between lean and obese rats, resulting with greater T3 generation in peripheral tissues in the obese than in the lean littermates. The greater serum T3 and lower serum T4 values of obese animals occurred in the presence of decreasing RMR and is consistent with a decreased sensitivity to thyroid hormone actions in the obese phenotype and which diminished responsiveness to thyroidal actions on resting metabolic rates became progressively more significant with advancing age among obese rats. The age-related polynomial trend lines for serum T3 and T4 concentrations and for the nM T4:T3 and nM T3:T4 ratios show an r2 value of 1.0 for both the lean and obese phenotypes.
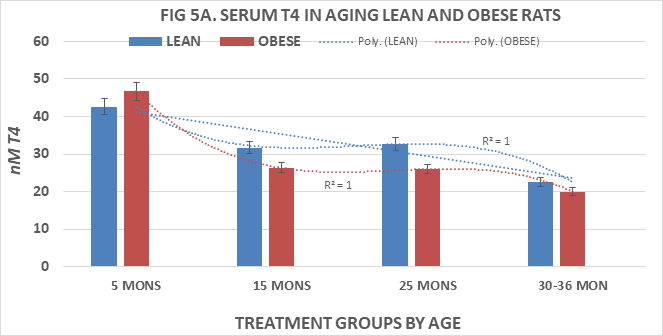
Figure 5A ThreeEffects of age and phenotype on serum T4 of rats. Data are mean±1 SEM, n= 10 rats/group except where noted (n=4 rats for the obese rats at 30 months of age due to premature mortality). P=<0.01 lean vs obese at all ages 15 and 25 months of age, p= n.s at 5 and 30-36 months of age.
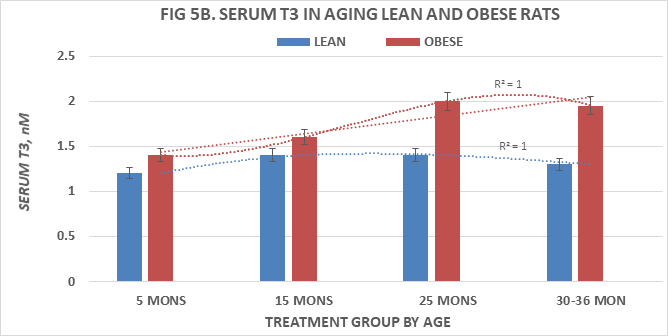
Figure 5B Effects of age and phenotype on serum T3 concentrations of rats. Data are mean±1 SEM, n= 10 rats/group except where noted (n=4 rats for the obese rats at 30 months of age due to premature mortality). P=<0.05 lean vs obese at all ages.
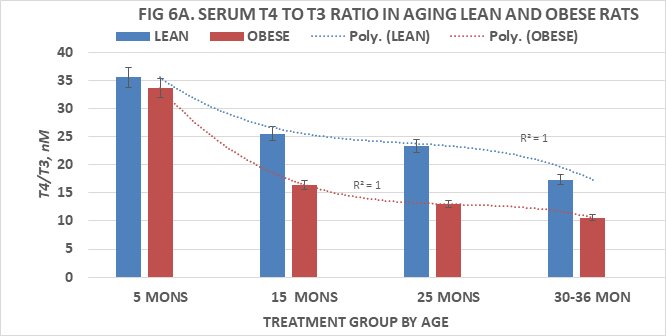
Figure 6A Effects of age and phenotype on serum T4:T3 of rats. Data are mean±1 SEM, n= 10 rats/group except where noted (n=4 rats for the obese rats at 30 months of age due to premature mortality). P=<0.01 lean vs obese at ages 15, 25 and 30-36 months of age, p= n.s at 5 months of age.
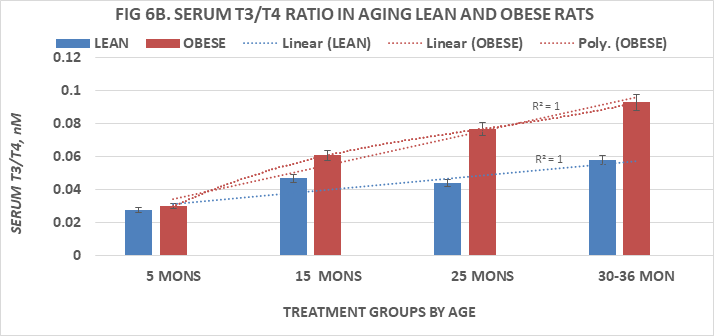
Figure 6B Effects of age and phenotype on serum T3:T4 of rats. Data are mean±1 SEM, n= 10 rats/group except where noted (n=4 rats for the obese rats at 30 months of age due to premature mortality). P=<0.05 lean vs obese at ages 15, 25 and 30-36 months of age, p= n.s at 5 months of age.
When measures of resting metabolic rats were determined in lean and obese rats (Fig 7A, 7B) it was observed that the RMR in lean rats tended to decrease progressively with advancing age beyond 15 months of age, and that the thermic response to norepinephrine was significant only at 5 and 15 months of age. The thermogenic responses to NE were markedly attenuated thereafter demonstrating a general downward trend pattern that was consistent with the measures of T3 concentrations in the younger but not the older obese rats. In contrast, the RMR of obese rats were lower than those of their lean littermates and also demonstrated an age-associated downward trend with advancing age. The thermic responses to NE administration were of less magnitude in obese than in lean rats, and also demonstrated a progressive downward trend with advancing age to 30 months of age, the oldest age at which obese rats were recorded due to diminishing numbers of animals remaining available for study that age. The thermogenic responses to 45 minutes of 4°C cold exposure is depicted in the gray panels to the right if the NE responses of Figures 7A & 7B and indicate that the thermic response to cold was robust at the younger ages but was markedly diminished at 36 months of age in lean rats. In obese rats the NE-stimulated thermogenic responses were decreased from 15 months of age. The polynomial-3 r2 of the trend lines of all three measures approach or equal 1.0, and the differences between lean and obese responses are significantly decreased with progressive aging.
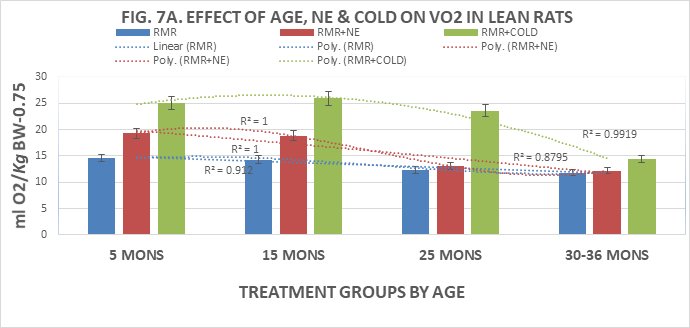
Figure 7A Effects of age and phenotype on RMR, NE, Cold exposure of lean rats. Note difference in vertical axis values max is 25 for obese, 30 for lean rats. Data are mean±1 SEM, n= 10 rats/group except where noted (n=4 rats for the obese rats at 30 months of age due to premature mortality). P=<0.01 lean vs obese at all ages 5,15, 25 and 30-36 months of age.
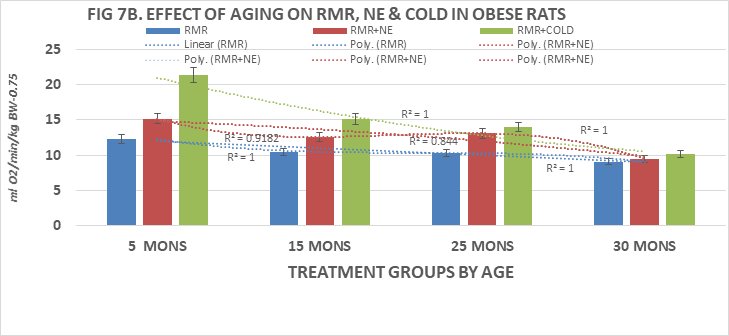
Figure 7B Effects of age and phenotype on RMR, NE, Cold exposure of obese rats. Note difference in vertical axis values max is 25 for obese, 30 for lean rats. Data are mean±1 SEM, n= 10 rats/group except where noted (n=4 rats for the obese rats at 30 months of age due to premature mortality). P=<0.01 lean vs obese at all ages 15, 25 and 30-36 months of age, p= n.s at 5 months of age.
The results of this study indicate that the resting metabolic rates of both lean and obese rats become progressively decreased in aging, with the most prominent decline at the oldest ages studied in both lean and obese rats. The decline in resting metabolic rates may be at least in part secondary to a decreasing capacity to elicit normal thermic responses to noradrenaline typically observed in younger rats following NE-administration and to maintain euthermia upon cold exposure at the oldest ages studied. Both norepinephrine and cold exposure are well-established and highly documented neurohormonal and environmental responses of non-shivering thermogenesis expression in younger rats and were clearly impaired in the obese phenotype, particularly at the oldest ages studied. While the number of surviving obese rats was necessarily lower for the 30-month aged obese rats, the trend of those remaining was deemed typical of obese rats of that advanced age, as few obese rats have survived well beyond 25 months of age. In healthy younger normally lean animals, the metabolic effects of thyroid hormones, particularly T3 contribute to approximately 45 % of the typical RMR values, in part via regulation of cellular ATP turnover, maintenance of the energetic demands of protein turnover, and energy dependent aspects of glucose oxidation. The RMR has been well recognized to decrease in aging in humans and other mammalian species, beginning soon after attainment of ‘middle age’ in humans and in aging rats as well.18
Other factors that may contribute to the decline in RMR include the development of insulin insensitivity, commonly referred to as insulin resistance, which also impacts processes of cellular glucose uptake via dysregulation of the intracellular translocation of insulin dependent GLUT-4 transporters in muscle and adipose tissue, accompanied with potential shifts in cellular energy sources away from glucose dependence to other macronutrient sources including amino acids and lipids. As sensitivity to the metabolic effects of insulin become decreased, the impact of hypersulinemia on lipogenesis in adipose depots contributes to the efficient storage of both dietary and endogenously formed lipids and increases in adiposity over time. The progressive development of insulin resistance also impacts the energetically expensive processes including both the energy demands of protein synthesis and expression of norepinephrine stimulated thermogenesis in brown adipose tissue, where insulin resistance has been shown to impede the normal thermogenic response.4,13,14
As peripheral mechanisms of energy expenditure become decreased, the dynamics of caloric efficiency of disordered energy utilization and of weight gain especially in animals that are epigenetically predisposed to the development of obesity from adolescence and beyond may contribute to the decreased RMR of aging. Once such process is the effect of insulin resistance on the biochemical regulation of protein turnover in skeletal muscle. Protein turnover represents the sum total of protein degradation and protein synthesis, where each new peptide bond formed requires the expenditure of 4 high energy phosphate bonds from ATP, thereby rendering it one of the biochemically most expensive processes of metabolism. The rate of protein synthesis also requires the ready intracellular availability of amino acids, which may be derived from the hormonally mediated processes of intracellular protein degradation.15–21 The elevations in circulating T3 are somewhat of an enigma that along with glucocorticoid activity, contributed to both protein degradation and expression of new protein synthesis. Thus, these dynamic processes are significant contributors to the economy of energy metabolism in various tissues. Moreover, the aberrations in age- and obesity-associated decreases in thyroidal activity at the cellular and peripheral tissue level suggest the likely progression of hormonal resistance to the metabolic effects of thyroidal activity, likely occurring at the nuclear T3 receptor level of organization. Previous studies have demonstrated decreased hepatic nuclear binding to T3 in addition to slower rates of T4 conversion to T3 in the obese phenotype of this strain.22 Both liver and brown adipose tissue are active sites of T4 deiodination to T3, which may also contribute to the economy of thyroidal actions during normal metabolism, and which appear to become compromised in both obesity and in advanced stages of aging in this strain of rat.23,24 In the present study, the serum T3 increased with aging in the obese phenotype, while resting metabolic rats and the thermogenic responses to exogenously administered norepinephrine or cold exposure were of lesser magnitude that was observed in their lean littermates of corresponding age. In the present study, circulating T3 concentrations were greater in obese rats than in lean rats of a corresponding age, while RMR values of obese rats were of lesser magnitude than observed in their lean littermates, suggestive of impaired thyroidal mediated actions in obese rats likely at a nuclear receptor level.
Because the progressive decreases in the RMR responses to cold and norepinephrine observed in the obese phenotype are not representative of the observation of increasing circulating T3 concentrations, these observations are highly suggestive of development of a state of thyroid hormone resistance in aging and obesity. Moreover, the impaired responses may contribute at least in part to the age-associated decline in resting metabolism and to an economy of energy utilization in the progression of aging and obesity. In normally lean rats, elevations in circulating T3 typically result in increases in resting metabolism in addition to potentially adverse cardiovascular pathophysiologic events and may pose a risk factor for longevity typical of untreated hyperthyroidism as a consequence. To the extent that the diminished metabolic responses to thyroid hormones in aging and obesity observed in the instant study may contribute to a survival attribute by conserving energy during normal isothermal environments remains an interesting explanation. The lean phenotype of the LA/Ntul//-cp rat under normal laboratory conditions has been observed to survive up to 4 years duration, while the projected lifespan of the obese phenotype is typically decreased by one third or more, seldom surviving beyond 30 months of age.4 The resulting decreased epigenetic expression of multiple thyroidal receptor-mediated elements on energy metabolism are proposed to make a beneficial contribution to the demonstrated longevity of this strain of rat. In moderation, the maintenance of adipose tissues as a compartment of energy storage represents a survival attribute in the wild, but when in excess, extraordinary adiposity including visceral adipose depots may contribute to other metabolic disorders thereby posing a compromise to longevity as is evident in the obese phenotype of this strain.
The origin of the increasing trend in serum T3 concentrations remains unclear, but likely occurs via a decreased magnitude of T4 outer ring deiodination in peripheral tissues, including muscle, liver, brown adipose tissue, and kidney, and which enzymatic activity reflects differing levels of activity following cold or other environmental activity.23-25 The active sites collectively contribute to maintaining circulating T3 levels during periods of dietary interventions or environmental exposure. In normally lean animals, the plasma concentrations of T3 correlate positively with resting metabolic rates, while in the current study, the gradually increasing circulating T3 concentrations in obese animals were inconsistent with the decreasing RMR and thermic responses to cold or norepinephrine administration, as circulating T3 levels become increased. The ongoing epidemic of obesity in Westernized and developed nations continues to pose health and economic burdens of great magnitude and of global proportions. Thus a greater understanding of the metabolic and physiologic implications that contribute to the disordered pathophysiology of obesity may help to elucidate newer and more effective therapeutic measures for management and resolution of the emerging epidemic.
The results of this study provide evidence of the development of resistance to the actions of thyroid hormones in aging and obesity, and which may contribute to the demonstrated and virtually unprecedented longevity of normally fed and housed lean and obese phenotypes of the LA/Ntul//-cp rat strain. The LA/Ntul//-cp rat represents a unique animal model of aging and obesity that has not been found to develop NIDDM or other pathophysiologic markers characteristic of more severe glucose intolerant states. Measures of RMR, the thermic response to both norepinephrine and cold stimulation become decreased with aging, while markers of insulin resistance and parameters of decreased insulin sensitivity become expressed, likely contributing to an improved economy of energy expenditure, conservation of energy reserves and to a protective metabolomic effect on longevity.
The authors are grateful for to Mr. H Pesiong and Dr. S Dubin for veterinary support and to Dr. S.P. DeBolt for data collection and analysis.
None.
None.

©2022 Tulp. This is an open access article distributed under the terms of the, which permits unrestricted use, distribution, and build upon your work non-commercially.