Advances in
eISSN: 2377-4290


Research Article Volume 6 Issue 4
1Department of Ophthalmology University of M nster Medical Center Germany
2Argus Center of Ophthalmology Argus Augenzentrum Mittelhessen Germany
Correspondence: Anne F Alex University of Muenster Medical Center Department of Ophthalmology Albert Schweitzer Campus 1 Building D15 48149 Muenster Germany, Tel +49-251-8356001
Received: February 03, 2017 | Published: March 21, 2017
Citation: Alex AF, Cordes S, Gietzelt C, et al. Quantification of optical In-Vivo imaging of retinal and choroidal neovascularisation and cell migration in the mouse fundus. Adv Ophthalmol Vis Syst. 2017;6(4):110-127. DOI: 10.15406/aovs.2017.06.00186
Purpose: To develop an objective quantification system for retinal and choroidal in vivo imaging in mouse models using auto fluorescence (AF), fluorescence angiography (FA), and optical coherence tomography (OCT).
Methods: In a mouse model for laser-induced choroidal neovascularization (CNV), imaging analysis was performed. First, the intensity ratio (mean fluorescent intensity[MFI] in defined laser spot sizes) was introduced to quantify AF. Second, MFI and lesion size for vessel permeability were calculated in FA, and third, OCT scale bars were analyzed and adjusted for real retinal thickness in vivo, introducing an OCT conversion factor. Inter- and intraobserver agreements were calculated using the Bland-Altman method and Spearman correlation analysis.
Results: Migration of fluorescent cells could be quantified with the intensity ratio. FA (fluorescein/ICG) proved to be a useful tool for the investigation of vessel integrity and vascular permeability and for indirect quantification of neovascularization and vessel quality. Especially in fluorescein angiography, laser spot size correlated positively with the amount of leakage. ICG was also applicablCe for quantitative analysis, but better in late-phase than in early-phase angiography. OCT quantification of retinal thickness in vivo showed a conversion factor of 1.194±0.03 between in vivo and ex vivo evaluation. Inter- and intraobserver agreement analysis showed a positive correlation of repeated measurements.
Conclusion: We suggest three new quantification methods for in vivo optical imaging in mice, using AF, FA, and OCT. A standardized quantification of these methods has the potential to enhance the comparability of results of independent preclinical studies in mice and improve the interpretation of data.
Keywords: quantification, optical imaging, retina, choroid, autofluorescence, angiography, optical coherence tomography
AF, auto fluorescence; FA, fluorescence angiography; OCT, optical coherence tomography; CNV, choroidal neovascularization; MFI, mean fluorescent intensity; CSLO, confocal scanning laser ophthalmoscopy; GFP, green fluorescent protein; ICG, indocyanine green; CI, confidence interval
In vivo imaging is a commonly used method in the daily ophthalmic examination. Several devices from different companies are available for imaging by means of fluorescence angiography (FA), optical coherence tomography (OCT), and auto fluorescence (AF). These methods can also be used in preclinical animal studies, e.g., in mouse or rat.1–3 The challenges in the application of these devices in non-human eyes are the different optical characteristics, especially in the rodent eye. A mouse eye has a very short axial length (mouse: 3.02 mm; human: 23.5mm) and a relatively large lens that fills almost the complete eye, which leads to strongly hyperopic refraction.4 This hampers the use of devices developed for the human eye. Even though optical imaging of the rodent eye, especially FA, has been performed for many years, still no agreed quantification system exists, which would allow to determine objective endpoints in animal studies.
Auto fluorescence
In the autofluorescence imaging (AF), the back of the eye is illuminated by light of a defined wavelength, and the resulting fluorescence produced by intrinsic compounds is detected. Nowadays, AF imaging is based on the principle of confocal scanning laser ophthalmoscopy (cSLO).Studies in which AF of lipofuscin (488 nm) and melanin (790 nm) in the mouse fundus were quantified have been performed before, using characteristic acquisition parameters and analysis algorithms.5 However, it is difficult to evaluate real differences in AF intensities. Choroidal neovascularisation (CNV) is a complication that occurs for instance in an advanced stage of age-related macular degeneration (“wet” AMD), initially inducing a local inflammation.6–8 In order to study various aspects of CNV, the experimental model of laser-induced CNV is frequently used. As previously shown in this model using the CX3CR1GFP/+ mice,9 resident microglia cells and circulating macrophages that show fluorescence at 488 nm excitation, transiently accumulate in the area of the laser spot.10 Here, we introduce a quantification method for fluorescent cells and/or proteins and their behaviour in this model.
Fluorescence angiography
Fluorescence angiography is one of the oldest imaging techniques in ophthalmology,11 As in AF imaging, light of a defined wavelength is used to elicit fluorescence. In contrast to AF, in fluorescence angiography (FA) a fluorescent dye is injected into the systemic blood circulation, therefore allowing visualisation of blood vessels.12 As an example, quantification of vessel leakage in laser-induced CNV has been performed using a grading system, in which two independent observers assigned fluorescence intensities to four stages of hyper fluorescence in comparison to a study-individual control.7 Such quantifications are not objective and not applicable in conditions where changes are not very obvious.
Optical coherence tomography
Optical coherence tomography (OCT) was developed more than 20 years ago and enables in vivo visualisation of retinal layers, thus allowing evaluation of the state of the living eye in patients. One of the most popular devices is the Spectralis® HRA+OCT that produces a resolution of to 7µm. OCT in the rodent eye is a challenge. Even though special animal devices are available that are adjusted to the optical peculiarities of a mouse eye, high-quality images are still difficult to obtain, since the optical properties of a rodent eye may vary, e.g., due to cataract developing during anesthesia. Moreover, the positioning of the eye of a living animal in front of the device cannot be reproduced exactly repeatedly in a longitudinal investigation. In the model of laser-induced CNV, OCT enables quantification of lesion size. Due to the anatomical differences in size and refraction between the mouse eye and the human eye, the scale may not be correct for rodent images.13 To our knowledge, no standardized method for comparable quantifications exists.
The described challenges of the practical procedure and acquisition of images are partially solved by the application of special animal devices. Quantification and interpretation of the data, however, is still done individually by each researcher and is not standardised, which makes it almost impossible to compare the results of different studies. In this investigation, we developed quantification methods for auto fluorescent particles and cells, for FA, and for OCT in a mouse model of laser-induced CNV, with the aim to achieve an objective comparison of data between in vivo imaging studies.
Laser-induced choroidal neovascularisation
Laser burns to elicit CNV were performed as previously reported.10 Briefly, the mice were anaesthetized with intraperitoneally injected ketamine/xylazine, 10% (WDT, Garbsen, Germany) and their pupils were dilated with Neosynephrin-POS® 5% and Cyclopentolate Alcon® 1% eye drops. The cornea was locally anaesthetized with Proparakaine® 1%. The mouse was positioned in front of the laser device and a glass slide coated with Methocel was placed on the cornea to achieve better visualisation of the fundus. Laser burns (diameter 50µm, duration 100ms, energy 200mW) were positioned on the retinal pigment epithelium and Bruch’s membrane and the successful rupture of these two layers was determined by optical confirmation of typical bubbles on the apical side of the retinal pigment epithelium–choroidal tissue.
Optical imaging
For all in vivo optical imaging techniques, the confocal scanning laser ophthalmoscope Spectralis® HRA+OCT (Heidelberg Engineering, Heidelberg, Germany) was used. The options offered by this device are shown in Table 1. The Heidelberg Eye explorer software (Version 1.7.1.0) was used for image analysis. Anaesthesia and pupil dilatation were performed as described above for each imaging technique. Pupil dilation was checked before imaging, as maximal dilation is necessary for optimal illumination of the mouse eye fundus. For longer examination times, the mouse was placed on a warmed pad to avoid cooling and associated cataract development.14 In AF and FA, a 55° field was imaged with averaging of 100 consecutive scans. In OCT, 25 consecutive frames were averaged using high-speed volume scans. The confocal plane was adjusted in infrared images. All experiments were approved by the local animal ethics review board (Landesamtfür Natur, Umwelt und Verbraucherschutz Nordrhein-Westfalen; LANUV). Animal treatment was in compliance with the ARVO (Association for Research in Vision and Ophthalmology) Statement for the Use of Animals in Ophthalmic and Vision Research.
488nm blue solid state laser (barrier filter of 500nm) autofluorescence → Fluorescein excitation, |
488nm without barrier filter → Red-free images |
790nm diode laser and barrier filter of 830nm →Indocyanine excitation |
820nm diode laser images →Infrared reflectance |
870nm super luminescence diode (SLD) laser → Spectral domain-OCT |
Table 1 Technical properties of the confocal scanning laser ophthalmoscope from Heidelberg Engineering (Spectralis® HRA+OCT)
Acquisition of AF and development of an intensity ratio
For visualisation of fluorescent cells or particles using the Spectralis device, the cells/particles must express proteins or molecules that can be excited to fluorescence by light of the wavelength of either 488nm or 790nm. In CX3CR1GFP/+ mice that express green fluorescent protein (GFP) in mononuclear phagocytes (kindly provided by Prof Dr Christian Kurts, Institute for Experimental Immunology, Bonn, Germany), dynamic observation of GFP positive (GFP+) phagocyte intraocular behaviour, migration and proliferation is possible in vivo repeatedly in the same animal. According to the fluorophore GFP, excitation was performed at 488 nm, and emission was measured at 520 nm. We evaluated the inflammatory response in drug-treated mice compared to vehicle-treated mice at 3, 7, and 14 days after laser treatment to establish in general whether our quantification method is also able to differentiate between study-individual interferences (ARVO abstract 2012; 7088). Quantification of AF in laser-induced CNV was done not only in the laser spot itself, but also in the immediate periphery. A decrease in perifocal fluorescence intensity and simultaneous increase in fluorescence intensity in the laser spot indicates migration of resident microglial cells in laser-induced CNV. A detailed presentation of the analyzed mice and laser spots can be found in Table S1 (supplementary data).
In areas of a defined size, the mean fluorescence intensity (MFI) caused by fluorescent particles, e.g. GFP+ cells, can be determined. Given the diameter of our laser spots (50µm), we defined a circular area of 116 pixels in diameter that best encircled the area of the laser spot in the digital images obtained in our study. The size of this area must be defined individually in different investigations, or can be retained if the same laser settings (laser spot size, laser energy) are chosen. Measurement of MFI of the selected areas was performed using the software Image J (available at http://rsb.info.nih.gov/ij/index.html). This software is capable of measuring the brightness of single pixels and assigns values between 0 (black) and 255 (white) to the pixels according to their brightness. When an area larger than one pixel is selected, Image J gives the average brightness of all pixels of the selected area, which we name MFI in our study.
In order to compare accumulation of GFP+ cells in the laser spots to their distribution in the retina outside the laser spots, MFI in a defined area surrounding a laser spot (non-treated area, called vicinity of the laser spot) was determined by selecting three areas adjacent to the laser spot with the same pixel size. Areas containing structures that did not show an AF signal, such as retinal vessels or the optic nerve head, were excluded from the analysis (Figure 1). A minimum of three to ten laser spots were analyzed per mouse eye (Supplementary data, Table S1).
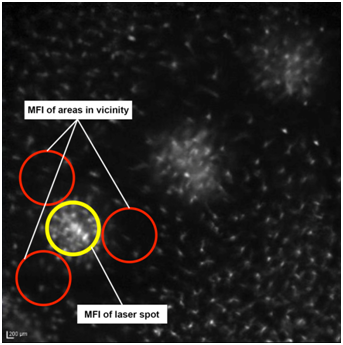
Figure 1 Placement of circles on in vivo AF images in laser-induced CNV. Representative image showing the placement of circles to measure the laser spot and adjacent areas using Image J software for autofluorescent analysis (MFI).
The intensity ratio was calculated as ratio between the MFI of the laser spot and the average MFI of the area in the vicinity of the laser spot:
This parameter provides a classification for the migration of GFP+ immune cells into the laser spots allowing comparison between different animals. An intensity ratio >1 describes an increased number of immune cells in the laser spot compared to the non-treated area of the back of the eye (in the vicinity of the laser spots)in this model. The comparison of the intensity ratio of drug-treated and vehicle-treated laser spots allows description of increased or decreased inflammatory response. This quantification method can be adapted to analyses of different fluorescent structures.
Acquisition of fluorescein and indocyanine green (ICG) angiography and development of a quantification method for vessel integrity and vascular permeability
In C57Bl/6Jmice (Charles River, Germany), 0.1 ml of 5ml/kg of the commercial 2% fluorescein sodium dye solution (Alcon Ophthalmica, Vienna, Austria; diluted 1:10 with physiological saline) was injected intraperitoneally. For ICG angiography, CX3CR1GFP/+ mice were intraperitoneally injected with 0.1 ml of 5mg/ml ICG solution (PULSION Medical Systems SE, Feldkirchen, Germany). To evaluate the integrity of the retinal vasculature, early (1–5 min after injection) and late-phase (5-10 min after injection) angiograms were recorded in the inflammatory phase (3 days after laser treatment) and in the neovascular phase (14 days after treatment). Changes in fluorescence in the area of the laser spots were quantified using the software Photoshop and used as a measure of vessel integrity and for evaluation of pharmacological treatments or genetic mutations.
For this purpose, angiography images had to be recorded with the same brightness. This was achieved by positioning the animals in front of the optics in a way that the optic nerve head was located in the images. The brightness of the vessels leaving the optic nerve head was adjusted to achieve a maximum brightness without overexposure. Overexposure could be clearly identified during image acquisition due to a different reflection pattern and noise in this area. Focal plane was adjusted in infrared images and then also used for angiography (Figure 2). For quantification, laser lesions were selected on an infrared image using Photoshop, and the selection was transferred to the image of the angiogram. It is important to determine the laser spot size in the infrared image, but not in the angiogram. Due to differences in leakage and consequently in the MFI, the laser spot border can be determined
properly only in infrared images.
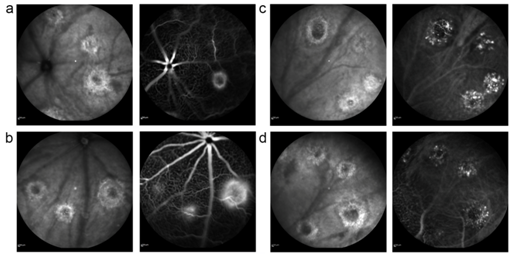
Figure 2 Different CNV lesion types on FA. Infrared images (left) and corresponding fluorescein (a,b) and ICG (c,d) angiograms (right) of a mouse fundus recorded 14 days after laser treatment. Early-phase angiography is shown in the upper row, late-phase angiography in the lower row (a). Two grade 0 lesions (upper image) and one grade 1 lesion (lower image) (b). Two grade 1 lesions and (right) one grade 2 lesions on fluorescein angiography.7
The lesion size and its mean brightness, represented by the MFI, were measured. Laser spots over large vessels were excluded from the analysis to avoid artificial increase of the MFI due to strong brightness of the vessels (Figure 3). We determined the distribution of MFI values in at least eight eyes in each experimental group (either fluorescein or ICG dye, 30 laser spots per eye) and compared the findings. A detailed presentation of the analysed mice and laser spots can be found in Table S2 (supplementary data).
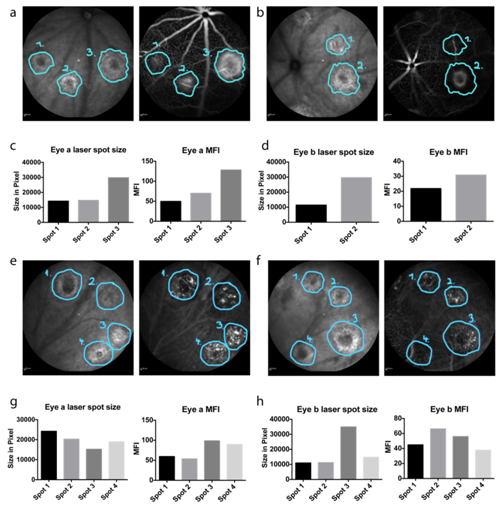
Figure 3 Placement of circles on in vivo FA images (a,b). Infrared images with corresponding fluorescein angiograms, in which the laser lesions have been surrounded in the infrared images and the labels have been transferred to the angiograms using the software Photoshop (c,d). Comparison of laser spot size and MFI (e,f). Infrared images with corresponding ICG angiograms, in which the laser lesions have been outlined in the infrared images and the labels have been transferred to the angiograms using Photoshop (g,h). Comparison of laser spot size and MFI.
As the mouse eye differs from human eye with respect to its optical parameters, the Spectralis device has to be adapted to the mouse eye. In order to achieve high image quality, the reference arm of the Spectralis® HRA+OCT device has to be adjusted for the strong hyperopic condition in the mouse eye in the OCT debug window, as reported before.15 Additionally, an add-on lens of +25 spherical dioptres was installed on the objective of the imaging device to compensate the anatomical differences. Images can be taken in horizontal and vertical scan directions, resulting in a “histology-like” retinal image, where the single layers of the retina can be identified similar to the human eye (Figure 4). In addition, volume scans through the laser spots are possible providing a three-dimensional view on the lesion. Retinal thickness and laser spot size were measured using the Heidelberg Eye Explorer software. The software displays infrared images and corresponding OCT images in one window on the computer screen for optimal orientation. Measurements can be made manually with differently shaped tools or automatically in a thickness profile as already described.16
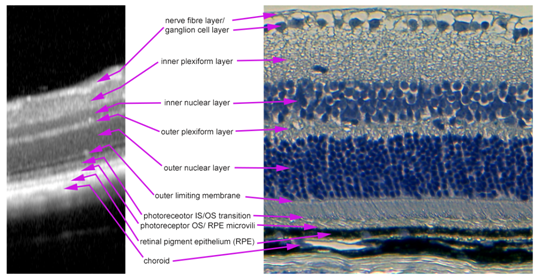
Figure 4 Layer segmentation in an in vivo OCT image. OCT image (left) and H&E stained paraffin section (right) of an intact mouse retina. All layers of the retina that can be seen in the paraffin section are also visible and clearly definable in an OCT image.
Analysis and quantification of laser-induced CNV in OCT scans should include measurement of retinal thickness to detect retinal oedema and/or fluid in the centre and in the vicinity of the laser spots (vertical analysis). We analysed these parameters at two time points, 3 and 14 days after laser treatment. Verification of the ratio of the OCT scale to the real proportions of the rodent retina was performed by comparison with paraffin sections of the imaged eyes. Using a transmission light microscope, digital images with scale bars were taken and analysed using Photoshop CS5 (Adobe Systems, Inc.). Thickness of intact retina was measured around detectable structures, such as laser spots, in the OCT image (using the scale provided by the OCT device) and the paraffin sections. To minimise the impact of modifications through fixation and the embedding procedure, 16 different sites in each examined eye were measured in both techniques. The examined eyes were measured twice by each technique. It has to be noted that manipulation during enucleation, fixation in formalin, the embedding procedure, cutting with the microtome, and H&E staining can all cause variations in the structure of tissue and therefore change the thickness of the retina.
Jiao et al.17 have shown that retinal thickness in histopathological paraffin sections decreases to about 80% of that in vivo (as can be determined in an OCT image), while choroidal thickness decreases to 50% of that in the normal structures, owing to paraffin embedding. For correlation, we were strictly measuring the intact retina from the nerve fibre layer to the beginning of Bruch’s membrane. To approximately compensate for the shrinking during histology procedures, the results of retinal thickness measurements in samples of histological sections were divided by 0.8:
Assumed “real” in vivo retinal thickness =
To obtain the “OCT factor” by which the Spectralis OCT scale differs from the assumed “real” in vivo retinal thickness, the ratio of thickness measured on OCT and “real” in vivo thickness was calculated for all measured parts of the retina. For this purpose, images of the same spot in the same eye were taken first by OCT and then, after histological processing, in the paraffin sections. This can be done around clearly detectable structures such as laser spots or the optic nerve head. The values obtained in the paraffin sections were divided by 0.8to obtain “real” in vivo thickness of the mouse retina. The “OCT factor” that has to compensate the change of the OCT scale due to different anatomies of human and mouse eyes, was calculated by the following formula for the pair of measurements of the same spot (Figure 5)
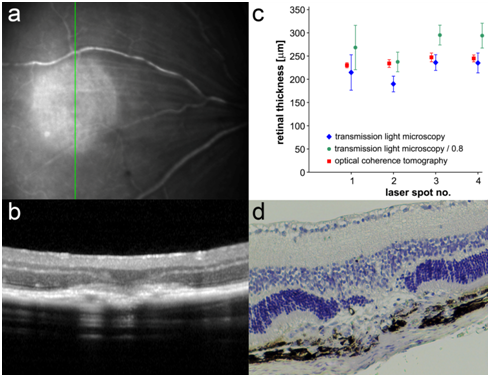
Figure 5 Quantification comparison between histology and OCT (a). Infrared image of a laser spot in a mouse retina 3 days after laser treatment. The green line indicates the scan direction of the OCT image in (b). (b) OCT of a laser spot in a mouse retina 3 days after laser treatment (c). Results of retinal measurements made with the software Heidelberg Eye Explorer on OCT and with Photoshop on the paraffin section for examples of laser spots (1 to 4) with and without consideration of loss of thickness during embedding (d). H&E-stained image of the laser spot shown in (b).
= OCT factor
Differences between groups were analysed with the Wilcoxon-Mann-Whitney U-test in statistical programs (Excel or SPSS). Charts were drawn using Graph Pad Prism. A detailed listing of the analysed mice and laser spots is given in Table S3 (supplementary data).
Paraffin sections and haematoxylin and eosin (H&E)-staining
Euthanasia and enucleation were performed on the day after in vivo imaging. After enucleation, eyes were fixed in 4% formaldehyde at 4°C. For embedding, eyes were incubated in 70% ethanol overnight, passed through an ascending ethanol series and xylol, and finally embedded in paraffin. The embedded eyes were stored at 4°C and cut using a microtome. Sections were prepared for H&E staining by deparaffinization and rehydration with a descending ethanol series and xylol. Staining was performed with H&E solutions followed by rinsing with tap water and passage through an ascending ethanol series. Sections were embedded in Mowiol and evaluated under a light microscope.
Statistical analysis
Prism (Graph Pad Software, Inc.) and IBM® SPSS® Statistics 22 software were used for statistical analysis. Graphs were drawn using Prism 5(Graph Pad Software, Inc.) and IBM® SPSS® Statistics 21 software. Results are expressed as mean±standard deviation (SD). Analysis of two independent groups was performed with the Wilcoxon-Mann-Whitney U‑test; three or more groups were analysed using the Kruskal-Wallis test. A p value of less than 0.05 was considered significant. Throughout this article, * indicates p<0.05, ** stands for p<0.01, *** signifies p<0.001, and n.s. means non-significant. Correlation analysis was done using Pearson correlation (where a value of +1 indicates a positive linear correlation, a value of 0 no correlation and a value of -1 a negative linear correlation). Details of the numbers of analysed mice and laser spots can be found in Tables S1-S3 (supplementary data). The Bland-Altman method was used for analysis of inter- and intraobserver agreements (Figure 6 & 7) (Table 2) and Spearman correlation for quantification of inter- and intraobserver agreement (Table 3).
Bland-altman |
Autofluoresc. MFI |
FA (Fluorescein) |
FA (ICG) |
OCT |
Light microscopy/0.8 |
R1-R2 (inter-observer) |
-.5385±0.9102 |
3.783±7.383 |
-0.9136±5.027 |
-0.0625±8.041 |
-11.19±23.21 |
R1 (intra-observer) |
0.2696±0.8906 |
4.999±8.558 |
0.4654±5.505 |
-1.563±5.979 |
4.649±9.007 |
Table 2 Mean differences and 95% CIs for interobserver agreements (R1-R2) and intraobserver agreements (R1) for AF ratio (MFI laser/MFI periphery), ΔMFI in FA with fluorescein and ICG, and retinal thickness in OCT and light microscopy. R1,reader 1; R2, reader 2
Spearman |
Autofluoresc MFI laser |
FA (fluorescein) |
FA (ICG) ΔMFI |
OCT |
Light microscopy/0.8 |
Interobserver |
0.9575 |
0.9737 |
0.9305 |
0.499 |
0.3988 |
P value |
<0.0001 |
<0.0001 |
<0.0001 |
0.0036 |
0.0355 |
Intraobserver |
0.969 |
0.9499 |
0.9299 |
0.4928 |
0.2225 |
P value |
<0.0001 |
<0.0001 |
<0.0001 |
0.0042 |
0.2209 |
Table 3 Correlation r analysis using Spearman nonparametric testing and significance P of inter- and intraobserver agreement for AF ratio (MFI laser/MFI periphery), ΔMFI in FA with fluorescein and ICG, and retinal thickness in OCT and light microscopy. R1,reader 1; R2, reader 2
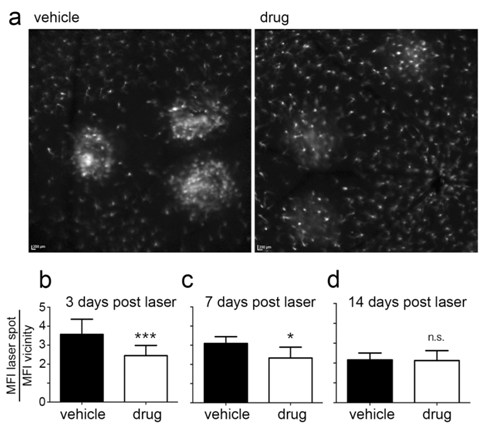
Figure 6 Determination of intensity ratios in in vivo AF images. Comparison of AF images obtained in a vehicle-treated and drug-treated mouse fundus 3 days after laser treatment (a). Results of AF intensity ratio determination are shown for the time points 3 days (b), 7 days (c) and 14 days (d) after laser treatment.
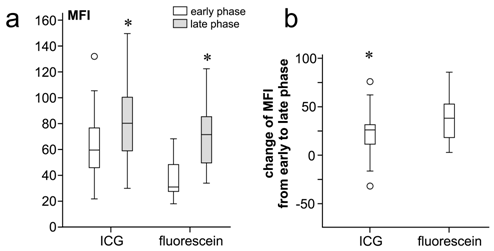
Figure 7 Quantification of mean fluorescence intensity (MFI) in in vivo FA images (a). A box plot comparing MFI values in early- and late-phase angiography with ICG and fluorescein. The increase of MFI from early to late phase was significant in both the ICG group and the fluorescein group. The MFI difference between ICG and fluorescein angiography was also statistically significant in the early phase, but not in the late phase (p = 0.05) (b). A box plot comparing the overall change in MFI from early to late phase between ICG and fluorescein angiography. The difference was not statistically significant (p=0.15; Mann–Whitney U-test).
Quantification of AF imaging with the intensity ratio
In our example of the laser-induced CNV mouse model, we observed a significant reduction in the inflammatory response due to anti-inflammatory drug treatment at 3 and 7 days after laser treatment. The intensity ratio was decreased by a factor of 0.64 (p<0.0001) and 0.74 (p=0.01), respectively. At 14 days after laser treatment, the immune cells’ response had recovered compared to vehicle-treated mice (difference not significant, n.s., p=0.328) (Figure 8). Acute and chronic anti-inflammatory effects could be quantified objectively by means of the intensity ratio. This parameter provides a direct relation between the mean fluorescent cell intensity in the laser spot and the adjacent periphery.
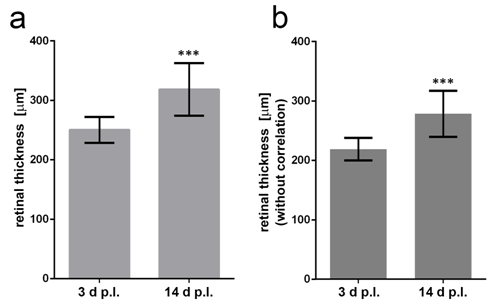
Figure 8 Quantification of retinal thickness in in vivo OCT images (a). Retinal thickness (correlated) in OCT images of the laser spots 3 and 14 days after laser treatment. Mann–Whitney U-test shows significant difference (U=16, Z=-3.453, p<0.001) (b). Retinal thickness (not correlated) in OCT images three and 14 days after laser treatment. Mann–Whitney U-test (U=16, Z=-3.453, p<0.001). The correlation does not change the outcome of the statistical significance (Mann–Whitney U-test).
Quantification of fluorescein and indocyanine green (ICG) angiography for vessel integrity and vascular permeability
FA with both dyes, fluorescein and ICG, showed a significant increase in MFI over time in laser-induced CNV areas, as demonstrated in Figure 2. Early-phase angiography showed lower MFI values than late-phase angiography (p<0.0001; Mann–Whitney U-test). The significant increase in MFI over time indicates leakage. In early-phase angiography, fluorescein showed lower absolute MFI values than ICG (fluorescein 37.74±15.68, ICG 63.43±24.87; p>0.0001). Late-phase angiography showed no statistically significant differences in absolute values between fluorescein and ICG (p=0.333 with Mann-Whitney U-test). The overall increase in MFI (hyperfluorescence) was greater in the fluorescein group, but the difference was not statistically significant (Figure 9).
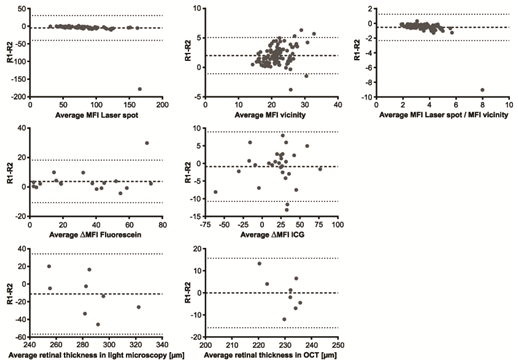
Figure 9 Bland–Altman analysis of various parameters for interobserver agreement. Representative results of statistical analysis (Bland–Altman method) for the evaluation of interobserver agreement between reader 1 (R1) and reader 2 (R2) for the parameters as indicated. The broken line in each diagram represents the mean value of the evaluated parameter, and the dotted lines the mean±1.96-SD.
In addition, we analysed the two following correlations: (1) correlation between laser spot size and MFI in early-and in late-phase angiography; (2) correlation between MFI in early-phase and MFI in late-phase angiograms. In fluorescein angiography, laser spot size and MFI showed a significant and positive correlation in the early phase. Larger spot sizes showed greater MFI values. (Pearson r=0.648; p=0.004). In ICG angiography, laser spot size and MFI did not clearly correlate, which again may be due to the different properties of ICG (early phase: Pearson r=0.152; late phase: Pearson r=0.047). Furthermore, the MFI in early-phase angiography corresponded with the MFI in late-phase angiography in both the fluorescein group (Pearson r=0.445; p=0.06) and in the ICG group (Pearson r=0.512; p=0.005). Stronger hyperfluorescence in the early phase resulted in stronger hyperfluorescence in the late phase. This showed that MFI in both phases, early and late, is a good parameter for the assessment of leakage and that our quantification method can be used to measure this leakage.
Quantification of retinal thickness in OCT with the OCT conversion factor
Representative results of retinal measurements in the laser spot in the OCT image and in images of the paraffin section with and without consideration of the reduction in thickness during embedding are shown in Figure 5c. Values obtained in OCT images vary much less than values obtained in paraffin sections. Therefore, OCT can provide information about retinal thickness with a higher reliability. The findings also underline that the “real” thickness of the mouse retina (measured retinal thickness/0.8) is higher than the thickness measured by OCT in our analysis. We calculated an OCT factor of 1.194±0.03.The retinal thickness in laser spots measured on OCT must therefore be multiplied by 1.194to obtains a value close to the “real” retinal thickness (Figure 5c). Retinal thickness measurements were performed in the centre of the laser spots 3 and 14 days after laser treatment with the OCT in C57BL/6J mice, and the real retinal thickness was calculated by multiplication with the OCT factor we obtained using our device (1.194). Mean retinal thickness in the laser spots on OCT 3 days after laser treatment was 219±19.08 µm uncorrected and 261.27±22.76 µm corrected. At14 days after laser treatment, the mean retinal thickness was 278.43±38.76µm uncorrected and 332.17±46.24µm corrected. The corrected mean retinal thickness increased significantly over time (Mann–Whitney U-test: U=16, Z=-3.453, p<0.001) (Figure 10).
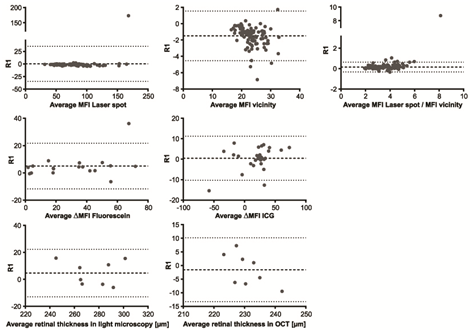
Figure 10 Bland-Altman analysis of various parameters for intraobserver agreement. Representative results of statistical analysis (Bland-Altman method) for the evaluation of intraobserver agreement for reader 1 (R1) for AF (a-c), ΔMFI in FA for fluorescein (d) and ICG (e), and retinal thickness for light microscopy (f) and OCT (g). The broken line in each diagram represents the mean value of the evaluated parameter, and the dotted lines the mean±1.96-SD.
Inter- and intraobserver agreement in AF, FA, and OCT
Autofluorescence imaging
Inter- and intraobserver agreements for AF showed a high correlation, with r=0.9575 (95% confidence interval .CI 0.9362 to 0.9718) for interobserver and r=0.9690 (95% CI 0.9535 to 0.9794) for intraobserver analysis (Table 3). An initial alignment of laser spot size measured in pixels can be applied once for different laser settings. The intensity ratio can be calculated as described. The calculated relation abrogates possible small differences in the initial settings of the laser spot diameter. With the same laser settings (laser spot size and laser energy), the same values for the laser spot diameter can be adopted even by other lab groups (Table 6). Mean differences and 95% CIs for interobserver agreements (R1-R2) and intraobserver agreements (R1), calculated using the Bland–Altman method, are listed in Table 5 and illustrated in Figure 6 and 10a-c. Bland–Altman plots show mean differences between the 95% CI of 1.96 standard deviations (Figure 6&7) (Table 2).
Fluorescence angiography
For FA both with fluorescein and with ICG, inter- and intraobserver agreements showed a high correlation. With fluorescein, the correlation for interobserver comparison was r=0.9793 (95% CI0.9271 to 0.9906) and for intraobserver comparison, r=0.9499 (95% CI of 0.8642 to 0.9820). With ICG, the correlation for interobserver comparison was r=0.9305 (95% CI0.8506 to 0.9684) and for intraobserver comparison, r=0.9299 (95% CI0.8495 to 0.9681) (Table 3). Mean differences and 95% CIs for interobserver agreements (R1-R2) and intraobserver agreements (R1) calculated using the Bland-Altman method are listed in Table 2 and illustrated in Figures 6&7.
Optical coherence tomography
In our analysis, inter- and intraobserver agreements were high for OCT imaging (Spearman r=0.4990, 95% CI 0.1714 to 0.7272 for interobserver agreement; r=0.2225, 95% CI -0.1474 to 0.5378 for intraobserver agreement). Interestingly, transmission light microscopy results showed lower agreements, with correlation of r=0.3988 and p=0.0355 for interobserver analysis and r=0.2225 and p=0.2209 for intraobserver analysis. This indicates an advantage for in vivo OCT imaging in longitudinal measurements of retinal thickness (Tables 2&3) (Figures 6&7).
The aim of our study was to establish a more objective method to quantify the findings of optical imaging. Acquisition of images with the small mouse eyes is difficult and yields variable results that may be difficult to assess. Therefore, an objective means of quantification is needed to avoid further disparities.
The possibility of longitudinal analysis of the same animal is an advantage of in vivo imaging techniques over observations in ex vivo paraffin-fixed eyes. It is also possible to measure different characteristics at the same time using the different imaging modalities. For AF imaging, we developed a method for the quantification of mobile fluorescent particles/cells in a selected area. Changes in amount and location depending on treatment and time were objectively measured using the intensity ratio. For the quantification of leakage in FA images, not only fluorescence intensity was taken into consideration but also lesion size. Of course, fluorescence intensity may vary with lesion size, and lesion size is difficult to define in angiography images. A combination of lesion size and MFI reflects changes in vascular integrity in the best way.
We saw a stronger increase of MFI with fluoresce in than with ICG, which can be explained by the different chemical properties of the two dyes. As ICG is bound almost completely to albumin and serum proteins, vascular permeability must be greater to result in the same amount of leakage. Fluoresce in is a small molecule and can leak out already at only slight loss of vessel integrity. Angiograms in which different dyes have been used should not be compared. We evaluated the applicability of fluoresce in and ICG angiography also in the laser-induced CNV model and showed that the analysis of angiograms 2 weeks after laser treatment was very reliable. At this time point, neovascularisation may have developed completely, and a leakage is fully visible if loss of vessel integrity occurs. At 3 days after laser treatment, other imaging techniques that detect mainly inflammatory changes might be more useful in this model.
We showed that in particular fluoresce in angiography is a valuable method for the quantification of vascular permeability in rodent eyes. We were able to verify the accuracy of the laser-induced CNV model as an animal model for exudative AMD.ICG showed less sensitivity in the early phase of angiography but is also useful in late-phase angiography and may be a helpful alternative when the fluorescein excitation wavelength of 488 nm is needed for the excitation of other markers (e.g., GFP). However, neither dye displays exactly the extent of CNV. This should be addressed with other techniques, such as immunohistochemical staining newly formed blood vessels (e.g., by isolectin B4 or an antibody against CD31). We have established an objective quantification method for FA in which the vascular integrity can be quantified by assessment of differences in fluorescence.
Using OCT, morphological changes can be visualised that do not impact vascular integrity and are not visible on FA, but still influence retinal oedema or retinal thickness (e.g., retinoschisis, retinal degenerations).Our measurements of retinal thickness showed less variation in OCT images than in paraffin sections (Figure 5c). Also, the reproducibility of measurement using OCT was superior to that obtained in paraffin sections. OCT imaging can provide more valuable and reliable information with less deviation (Tables 2&3). The differences between the mouse eye and the human eye can be compensated as described above, and the device can therefore be used with confidence for research in rodents. We calculated the OCT factors using data obtained from two repeated measurements at 32 different sites around laser spots, and the mean OCT factor can now be used as a general factor for converting measurements with the Heidelberg Eye Explorer software into the real thickness of the retina in vivo for all experiments under similar conditions performed by other groups of researchers.
Optical coherence tomography (OCT) angiography is a novel imaging method that drew a lot attention during the recent years. By this method, blood flow in retinal blood vessels can be visualised, and there are already several commercial OCT angiography devices available. We recently demonstrated feasibility of OCT angiography for the visualisation of the blood vessel network in the mouse eye, and also neovascular choroidal vessels could be imaged that grew after laser treatment.18 However, OCT angiography is still a very young method with some uncertainty in interpretation of the images. As only a few research laboratories have access to such a device, we did not deal with OCT angiography in this article.
We have developed objective quantification methods for the quantification of changes and variations that can be visualised by optical imaging methods in the mouse fundus, namely autofluorescence, fluorescence angiography and optical coherence tomography. Parameters such as leakage, retinal thickness and lesion size can be quantified with good intra and interobserver reproducibility. Evaluation of FA and OCT images can be performed as two independent and/or complementary methods in one study. These quantifications are independent of the interpretations of individual observers and provide a basis for inter-study comparison of results. Small changes can be recognized, described, and quantified to provide a basis for solid statistical analysis. This will improve the comparability of studies and facilitate determination of the clinical applicability of study results.
None.
The authors thank Gerburg Nettels-Hackert, Tanja Ishorst, and Tanja Plagemann for technical assistance, Raphael Koch for support with the statistical analysis (University of Muenster Medical Center, Institute for Biometry and Clinical Science), and Prof Dr Christian Kurts for the kind provision of the CX3CR1GFP/+ mice (University of Bonn Medical Center, Institute of Experimental Immunology (IMMEI), Bonn, Germany).
Supplementary data
Mouse |
Treatment |
Mean MFI laser spot |
Mean MFI periphery |
Ratio mean MFI laser spot/ |
1 |
Control |
86.502 |
22.785 |
3.859 |
2 |
Control |
66.843 |
19.165 |
3.490 |
3 |
Control |
75.990 |
23.589 |
3.260 |
4 |
Control |
69.785 |
20.979 |
3.316 |
5 |
Control |
65.892 |
19.124 |
3.469 |
6 |
Control |
80.093 |
21.103 |
3.761 |
7 |
Control |
68.823 |
18.600 |
3.700 |
8 |
Drug |
58.373 |
25.991 |
2.254 |
9 |
Drug |
80.779 |
33.782 |
2.401 |
10 |
Drug |
77.479 |
26.680 |
2.963 |
11 |
Drug |
73.818 |
26.146 |
2.824 |
12 |
Drug |
50.619 |
24.129 |
2.170 |
13 |
Drug |
78.688 |
38.550 |
2.039 |
14 |
Drug |
66.544 |
26.179 |
2.550 |
Table S1 Auto fluorescence pixel analysis
Table S1.1 Auto fluorescence pixel analysis 2 days post laser
Mouse |
Treatment |
Mean MFI Laser Spot |
Mean MFI Periphery |
Ratio Mean MFI Laser Spot/ |
19 |
Control |
78.946 |
25.545 |
3.092 |
20 |
Drug |
48.266 |
21.573 |
2.195 |
21 |
Drug |
62.941 |
25.470 |
2.462 |
Table S1.2 Auto fluorescence pixel analysis 7 days post laser
Mouse |
Treatment |
Mean MFI Laser Spot |
Mean MFI Periphery |
Ratio Mean MFI Laser Spot/ |
1 |
Control |
64.293 |
26.022 |
2.495 |
2 |
Control |
66.301 |
30.175 |
2.212 |
3 |
Control |
55.129 |
24.975 |
2.217 |
4 |
Control |
64.841 |
27.864 |
2.308 |
15 |
Control |
47.980 |
27.212 |
1.773 |
16 |
Control |
56.871 |
24.873 |
2.274 |
8 |
Drug |
68.178 |
35.501 |
1.916 |
9 |
Drug |
66.195 |
37.192 |
1.760 |
10 |
Drug |
54.377 |
27.657 |
1.967 |
11 |
Drug |
91.982 |
41.033 |
2.250 |
17 |
Drug |
39.444 |
17.296 |
2.305 |
18 |
Drug |
48.929 |
20.272 |
2.400 |
Table S1.3 Auto fluorescence pixel analysis 14 days post laser
Mouse |
Laser Spot |
Size (in Pixels) |
MFI Early Phase |
MFI Late Phase |
Δ MFI |
Control 01; OD |
1 |
15494 |
29.47 |
49.46 |
19.99 |
2 |
15646 |
29.15 |
68.78 |
39.63 |
|
3 |
33480 |
68.51 |
122.52 |
54.01 |
|
4 |
17786 |
27.63 |
47.57 |
19.94 |
|
5 |
23396 |
31.76 |
74.62 |
42.86 |
|
6 |
15680 |
41.74 |
44.24 |
2.5 |
|
7 |
16716 |
28.87 |
36.25 |
7.38 |
|
Control 03; OS |
1 |
16034 |
22.37 |
96.6 |
74.23 |
2 |
19405 |
25.35 |
77.92 |
52.57 |
|
3 |
18426 |
20.3 |
105.93 |
85.63 |
|
Control 03; OD |
1 |
26399 |
63.1 |
121.3 |
58.2 |
2 |
18502 |
47.95 |
85.07 |
37.12 |
|
3 |
22257 |
36.63 |
82.9 |
46.27 |
|
4 |
15197 |
18.05 |
57.02 |
38.97 |
|
Control 04; OS |
1 |
30421 |
50.5 |
54.37 |
3.87 |
2 |
37693 |
30.11 |
33.98 |
3.87 |
|
3 |
34831 |
65.83 |
85.38 |
19.55 |
|
4 |
26022 |
41.95 |
60.07 |
18.12 |
|
Drug 02; OD |
1 |
16242 |
20.1 |
42.59 |
22.49 |
2 |
18336 |
25.24 |
46.07 |
20.83 |
|
3 |
23140 |
33.2 |
86.81 |
53.61 |
|
4 |
32622 |
105.33 |
61.7 |
-43.63 |
|
5 |
14486 |
129.55 |
107.38 |
-22.17 |
|
6 |
25328 |
116.54 |
82 |
-34.54 |
|
Drug 03; OS |
1 |
27627 |
29.91 |
45.91 |
16 |
2 |
16181 |
33.69 |
45.21 |
11.52 |
|
3 |
16023 |
17.14 |
20.42 |
3.28 |
|
4 |
16865 |
77.44 |
65.42 |
-12.02 |
|
5 |
18048 |
77.4 |
70.21 |
-7.19 |
|
6 |
12853 |
30.79 |
35.85 |
5.06 |
|
Drug 03; OD |
1 |
11027 |
44.75 |
107.79 |
63.04 |
2 |
25517 |
83.59 |
115.97 |
32.38 |
|
3 |
18516 |
42.4 |
64.23 |
21.83 |
|
4 |
12760 |
4487 |
33.79 |
-11.08 |
|
5 |
34670 |
77.19 |
64.55 |
-12.64 |
|
6 |
16015 |
78.34 |
77.39 |
-0.95 |
|
Drug 04; OD |
1 |
13069 |
48.34 |
66.01 |
17.67 |
2 |
14181 |
40.63 |
53.64 |
13.01 |
|
3 |
12510 |
36.05 |
51.28 |
15.23 |
|
|
4 |
16590 |
53.58 |
84.64 |
31.06 |
Table S2 Fluorescence angiography analysis, single data values. FA, FIuorescein Angiography; ICGA, Indocyanine Green Angiography; OD, Oculus Dexter; OS, Oculus Sinister
Table S2.1 FA analysis 13 days post laser
Mouse |
Laser Spot |
Size (in Pixels) |
MFI Early Phase |
MFI Late Phase |
Δ MFI |
Control 01; OD |
1 |
25181 |
59.98 |
83.91 |
23.93 |
2 |
13750 |
56.55 |
84.97 |
28.42 |
|
3 |
16936 |
105.38 |
131.32 |
25.94 |
|
4 |
21245 |
91.91 |
120.76 |
28.85 |
|
5 |
14945 |
35.27 |
44.23 |
8.96 |
|
6 |
30758 |
45.55 |
71.35 |
25.8 |
|
7 |
30249 |
33.97 |
54.98 |
21.01 |
|
Control 03; OS |
1 |
13839 |
76.25 |
102.02 |
25.77 |
2 |
16057 |
50.67 |
85.34 |
34.67 |
|
3 |
15957 |
80.69 |
98.25 |
17.56 |
|
4 |
13836 |
46.26 |
59.28 |
13.02 |
|
5 |
16585 |
57.39 |
88.6 |
31.21 |
|
6 |
12820 |
59.39 |
93.39 |
34 |
|
7 |
14244 |
38.94 |
66.51 |
27.57 |
|
Control 02; OS |
1 |
16488 |
77.09 |
118.32 |
41.23 |
2 |
28729 |
73.9 |
149.8 |
75.9 |
|
Control 02; OD |
1 |
16802 |
21.65 |
47.69 |
26.04 |
2 |
18431 |
26.98 |
58.72 |
31.74 |
|
3 |
31646 |
76 |
68.29 |
-7.71 |
|
4 |
13678 |
98.96 |
67.02 |
-31.94 |
|
5 |
7627 |
60.83 |
47.85 |
-12.98 |
|
Control 03; OD |
1 |
7787 |
54.59 |
76.98 |
22.39 |
2 |
10598 |
72.77 |
98.74 |
25.97 |
|
3 |
12712 |
77.77 |
121.21 |
43.44 |
|
4 |
14422 |
67.62 |
129.64 |
62.02 |
|
5 |
29737 |
132.06 |
66.48 |
-65.58 |
|
6 |
17261 |
58.84 |
42.11 |
-16.73 |
|
7 |
13267 |
38.97 |
29.62 |
-9.35 |
|
Drug 02; OS |
1 |
8057 |
32.35 |
56.35 |
24 |
2 |
8551 |
38.42 |
64.63 |
26.21 |
|
3 |
16831 |
68.38 |
104.5 |
36.12 |
|
4 |
26535 |
47.61 |
84.76 |
37.15 |
|
Drug 02; OD |
1 |
12175 |
49.46 |
98.72 |
49.26 |
2 |
16827 |
46.75 |
102.11 |
55.36 |
|
Drug 03; OS |
1 |
15092 |
97.93 |
45.26 |
-52.67 |
2 |
12790 |
93.18 |
73.69 |
-19.49 |
|
3 |
13317 |
110.62 |
86.49 |
-24.13 |
|
4 |
33984 |
48.97 |
61.36 |
12.39 |
|
5 |
18258 |
45.14 |
58.08 |
12.94 |
|
Drug 03; OD |
1 |
27836 |
116.98 |
55.67 |
-61.31 |
2 |
16663 |
59.29 |
33.84 |
-25.45 |
|
3 |
16700 |
106.01 |
76.45 |
-29.56 |
|
4 |
12729 |
62.07 |
63.35 |
1.28 |
|
Drug 04; OS |
1 |
13557 |
75.88 |
72.94 |
-2.94 |
2 |
16216 |
79.39 |
58.11 |
-2128 |
|
3 |
19588 |
78.28 |
65.85 |
-12.43 |
|
4 |
10631 |
96.06 |
66.42 |
-29.64 |
|
5 |
8694 |
49.63 |
33.73 |
-15.9 |
|
Drug 01; OS |
1 |
10558 |
55.22 |
64.03 |
8.81 |
2 |
12947 |
71.47 |
75.11 |
3.64 |
|
3 |
12785 |
80.16 |
68.32 |
-11.84 |
|
4 |
21788 |
75.44 |
83.1 |
7.66 |
|
5 |
24912 |
115.74 |
139.82 |
24.08 |
|
|
6 |
20919 |
68.87 |
75.95 |
7.08 |
Table S2.2 ICGA analysis 13 days post laser
Eye Number |
Laser Spot |
Central Thickness |
Central Thickness (Correlated=*1.194) |
1 |
1 |
213.5 |
254.7055 |
2 |
250.5 |
298.8465 |
|
3 |
210 |
250.53 |
|
2 |
1 |
203 |
242.179 |
2 |
208 |
248.144 |
|
3 |
223.5 |
266.6355 |
|
3 |
1 |
187 |
223.091 |
2 |
206 |
245.758 |
|
3 |
230 |
274.39 |
|
4 |
1 |
243.5 |
290.4955 |
2 |
234 |
279.162 |
|
Mean ±SEM |
219±19 |
261.27±22.76 |
|
Table S3 OCT retinal thickness analysis. MRT: Mean Retinal Thickness; LS: Laser Spot
Table S3.1 MRT in the centre of laser spots, 3 days post laser
Eye Number |
Laser Spot |
Central Thickness |
Central Thickness (Correlated=*1.194) |
1 |
1 |
295.5 |
352.5315 |
2 |
292.5 |
348.9525 |
|
3 |
269 |
320.917 |
|
4 |
345 |
411.585 |
|
2 |
1 |
282.5 |
337.0225 |
2 |
318.5 |
379.9705 |
|
3 |
283.5 |
338.2155 |
|
3 |
1 |
274.5 |
327.4785 |
2 |
330 |
393.69 |
|
3 |
280 |
334.04 |
|
4 |
1 |
289.5 |
345.3735 |
2 |
234 |
279.162 |
|
5 |
1 |
213.5 |
254.7055 |
2 |
261.5 |
311.9695 |
|
3 |
207 |
246.951 |
|
Mean±SEM |
278.43±38.76 |
332.17±46.24 |
|
Table S3.2 MRT in the centre of laser spots, 14 days post laser
Eye |
OCT |
Paraffin |
Paraffin/0.8 (Real Retinal Thickness) |
Ratio |
Eye 1 – Measurement 1 |
224 |
255 |
318.75 |
1.1530115 |
234 |
198.7 |
248.375 |
||
234 |
234.3 |
292.875 |
||
236 |
221 |
276.25 |
||
233 |
168 |
210 |
||
238 |
184 |
230 |
||
247 |
221.1 |
276.375 |
||
240 |
228.2 |
285.25 |
||
236 |
201 |
251.25 |
||
222 |
207.3 |
259.125 |
||
251 |
260.1 |
325.125 |
||
239 |
266.7 |
333.375 |
||
227 |
234 |
292.5 |
||
241 |
168.9 |
211.125 |
||
256 |
228 |
285 |
||
234 |
224 |
280 |
||
Mean±SD |
237±9.04 |
218.77±29.58 |
273.46±36.98 |
|
Eye 1 – Measurement 2 |
224 |
192.64 |
240.8 |
1.211228 |
230 |
189.49 |
236.8625 |
||
234 |
196.27 |
245.3375 |
||
234 |
263.09 |
328.8625 |
||
195.57 |
244.4625 |
|||
228 |
202.63 |
253.2875 |
||
227 |
233.781 |
292.22625 |
||
245 |
242.69 |
303.3625 |
||
230 |
245.74 |
307.175 |
||
228 |
188.26 |
235.325 |
||
227 |
266.46 |
333.075 |
||
234 |
248.67 |
310.8375 |
||
230 |
212.86 |
266.075 |
||
215 |
228.91 |
286.1375 |
||
224 |
227.66 |
284.575 |
||
237 |
235,01 |
293.7625 |
||
237 |
||||
Mean±SD |
230.25± 6.8 |
223.10±26.6 |
278.89±33.25 |
|
Eye 2 - Measurement 1 |
212 |
192.94 |
241.175 |
1.206369 |
228 |
220.22 |
275.275 |
||
228 |
216.09 |
270.1125 |
||
221 |
251.66 |
314.575 |
||
21.,2 |
272.75 |
|||
228 |
201.17 |
251.4625 |
||
235 |
230.87 |
288.5875 |
||
237 |
194.45 |
243.0625 |
||
224 |
224.72 |
280.9 |
||
223 |
221.48 |
276.85 |
||
241 |
224.78 |
280.975 |
||
224 |
210.66 |
263.325 |
||
205 |
196.47 |
245.5875 |
||
232 |
205.85 |
257.3125 |
||
226 |
232.06 |
290.075 |
||
224 |
254.92 |
318.65 |
||
235 |
||||
Mean±SD |
226.43±9.08 |
218.53±18.43 |
273.17±23.04 |
|
Eye 2 - Measurement 2 |
228 |
243.67 |
304.5875 |
1.2042006 |
233 |
238.92 |
298.65 |
||
232 |
240.7 |
300.875 |
||
225 |
240.63 |
300.7875 |
||
242 |
205.76 |
257.2 |
||
232 |
194.68 |
243.35 |
||
228 |
216.87 |
271.0875 |
||
223 |
197.18 |
246.475 |
||
222 |
194.05 |
242.5625 |
||
237 |
224.13 |
280.1625 |
||
226 |
252.86 |
316.075 |
||
222 |
257.29 |
321.6125 |
||
232 |
216.49 |
270.6125 |
||
232 |
190.19 |
237.7375 |
||
236 |
227.85 |
284.8125 |
||
231 |
204.86 |
256.075 |
||
Mean±SD |
230.06±5.66 |
221.63±22.3 |
277.04±27.87 |
|
Correlation |
|
|
|
1.1937±0.0273 |
Table S3.3 MRT and correlation coefficient analysis of the periphery of the laser spots, 3 days post laser
Author declares that there is no conflict of interest.

©2017 Alex, et al. This is an open access article distributed under the terms of the, which permits unrestricted use, distribution, and build upon your work non-commercially.