eISSN: 2576-4500


Research Article Volume 4 Issue 2
Department of Nuclear, Plasma & Radiological Engineering, University of Illinois at Champaign-Urbana, USA
Correspondence: Qiheng Cai, Department of Nuclear, Plasma & Radiological Engineering, University of Illinois at Champaign-Urbana, Urbana, IL, 61801, USA, Tel +15712679353
Received: May 01, 2020 | Published: May 21, 2020
Citation: Cai Q, Miley GH. Optimization of ion flow rates in a helicon injected IEC fusion system. Aeron Aero Open Access J. 2020;4(2):43-49. DOI: 10.15406/aaoaj.2020.04.00105
The Helicon Injected Inertial Electrostatic Confinement (IEC) offers an attractive D-D neutron source for neutron commercial and homeland security activation neutron analysis. Designs with multiple injectors also provide a potential route to an attractive small fusion reactor. Use of such a reactor has also been studied for deep space propulsion. In addition, a non-fusion design been studied for use as an electric thruster for near-term space applications. The Helicon Inertial Plasma Electrostatic Rocket (HIIPER) is an advanced space plasma thruster coupling the helicon and a modified IEC. A key aspect for all of these systems is to develop efficient coupling between the Helicon plasma injector and the IEC. This issue is under study and will be described in this presentation. To analyze the coupling efficiency, ion flow rates (which indicate how many ions exit the helicon and enter the IEC device per second) are investigated by a global model. In this simulation particle rate and power balance equations are solved to investigate the time evolution of electron density, neutral density and electron temperature in the helicon tube. In addition to the Helicon geometry and RF field design, the use of a potential bias plate at the gas inlet of the Helicon is considered. Biasing the plasma potential can increase the downstream ion velocity, but the optimal bias is a complex function of the Helicon parameters. In general, the results indicate that ion flow rate could be optimized by increasing the power supply, properly modifying the helicon tube length, radius and bias plate voltage. The selection of helicon configuration parameters, including power supply, helicon tube length, radius and bias voltage to optimize ion flow rates in a steady-state discharge are quantitatively presented based on the developed global model. This provides a guide for future experiments plus further investigations using 2 and 3 D modeling.
Keywords: IEC, HIPPER, global model, Helicon, space propulsion, thruster, plasma propulsion
IEC, inertial electrostatic confinement; PFR, pulsed fusion rocket; HIIPER, helicon inertial plasma electrostatic rocket; RF, radio frequency
Inertial Electrostatic Confinement (IEC) is a unique approach to fusion and plasma energy systems, was conceptualized in the 1960s (e.g., pioneering work by Hirsch1), and has been developed by Miley et al.,2-4 at the University of Illinois at Urbana-Champaign (UIUC). A hazardous radionuclide is not included in an IEC generator using the D-D reaction, which represents minimal radiological health concerns.4 Additionally, with the advantages of being lightweight and compact, the IEC potentially provides an attractive portable neutron source for activation analysis applications.5 In order to produce a high specific impulse and variable thrust for unmanned deep space exploration, the concept of the Viper Pulsed Fusion Rocket (PFR) is proposed.3 Furthermore, an advanced space propulsion concept, which is known as the Helicon Injected Inertial Plasma Electrostatic Rocket (HIIPER) including a helicon plasma source and a modified IEC, is proposed.6 The helicon source is to generate a high-density plasma, and the IEC grids is to extract the ions and produce a thrust. Note that a jet of electrons is produced by the IEC grids for a neutralized plasma exhaust. Coupling efficiently the helicon source to the modified IEC is significant since the efficient combination of these two sections allows for a large flow rate of ions, providing a sufficient thrust for space propulsion. Thus, ion flow rate is an important parameter to investigate in this paper. Additionally, considering that Williams et al.,7 used a magnetically shielded anode to bias the discharge plasma potential and electrostatic grids for ion acceleration, Ahern et al.,6 added a grid on the upstream end of the helicon section, which is biased to positive voltages to enhance the downstream flow velocity. By using the ion tracking simulations of the computational program COMSOL Multiphysics, it is found that bias voltage could significantly influence the velocity of ions passing through the IEC grid setup in the simulation. The bias voltages of 90 V and 180 V are corresponding to 31,400m/s and 21,300m/s, respectively. Therefore, the influence of bias voltage on the ion flow rate is significant to investigate in this paper.
Energy is typically used to investigate ion-pumping effect in high-density helicon discharges. Kaufman8 initially proposed an analytical model of electron bombardment ion thrusters. Milder9 made a survey and evaluation of research related to theoretical models of the plasma discharge for Kaufman thrusters. Masek10 presented a semi-empirical approach which requires detailed plasma data as inputs to evaluate the performance of ion thrusters. Brophy11 developed a model of ion thruster performance with simple algebraic equations and a modest number of parameters. In order to investigate plasma equilibrium for cylindrical discharges, Lieberman & Lichtenberg12 proposed a simple cylindrical discharge model to estimate the plasma parameters and their variation with respect to pressure, power and source geometry. In order to further investigate the evolution of plasma density and electron density for a given system and a known supplied power, a time-dependent global model is proposed by Lee.13 Yoon et al.,14 used the time-dependent volume-averaged global model to investigate the ion-pumping effect by adjusting the absorbed power and the neutral gas density, and found that the results of ion-current density match well with the experimental ones. Additionally, Cho15 developed a self-consistent global model of neutral gas depletion to investigate the temporal behavior of the electron temperature and density of helicon plasma, and indicated that the depletion of neutral gas is explained successfully by the numerical results. Goebel et al.,16 developed a global zero-dimensional discharge model to self-consistently evaluate plasma parameters in a magnetic ring-cusp ion thruster. By using this model, the thruster discharge loss as a function of mass utilization efficiency is predicted successfully. Charbert et al.,17 indicated the model based on16 does not consider the power transfer from the radio frequency (RF) to the plasma, and the neutral gas heating. Thus, a global model including neutral gas temperature and RF power transfer is proposed. It is found that with the increase of gas flow rate, the mass utilization efficiency decreases fast while the RF power transfer efficiency increase significantly. In addition, Lucken et al.,18 developed a simplified 2D global model using insights of a fluid model and Particle-In-Cell (PIC) simulations to accurately evaluate edge-to-center plasma density ratios.
The purpose of this paper is to quantitatively investigate optimization of the ion flow rate using a developed global model including bias voltages. Additionally, power supply, helicon tube length and radius are investigated for quantitatively evaluation of ion flow rate optimization. We demonstrated that ion flow rate could be increased by enhancing the power supply, and properly modifying length and radius. Moreover, modest bias voltages could contribute to increasing ion flow rate. In addition, the results of sheath length related to the bias plate in the upstream of helicon tube are presented and discussed with respect of bias voltages and power supply.
Experimental setup
The experiments, named as the Helicon Injected Inertial Plasma Electrostatic Rocket (HIIPER), are performed at the Fusion Studies Laboratory (FSL) in the University of Illinois at Urbana-Champaign (UIUC), and the schematic is shown as Figure 1. The helicon plasma source consists of a quartz tube, which has a radius of 2cm and a length of 60cm, with a 1/2 turn helical m=+1 mode antenna, which is made out of a copper strap insulated with kapton tap and is connected to an automatic L-type matching network fed by an RF power supply. Note that though the maximum RF power supply could achieve 1250 W, the RF power was generally kept to 300 W in experiments in order to avoid heating issues. Additionally, the tube is surrounded by water-cooled electromagnets, which are custom built by Arnold Magnetics and could supply up to 1200 G axial magnetic field. A circular metal meshed grid with a diameter of approximately 1 inch is placed on the upstream end of the helicon plasma source section, immediately before electromagnets. The meshed grid, which is known as helicon bias grid, is capable of biasing the plasma to a positive voltage up to 180 V, limited by the power supply availability. As for the IEC section, there is a single IEC grid, which is biased to -3 kV and attached with a Langmuir probe towards the downstream end of the helicon tube, placed in the center of a spherical grounded vacuum chamber with a 305mm radius. In HIIPER experiments with the operating pressure of 0.2 Pa, corresponding to 1.5 mTorr, the gas temperature of 400 K, and the magnetic field of 1000 G, argon was fed into the upstream end of the helicon tube at 3 SCCM, corresponding to argon particle flow rate 1.23×10¹⁸ atoms/s,19 and ionized by the helicon antenna and electromagnets. Then, Ions would be extracted by the IEC grid system. Thus, significant parameters (i.e., electron temperature and plasma density) would be evaluated by measurements using the Langmuir probe. In addition, in order to prevent the issue of plasma loss and increase the coupling efficiency between the helicon tube and the IEC chamber, a metal bellows is used to provide flexible connection between them.
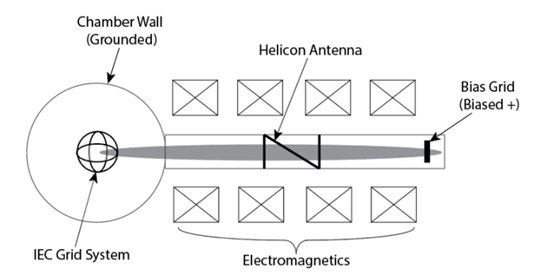
Figure 1 Schematics of the Helicon Injected Inertial Plasma Electrostatic Rocket (HIIPER) experiment setup.
Model formulation
Global model
In order to numerically analyze the optimization of ion flow rate in HIIPER experiments, a developed time-dependent global model including bias voltages is proposed in this paper. The particle conservation equations and the energy conservation equation are included in this model. At steady state, in which electron density ne is equal to the ion number density ni, the particle conservation equation illustrating that the electron-ion pairs generated by the ionization should balance the loss due to walls and radiative recombination could be written as:14
dnedt=dnidt=KiznNne−αn2e−μBnedeffdnedt=dnidt=KiznNne−αn2e−μBnedeff (1)
where Kiz, nN, α, µB, and deff represent the ionization rate coefficient, the neutral number density, the radiative recombination coefficient, the Bohm velocity and the effective plasma size, respectively. Note that the electron loss rate at sheath, which is represented by the third term of Equation (1), is equal to the ion loss rate due to ambipolar diffusion. Based on,20 the ionization rate coefficient Kiz is
Kiz=a1,izexp(−a2,izTe)Kiz=a1,izexp(−a2,izTe) (2)
where a1,iz and a2,iz are 1.235×10⁻¹³ m3/s and 18.69 eV, respectively, for argon.
Additionally, the radiative recombination coefficient α with unit of m3/s could be calculated as21
α=10−20(EizkTe)[0.4+12ln(EizkTe)+0.4(EizkTe)],α=10−20(EizkTe)[0.4+12ln(EizkTe)+0.4(EizkTe)], (3)
where k and Te represent Boltzmann constant and electron temperature, respectively. The Bohm velocity is calculated as µB=(eTe/mi)1/2, where mi is the mass of ion for argon, and e is the elementary electron charge. Since the radial loss of electron density is neglected considering that the magnetic field is applied in axial direction, the effective plasma size is given by deff=L/2hL with hL=0.86(3+L/2λi)-1/2,12 where hL is the plasma density at the axial sheath edge normalized to the electron density, L is the length of helicon tube, λi is the ion-neutral mean free path.
The electron temperature Te could be obtained from the following energy conservation equation
ddt(32nekTe)=PabsV−PcV−Γedeff2kTe−Γideff[eVs+kTe2+eΦb]−α32kTen2e,ddt(32nekTe)=PabsV−PcV−Γedeff2kTe−Γideff[eVs+kTe2+eΦb]−α32kTen2e, (4)
where V=πR2L represents the volume of plasma, with the radius of helicon tube R, Pabs is the power absorbed by plasma, and Pc/V represents the rate of energy loss per unit volume due to electron-neutral collisions, which could be expressed as
PcV=nenN(Kizεiz+Kelεel+Kexεex)PcV=nenN(Kizεiz+Kelεel+Kexεex) (5)
where nN represents the number density of neutrals, Kiz, Kel, and Kex are the rate coefficients with εiz, εel, and εex being corresponding energies lost per ionization, elastic, and excitation collisions, respectively. These values could be calculated based on.20 Assuming that the diffusion is ambipolar and the plasma is electrically neutral, the electron flux Γe should be equal to the ion flux Γi, and could be estimated as Γe = Γi = neµB = niµB. On the RHS of Equation (4), the third term represents the power loss due to Maxwellian electrons, for which the mean kinetic energy lost per electron lost is 2Te. The fourth term represents the kinetic energy loss due to walls for ions, whose initial potential is increased by the bias voltage Φb. Vs is the sheath voltage at downstream of the helicon tube, which is approximately 4.7Te for argon. Additionally, Te/2 represents the potential drop across the presheath, which contributes to accelerating the ions to the Bohm velocity. The last term is the power loss due to the recombination between ions and electrons.
Cho15 considered the fraction of neutrals that recycle in the helicon tube, and indicated that numerous neutrals would be recycled if the chamber, which is connected to the source, is large or the neutrals are recombined at walls, where no pump line is in the vicinity. The particle conservation equation for neutrals could be written as
dnNdt=β(nN0−nN)−KiznenN+αn2e+γneμBdeff,dnNdt=β(nN0−nN)−KiznenN+αn2e+γneμBdeff, (6)
where β could be calculated as β=S/(nN0V) with particle flow rate S in unit of atoms/s, and equilibrium neutral gas density nN0, which could be obtained by ideal gas law for given pressure and temperature. Note that γ is the fraction of recycling neutrals, which are related to the configuration of a specific device. This value would be determined by modifying γ in the global model to match the numerical results well with the experimental measurements. The Equations (1), (4) and (6) could be solved simultaneously to find the time evolution of electron density ne, electron temperature Te, and neutral density nN.
Finally, the ion flow rate Γion could be obtained as
Γion=hLneμB,Γion=hLneμB, (7)
In order to compare with the experimental measurements from,19 we have following parameters for numerical simulations: the helicon tube length L0=60 cm, the helicon tube radius R0=2 cm, the pressure p=1.5 mTorr, the neutral gas temperature T=400 K, the particle flow rate S=1.23×10¹⁸ atoms/s, and the mean free path λi=2 cm for the pressure of 1.5mTorr. Since the bias voltage could be used to modify the electron temperature and plasma density in a grid system22 and Equation (7) indicates that ion flow rates are also related to these two parameters, we conclude that ion flow rates could be optimized by biasing voltage properly. In numerical simulations, the Radiative recombination coefficient and rate coefficients are varied according to bias voltages. In these simulations, the initial electron density is set at 1017 m-3, and the initial electron temperature is set at 0.001 eV. For the range of bias voltages considered here the initial conditionsdo not influence convergent results significantly. Thus, it is found that the time step Δt=10-7 s is sufficiently small for adequate convergent.
Determination of sheath length for a positive bias grid
Note that the positive bias grid is placed at the upstream of the helicon tube, it is significant to investigate the sheath corresponding to this bias grid. The profile of electric potential Φ based on HIIPER experiment setup is illustrated in Figure 2, where z indicates the opposite direction of ion flow. The ions, which is biased by the grid, have higher initial potential, and then propagate along the opposite direction of z. Based on Figure 6.1 of,12 which illustrates the typical qualitative behavior of sheath and presheath in contact with a wall without a bias grid, the potential in the region of bulk plasma and presheath decreases while the quasi-neutrality still hold. After ions are accelerated due to the potential drop Φp, which is Te/2, and achieve the Bohm velocity, potential of ions would further fall through a DC sheath, which is produced by the grounded IEC chamber wall and the IEC cathode, with the wall potential Φw and its thickness s. Note that for argon, Φw ≈ 4.7Te. Compared with Figure 6.1 of,12 in Figure 2, ions have a higher energy, which is initially increased by Φb such that electron temperature and plasma density can be modified to increase the downward ion flow rate. Thus, the total energy εi for ions, which are initiated from the bias grid and finally bombard the wall, is approximately 5.2Te + Φb. This value is corresponding to the fourth term on the RHS of Equation (4). In order to estimate the sheath length related to the bias grid, we assume this sheath is a matrix sheath with a uniform ion density. Additionally, we know that Φp, the potential drop from point 0’ to 0, is Te/2, and assume that ns and nb represent the ion density at point 0 and 0’, respectively. Then according to the Boltzmann relation, nb could be calculated by nb = ns/ e-Φp/Te≈ 1.65ns. Note that ns is equivalent to the electron density ne at steady state, which could be obtained by the global model. Thus, in the region of sheath (Bias) with thickness s’, the ion density is constant as nb.
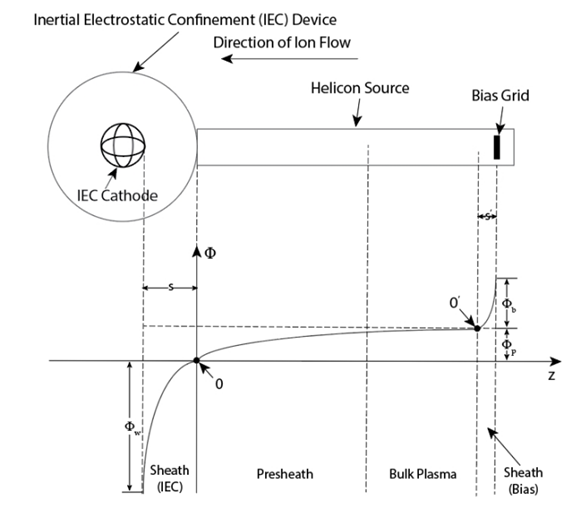
Figure 2 Schematics of the electric potential as a function of position in the plasma configuration based on the HIIPER experiment setup.
Setting the potential corresponding to the point of 0’ as zero, based on the Maxwell’s equation (2.2.3) in,12 we have
dEdz=−enbε0,dEdz=−enbε0, (8)
where E represents the electric field in the region of sheath, which is positively biased, with the opposite direction of z, and ε0 is the permittivity of free space. Then the electric field E could be obtained by
E=−enbε0z,E=−enbε0z, (9)
Applying dΦ/dz = -E, the potential Φ could be given by
Φ=enbz22ε0,Φ=enbz22ε0, (10)
Since the potential Φ=Φb at z=s’, the sheath length is
s'=(2ε0Φbenb)1/2, (11)
Using the electron Debye length λDe=(ε0Te/enb)1/2 at the sheath (Bias) edge, we have
s'=λDe(2ΦbTe)1/2, (12)
Thus, the sheath thickness could be scaled by the Debye length.
Considering that the fraction of recycling neutrals γ is an important parameter to investigate in our global model, we compared our numerical results, using different recycling fraction, with Chen’s experimental measurements,19 which is shown as Figure 3. We can find that with the increase of absorbed RF power, the electron temperature would increase, and for relatively large power supply, which is larger than 100 W, the numerical results for smaller fraction, which is 0.9, is significantly larger than the ones for larger fraction, which is 0.97. Additionally, when γ=0.97, the numerical results match the experimental ones well. Thus, this fraction value, γ=0.97, is determined to use in our numerical simulations.
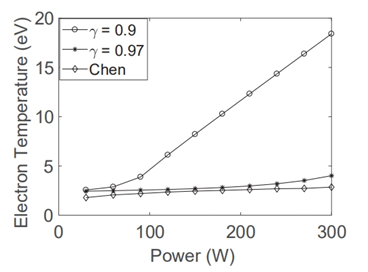
Figure 3 Electron temperature as a function of absorbed input RFpower for different neutral recycling fraction γ compared with experimental measurements from Chen.19
In order to investigate the temporal behavior of electron density ne, electron temperature Te, neutral gas density nN, and ion flow rate Γion for different RF power supply, we plot Figure 4 as follows. By comparing Figure 4(a) & 4(c), we can find that, in a steady state, with the increase of absorbed RF power, the electron density increase while the neutral gas density decrease. Additionally, longer time is required to achieve the equilibrium state for larger RF power. Figure 4(b) illustrates that with the increase of RF power, the electron temperatures would increase, which are corresponding to Figure 3 as approximately 2.41 eV, 2.56 eV, and 3.60 eV, respectively. From Figure 4(d), we can further find that the increase of absorbed power could increase the ion flow rate.
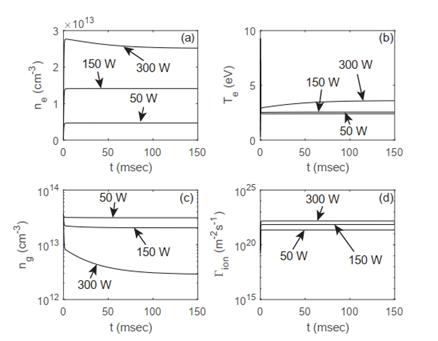
Figure 4 The time evolution of (a) electron number density, (b) electron temperature, (c) neutron number density, and (d) ion flow rate for different absorbed RF power of 50 W, 150 W, and 300 W, respectively.
In order to further investigate the relationship between absorbed RF power and ion flow rate, Figure 5 is shown as follows. Figure 5(a) illustrates that with the increase of absorbed RF power, the ion flow rate increases initially. When the absorbed RF power achieves approximately 300 W, the ion flow rate remains almost stable, which is approximately 1.5×10²² m-2s-1. Additionally, this value is approximately 21 times the value of 150 W, and 66 times the one of 50 W. Thus, we conclude that 300 W is relatively low and efficient to achieve desired ion flow rate. Note that ion flow rates are significantly related to electron density and electron temperature such that corresponding results are presented in Figure 5(b) & 5(c), respectively. In Figure 5(b), we can find that the electron number density increases initially, then achieves the maximum value, which is approximately 2.5×10¹⁹ m-3, and finally decreases. In Figure 5(c), for relatively low absorbed RF power, the electron temperature increases gradually from 2.37 eV at 10 W to 3.60 eV at 300 W, and then greatly increases to 18.33 eV at 1000 W. Additionally, according to,12,15 the electron number density in steady state could be estimated as ne=Pabs/(µBAeffεT), where Aeff=2hLπR2, and εT is the total energy lost per electron-ion pair created from the system, which includes the collisional energy losses εc, the mean kinetic energy lost per electron lost, which is 2Te, and mean kinetic energy lost per ion lost εi, which is approximately 5.2Te for argon. In addition, the collisional energy losses εc could be estimated as (Kizεiz+Kexεex+3KelmeTe/mi)/Kiz, where me is the electron mass. We note that the electron number density is negatively proportional to εT. When the power is 50 W, the total energy lost εT is approximately 79.4 eV. With the increase of power supply, εT achieves its minimum value of 64.4 eV at 300 W, and then increases to 152.9 eV at 1000 W. Thus, the electron density would decrease while the power increases for relatively large power supply, the decrease of electron number density would offset the increase of Bohm velocity µB, which is corresponding to the increase of electron temperature, such that for a relatively large power supply, which is larger than 300 W, the ion flow rate remains stable while the power supply increases.

Figure 5 (a) Ion flow rate, (b) electron number density, and (c) electron temperature as a function of absorbed RF power.
To investigate the influence of helicon geometry on the ion flow rates, we plot the ion flow rates as a function of the normalized helicon length and radius using L0 and R0 as references, respectively. From Figure 6(a), we find that the ion flow rate optimization could be obtained by modifying helicon tube length properly. For example, For Pabs=150 W, L/L0 should be 0.4 to obtain the maximum of ion flow rates, which is approximately 7.58×10²¹ m-2s-1. For Pabs=300 W, L/L0=1.1 is proper to achieve its maximum, which is about 1.51×10²¹ m-2s-1. Additionally, we find that the increase of the absorbed RF power from 150 W to 300 W could lead to larger ion flow rate, which is corresponding to Figure 4(d) & 5(a). Figure 6(b) & 6(c) illustrate that with the increase of normalized length, the electron temperature mainly decreases while the electron number density increases. Thus, electron number density contributes more to the increase of ion flow rate than electron temperature. Furthermore, for Pabs=300 W, in Figure 6(c), we note that while the electron temperature increases modestly for relatively larger normalized helicon tube length, the ion flow rate does not increase significantly.

Figure 6 (a) Ion flow rate, (b) electron density, and (c) electron temperature as a function of normalized helicon tube length with different absorbed RF power 150 W and 300 W, respectively.
As for the normalized radius shown in Figure 7(a), we can find that relatively small helicon tube radius would significantly contribute to the increase of ion flow rate. Considering that the Child law sheath could be of order of 100 Debye lengths, which is approximately 1cm, in a typical processing discharge,12 the helicon tube radius in our experiments, which is 2cm, is proper. From Figure 7(b) & 7(c), we can find that with the increase of radius, the electron temperature and electron density mainly decrease. Additionally, the results of ion flow rate and electron density would converge gradually with the increase of radius.

Figure 7 (a) Ion flow rate, (b) electron density, and (c) electron temperature as a function of normalized helicon tube radius with different absorbed RF power 150 W and 300 W, respectively.
Considering that the plasma parameters could be modified by bias voltage such that the ion flow rate can beoptimized, the influence of bias voltage on the ion flow rate is a significant factor to investigate. In Figure 8(a), we find that with the increase of bias voltage, the ion flow rate increases, achieving the maximum, and then decreases. For Pabs = 150 W, the bias voltage should be 8 V to obtain the maximum, which is approximately 1.57×10²² m-2s-1. For Pabs = 300 W, the maximum of ion flow rate is about 1.63×10²² m-2s-1 with the bias voltage of 20 V. Note that ion flow rate for the power supply of 300 W remains almost stable while the bias voltage increases. Figure 8(b) illustrates that the electron density for 300 W is mainly smaller than 150 W. Additionally, Figure 8(c) shows that, for relatively large bias voltage, with the increase of bias voltage, the electron temperature achieves maximum, and then decreases, which illustrates that the electron temperature is positive proportional to the ion flow rate such that the main contribution of the ion flow rate optimization is electron temperature. The offset between the increase of electron density and decrease of electron temperature explains the modest variation of ion flow rate for relatively large bias voltage.
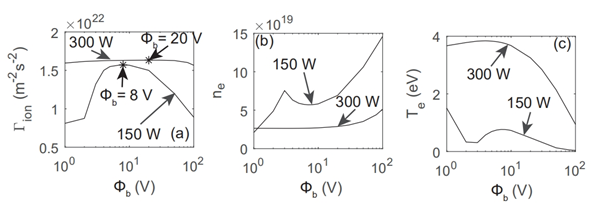
Figure 8 (a) Ion flow rate, (b) electron density, and (c) electron temperature as a function of bias voltage with different absorbed RF power 150 W and 300 W, respectively.
Furthermore, the estimation of sheath length due to the bias grid is shown as Figure 9. We can find that the matrix sheath length would enhance with the increase of bias voltage. For Pabs=150 W, the sheath thickness would increase from 1.2 times of Debye length for bias voltage of 1V to 72.8 times for bias voltage of 100 V. For Pabs=300 W, the sheath thickness is 0.7 times of Debye length for bias voltage of 1V, and 14.6 times for bias voltage of 100V. Additionally, we conclude that higher absorbed RF power contributes to larger matrix sheath length.
The principal results in this paper could be summarized as follows:
Important experimental insight has been obtained from prior and present University of Illinois researchers, Drew Ahearn, George Chen and Erik Ziehm. Financial support from the Edwards Air Force Base and from NPL Plasma Physics, Inc. is gratefully acknowledged.
Authors declare that there is no conflict of interest.

©2020 Cai, et al. This is an open access article distributed under the terms of the, which permits unrestricted use, distribution, and build upon your work non-commercially.