eISSN: 2576-4500


Research Article Volume 3 Issue 1
Mechanical Engineering Department, Amirkabir University of Technology, Iran
Correspondence: S Najafinia, Mechanical Engineering Department, Amirkabir University of Technology, 424 Hafez Ave, Tehran, Iran, Tel 9.89E+11, Fax 9.82E+11
Received: May 14, 2017 | Published: January 3, 2019
Citation: Najafinia S, Montazerin N, Kalaei H. Investigation of structures in a highly turbulent mixing layer by using LDA and SPIV. Aeron Aero Open Access J. 2019;3(1):1-9. DOI: 10.15406/aaoaj.2019.03.00075
There is lack of experimental study on significance or even presence of Brown and Roshko structures in highly turbulent environments. The setup configuration of this experiment is specifically designed to complicate creation and development of these structures by introducing high turbulence intensities. The flow considered is a plane, incompressible, fully developed mixing layer with two airstreams of different turbulence intensities. The Laser Doppler Anemometry (LDA) provides good temporal resolution across the mixing layer to obtain statistical descriptions and the Stereoscopic Particle Image Velocimetry (SPIV) provides good spatial resolution to investigate spatial coherencies. After defining the self-similar region, SPIV measurements are made in this region and different decompositions of Galilean, Reynolds and proper orthogonal decomposition are applied. Characteristics of a mixing layer are well studied and well documented, and the comparisons reveal that the high level of turbulence prevents structures from rolling up in a coherent manner; however, there exists temporary orderly oscillations. This compelling aspect requires appropriate techniques. The Morlet wavelet transform is applied to study non-stationary nature of the flow and a new method similar to the pseudo flow visualization is proposed to ascertain the results. Good qualitative agreements have been observed. The approach proposed is useful to extend the field of view in SPIVs measurement so as to realize larger wave numbers and is of practical significance in flow visualization.
Keywords: turbulent mixing layer, pseudo extended flow, LDA and SPIV, quasi periodic flow
A mixing layer is one of the most important free shear flows. Downstream of splitter plate trailing edge, two streams merge, and transport and diffusive terms initiate mixing, and further downstream, velocity (or any property) discontinuity gradually smoothes out. Mixing layers are ubiquitous and occur frequently in natural phenomena or man-made apparatus. From a practical point of view, mixing enhancement is a key topic for many industrial applications. It plays a vital role in performance of flow reactors, combustion chambers and also a variety of aerospace applications such as jet engine combustors and noise generation in propulsion systems.1,2 There is abundant literature discussing mixing layers analytically, experimentally and computationally. The analytical method is mostly concerned with the boundary layer approximation employed at locations well beyond splitter plate trailing edge. Moreover, the initial development of a mixing layer has been described very satisfactorily by linear stability. Its formation and development are described in a review by Ho & Huerre3 and Liu.4
Furthermore, there have been many experimental researches in order to both verify numerical simulations and also improve our understanding. A notable example is the discovery of large–scale coherent structures in a mixing layer by Brown & Roshko.5 After the realization, there have been numerous investigations on origins, evolutions and dynamics of these structures namely, rollers and ribs.6‒8 Two dimensional waves initially grow exponentially with the distance form a trailing edge via the Kelvin Helmholtz instability and roll up to vertical spanwise structures called rollers. The sequence of rollers is not ideally arranged in same transverse positions. Thus, rollers may have different convection velocities of upper or lower stream, and therefore, interactions such as vortex paring or shredding are possible.9
In spite of significance of coherent structures, Chandrsuda et al.,10 suggested that strong reservations may exist regarding the general order or even the existence of structures which are entirely tied to initial flow disturbances and levels of turbulence. Bernard11 observed that vertical structures at the greatest downstream distance were very sensitive to small perturbations in the implementation of numerical schemes. Even in some cases, it leads to non-identifiable structures. High free stream turbulence causes rollers to breakdown earlier and higher degree of turbulence even prevents vortices from rolling up in a coherent manner. Even introducing turbulence into low or high velocity-side affects the extent of two dimensionality of a flow.3 Accordingly, initial conditions play important role and need clear clarification. These observations suggest that coherent structures are not intrinsic to every mixing layer, and this is the case we address in this paper.
To date, much of experimental investigation delves into coherent structures,12,13 and flow conditions and experimental configuration are prepared to facilitate their occurrence. There is distinct lack of data on the subject complicating the creation and evolution of the structures in a non-favorable environment. The issue regarding significance or even presence of these structures in highly turbulent environments initiates this study. This compelling aspect requires more elaborate procedure. This paper is mainly concerned with the experimental investigation of naturally excited mixing layer of two air streams with medium turbulence intensity in high-velocity side and high-turbulence intensity in low-velocity side. This experiment was performed by LDA and SPIV which provides us with well-resolved temporal and spatial measurements respectively.
The organization of this paper is as follows. The next section discusses the flow configuration and experimental apparatus. Sect. 3 is dedicated to statistical descriptions common to all mixing layers and particular scales of the flow and turbulence. This section characterizes the mixing layer generally and makes comparison and data verification possible. Sect.4 delves into revealing structures of the flow by using different decompositions. In sect. 5, the frequency of oscillations and their corresponding amplitudes in time-frequency space is analyzed. Regarding this respect, a wavelet transform is applied to investigate quasi periodic behavior of the flow. Sect. 6 discusses a new method of visualization which is better suited to the nature of the flow. Finally, sect. 7 summarizes the results along with their significance and consequences.
Flow configuration
The data is obtained from experimental configuration shown in Figure 1, and the Cartesian coordinate frame with the origin at the center of the trailing edge is defined. In this experiment, an open loop wind tunnel (suction type) is used and the measurements are carried out in both up- and downstream of the self-similar region of a subsonic plane mixing layer with stream velocities of Ua=24.4 m/s and Ub=14.8 . Two air streams with a velocity ratio of r=UbUa=0.6 merge at the beveled trailing edge with the half angle of α=6° . The test section is square (300*300 m2 ) and 2000 mm long. In order to generate a uniform flow, a honeycomb and a lace is placed at the upstream end of the test section. There is an extra honeycomb (14mm cell size, 200mm deep) placed below the splitter plate in the low-velocity side at the location of 300 mm upstream of trailing edge which introduces both velocity loss and turbulence intensity whose relative intensity is about 5%. The present method of adding free-stream turbulence affects both the lower boundary layer on the splitter plate and the free-stream turbulence simultaneously. The convectional thickness (δ99) of the lower boundary layer is negligible, but the upper one is about 10mm and both of them are fully turbulent. The turbulent level of the high-velocity side, outside of the boundary layer, is less than 2%.
Instrumentation
The experiment is performed by LDA and SPIV which are both non-intrusive laser diagnostic techniques. The former is a single–point measurement technique that can provide temporal evolution of turbulence. On the other hand, the latter (SPIV) is laser sheet imaging technique that allows measurement of a spatial field but with much lower rate compared to LDA. The measurement points and the field are summarized in Table 1. The single-point measurements are performed with 2-D LDA system of Dantec, which consists of Argon-Ion Laser (wavelength 488 or 514.5nm), a transferring system, two photo multiplier systems, a transmitter and a PC with its dedicated software. A lens focuses the two beams to form the measurement volume of at a focal length of 310mm. To remove directional ambiguity, a frequency shift of 40MHz was set.
Techniques |
Location (cm) |
Δ (cm) |
SPIV |
80 (center) |
Δx=10, Δy=10 (FOV) |
LDA |
50, 60, 70, 80, 90, 100 |
Δy=1 (spacing) |
Table 1 Measurement techniques and associated measurement locations
The velocity field was measured by SPIV which consists of a double-cavity Quantel Brilliant Nd-YAG laser, a synchronizing timing hub, Dantc laser sheet delivery system, two FlowSense® CCD cameras with 1600×1186 pixel and AF Micro Nikkor® lenses. The Flow manager software (version 4.6) was used to extract three components of velocity by employing double images using two cameras in a stereoscopic arrangement. The field of view (FOV size) is equal to lx×ly=10×10cm2 , and the final interrogation area is selected to be 32*32 corresponding to interrogation area spot size of 2.37mm. For the target area, statistical properties are calculated based on 1000 3-D vector maps. The time between laser pulses is selected so that the maximum seed displacement between two pulses is about one-fourth of the interrogation area size, which reduces the probability of loss-of-pairs in procedure of data extraction. It is estimated to be , and then the exact value of the Δt is selected according to the agreement of LDA and SPIV results which also serves as a validation step.14,15
Clear air is invisible to LDA and SPIV, therefore seeding is required. The SAFEX F2010pluse fog generator is used. In order to consider seeding particles as ideal tracers, generated particle should satisfy the following criteria:
According to the Safex manual, the expected particle diameter is equal to 1 micrometer. As a result, the particle response time and therefore the stocks number is negligible. As the stocks number approaches zero, seeding particles behave like ideal tracers provided that particles self-interaction is insignificant.
The normalized mean longitudinal velocity profiles of SPIV data at x=80cm is shown in Figure 2 and the profile behaves as expected from literature and approximated to be:
U−UbUa−Ub=12(1+erf(η−η0))
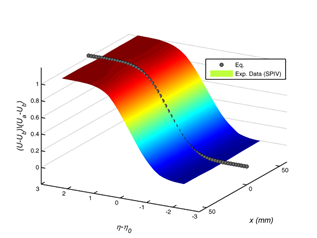
Figure 2 Distribution of the Normalized streamwise mean velocity along the FOV and the profile of theoretical relation across mixing layer.
Where the similarity variable η is σyx and a shift by η0 is defined to account for the transverse displacement of a mixing layer. According to Figure 2, the mean velocity profile along the x axis has negligible amount of variation over FOV length. This observation will be further explained when the growth rate of mixing layer is calculated.
For mixing layers in which one stream is at rest, the spread-rate parameter is typically in the range of 10≤σ0≤12 . For a dual stream mixing layer, the spread-rate parameter is a function of the velocity ratio r=Ub/Ua . To account for this, the Abramovich-Sabin rule was proposed:17
σ0σ=1−r1+r=λ
The spreading rate σ=√π/dδωdx is estimated to be 44.3, and from above relation σ0 is found to be 11.1 which is very close to the nominal value of σ0=11 which was suggested by Birch & Eggers.18 The growth of vorticity thickness is plotted in Figure 3, and the linear growth is evident. The growth rate corresponds to about 5mm growth of layer along the length of FOV, and therefore, the mean statistical variation of any quantity along the length is negligible. The width of FOV and LDA measurement at each longitudinal position is more than 2δω which provides a good coverage of transverse variation of the flow.
Despite the linearity of growth rate, it does not necessarily mean self-similarity. There are cases that linearity of growth rate does not remark the begging of the self–similar region.19,20 Therefore, to recognize self-similar region, measuring other statistical quantities like Reynolds stresses are required. However, as Holmes et al.,21 indicated the self-similarity is matter of conjecture and depends on statistical quantities understudy, and for higher moments of statistical properties, the self-similarity may not be attainable along the experimental configuration. Turbulent Reynolds stresses (Normal and shear stresses) measured at x=80cm are shown in Figure 4. In this plot, the quantities measured by SPIV are averaged over its FOV, since the statistical quantities vary slightly along the FOV. Stress profiles are normalized by the square of velocity difference. According to Mehta22 and Bell & Mehta,23 peak values of the normalized Reynolds stresses are found to lie within the range of:
0.025≤¯uu(ΔU)2≤0.0340.016≤¯νν(ΔU)2≤0.0200.020≤¯ωω(ΔU)2≤0.0220.010≤−¯uν(ΔU)2≤0.013
The comparison of peak values of this experiment as shown in Figure 4 indicates that upper values of the preceding ranges are achieved. The LDA experiments are performed for several streamwise positions located between 500 and 1000mm downstream of the splitter plate, and Normalized normal stress profiles are also shown in Figure 5 for x values of 50, 70, and 90cm. The symmetrical profiles are reasonably coincident, and therefore, it is self-similar. In the middle of a mixing layer the absolute value of gradients and the mean of almost all statistical quantities are maximum, and as one approaches exterior regions the values settle down. Thus, turbulent scales such as the Kolmogorov and Taylor scales vary transversely and are minimum in the middle zone. To estimate the Kolmogorov length scale, an approximate balance between production and dissipation can be made14 and be written as:
2υ(¯sijsij)≃o(−U1,2(¯u1u2))
Based on this balance, the minimum Kolmogorov and Taylor length scales are estimated as 0.06 and 1mm respectively. The smallest resolvable eddy for SPIV measurement is about 40η , which is acceptable in terms of large motion behavior investigation of the mixing layer of this experiment.
A mixing layer is known for spanwise vertical structures that are transported downstream with the mean velocity. In order to address the organization of structures, the concept of coherent structure needs to be clarified. The definition of coherent structure is not well defined and may vary according to authors in the literature.
Both definitions generally point to the same event. Because an organization of concentrated local vorticity not only retains a recognizable form but also impacts phase correlation across the mixing layer as well. SPIVs provide a convenient way to investigate spatial evolution of a flow. The very first step in visualization concerns with a decomposition of the flow field, otherwise the velocity field may not be interpretable. For example in this study, the velocity field is basically stream wise flow with insignificant variation in other directions compared to the magnitude of stream wise velocity component. There are different methods of decomposition which extract different levels of information, and therefore, lead to different interpretations. In Adrian et al.,26 it is indicated that the most appropriate method is determined by the particular investigation. Here, the Galilean, the Reynolds and the POD decomposition are discussed.
Galilean decomposition
Drawing instantaneous streamline in the moving frame with the velocity of vortex core reveals roughly circular or spiral pattern of the vortex. From a typical sample, the mean stream wise velocity Um=(Ua+Ub)/2 is subtracted, and as a result, the vector field may demonstrate associated vortices. The vector plot of a typical snapshot is shown in Figure 6A. The figures portraits a nearly coherent structure affecting whole visible domain reminiscent of well-defined rollers. It is important to note that it is not necessary to remove eddy’s exact translational velocity in order to visualize it. However for this mixing layer, there is a considerable velocity difference of 10(m/s) between upper and lower of the field implying that this is not quite the most appropriate frame to visualize vortices in exterior regions of the mixing layer. Because this difference in velocity covers up any structure at both sides of middle zone completely.
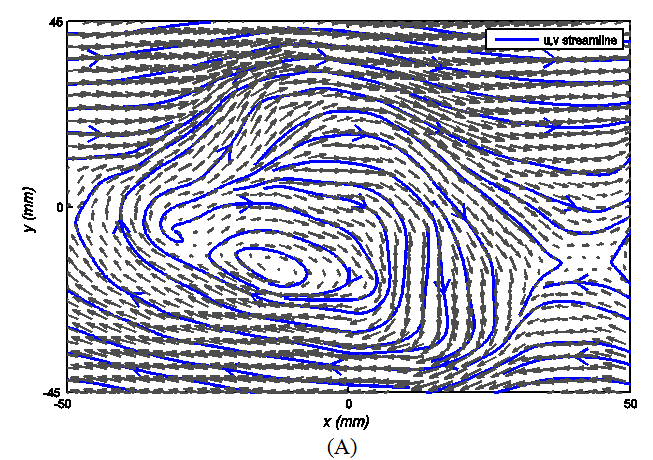
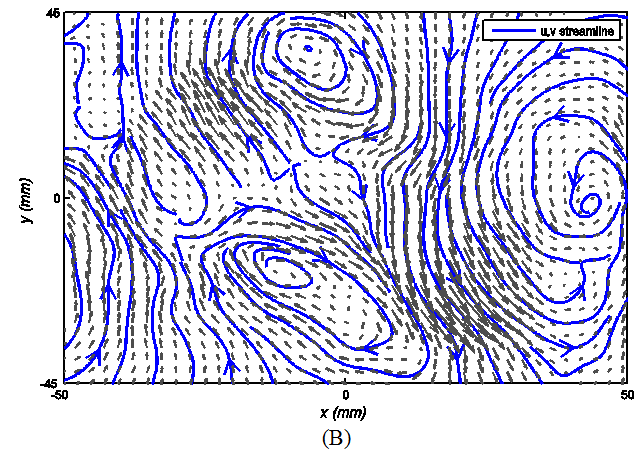
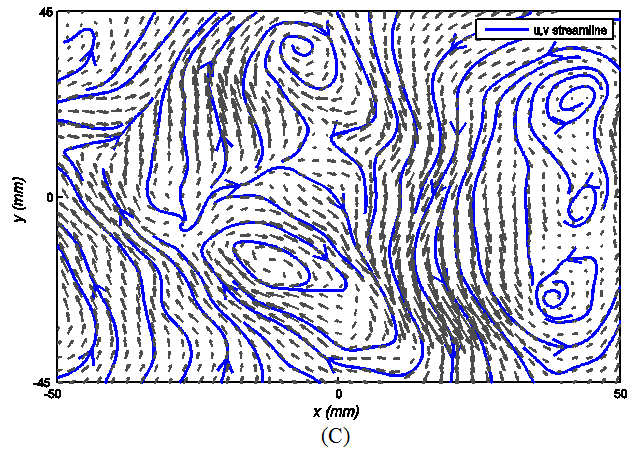
Figure 6 Decomposition of a chosen snaphot obtained from SPIV; (A) Galilean decomposition; (B) Reynolds decomposition; (C) Singular value decomposition.
Reynolds decomposition
The Reynolds decomposition is well-known traditional method to extract mean longitudinal velocity. Subtracting mean velocity from snapshots reveals more from upper and lower regions of the mixing layer as shown in Figure 6B. The instantly recognizable vertical pattern in case of the Galilean decomposition appears now as a group of non-local vortices with different intensities across the mixing layer. It is difficult to establish the concept of a roller for this figure. One of the weaknesses of the Reynolds decomposition is that the decomposition procedure is to subtract the mean velocity, and the mean velocity is associated with the mean behavior of all realizations. Therefore, the procedure is the same even for occasional disparate instances. This point is further explained in the next subsection.
Proper orthogonal decomposition
The POD is another mathematical tool of decomposition which is capable of inhomogeneous filtering of a field. It affords optimal representation of the flow field in terms of empirical eigen functions which are adopted to the nature of a flow. It is optimal in the sense that it extracts the most energetic components in comparison to any other decomposition with the same number of modes. If a flow field is homogeneous or has no directional preference, the empirical eigen functions are Fourier modes. The POD is also known as Principal Component Analysis, the Karhunen–Loéve Decomposition, and the single value decomposition. The discrete version of the POD, which is compatible with the nature of experimental data is the singular value decomposition (SVD) of matrices (Chatterjee 2000). In the field of turbulence, this method is used effectively for obtaining low dimensional description and extracting coherent structures.27,28
Consider an M*N data matrix of A which holds spatial, temporal or spatiotemporal evolution of turbulence velocity field or any other property. The SVD of A is given by:
A=U∑VT
Where U(m×m) and V(n×n) are both orthogonal matrices, the superscript T indicates matrix transpose and ∑(m×n) is a diagonal matrix with ordered arrangement of singular values that is:
σ1≥σ2≥...≥σl≥0 l=min(n,m)
If ukand vk denote kth column of and V, then the SVD can be expressed as:
A=l∑k=1ukσkvk
Since the eigen values are arranged in the order of significance. The first mode (k=1) corresponds to the most energetic mode extractable from matrix A which minimizes the Frobenius norm of the |A-Ak=1| and so on. The key point in applying SVD is how to setup the matrix A. it may include a variety of quantities over time, space or combination of those provided that the rationale behind it is physically relevant. The mean stream wise velocity is two order of magnitude larger than longitudinal and spanwise velocity. The mean stream wise flow is basically too large to let velocity field be visually interpretable. Thus, the matrix A is arranged to consist of stream wise velocities of a single snapshot. After subtracting the first mode from the selected sample, Figure 6C depicts the vector field.
For a snapshot, the first mode of SVD is the energetic mode common to all longitudinal velocities of the snapshot along the SPIV domain. The result of this decomposition closely resembles the result of the Reynolds decomposition. In fact, the first mode is almost analogous to the mean longitudinal velocity profile shown in Figure 2 whereas it is effectively extracted from only one snapshot, and therefore, it is particularly tailored to the flow field on that moment. As already mentioned, the Reynolds decomposition is insensitive to occasional events that out lies the mean behavior. Comparing the streamlines in Figure 6B and Figure 6C demonstrates the subtle differences which may occasionally be significant. The apparent coherent motion in Figure 6A corresponding to the Galilean decomposition does not repeat in either case of the Reynolds (Figure 6B) or the POD decomposition (Figure 6C). The result of the Galilean decomposition is, however, a bit misleading. If there is only one coherent vertical structure in the middle of a mixing layer, then the result of different decomposition is supposed to lead to same pattern at least qualitatively, because all methods subtract almost the same value from the middle zone and the exterior region which the Galilean decomposition is blind to recognize is presupposed not to possess or carry any comparable vertical structures.
The previous section characterizes a typical SPIV snapshot. Under careful visual observation of numerous of those, almost no sign of dominant pattern were identified. In search of any large characteristic pattern of periodic nature, it is important to examine how low frequency fluctuations are distributed across the boundaries of a mixing layer. In general, the Fourier analysis transforms a velocity signal into a summation of sine waves with particular wavelength, amplitudes and phases. The basic functions of a Fourier transform are exactly localized in frequency space but completely delocalized in physical space. This characteristic makes the Fourier transform best suited to analyze stationary signals. However, plane mixing layers have shown statistical dependence on occurrences of vertical structures21 which are, in general, non-stationary and may have variable periodicity and even out-of-phase oscillation in case of natural excitations as noted by Ho & Huerre.3
In contrast to the Fourier case, wavelets resolve the issue by providing a convenient method with some degree of both physical and wave number space. Therefore, a structure or feature localized in the signal space remains localized in the wavelet space, and it is better suited to investigate quasi periodic oscillations intrinsic to the naturally excited plane mixing layer. Among wavelets, the Morlet wavelet is particularly used for mixing layers and well discussed by Dallard & Browand29 and Bonnet et al.30 The Morlet wavelet is a modulated Gaussian function and is composed of a complex exponential multiplied by a Gaussian window. The mother wavelet is defined as:
ψ(t)=(2π)−12exp(i2πf0t)exp(−t2/2)
Where f0 is the central frequency, by translating (t0) and modulating mother wavelet (a), the family of wavelets is generated.
ψ(t,t0,a)=a−12ψ(t−t0a)
In a wavelet transform, a signal is described in terms of a family of wavelets and their associated coefficients corresponding to the particular translation and dilation. The one dimensional continuous Morlet transform of a function u(x) is then defined as:
�u(t0,a)=a−12∞∫−∞u(t)ψ*(t−t0a)dt
where asterisk denotes complex conjugate. The energy associated with a particular wavelet is termed the local energy spectrum.
E(t0,a)=|ˆu|2
higher values of local energy spectrum indicates more contributions of the particular wavelet, and it may be considered as a measure of similarity between the wavelet and the signal at that particular moment.
The footprint of large scale structures can be found in the external parts of a mixing layer.30 Figure 7 presents normalized energy spectra in time-Frequency space associated with the edge of the mixing layer where yδω∼0.5 for both longitudinal and stream wise components of velocity.
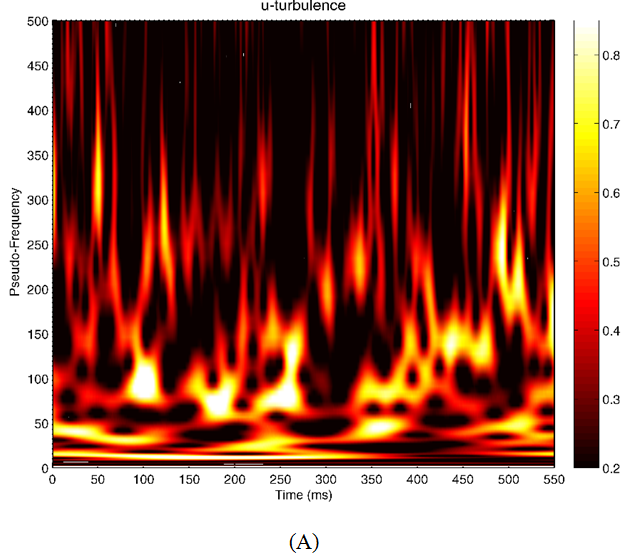

Figure 7 Morlet analysis of velocity components at y/θw=0.5; (A) time- frequency space of u′ fluctuation; (B) time-frequency space of v′ fluctuation.
Significant frequencies of u and v are almost within same band of frequency, i.e. between 50 to 150Hz. With the convective velocity of Um=20m/s, structures with minimum wave numbers larger than 10cm (length of FOV) have frequencies’ footprints of less than 200Hz and therefore, require larger domain of SPIV measurement to be identifiable. Spatial oscillations with wave numbers larger than length of FOV are not observable in a single snapshot. That’s why mere visual investigations do not reveal characteristic variations. In order to ascertain such events, the length of FOV in the SPIV measurement must be at least doubled. This is practically impossible due to resolved scale and technical issues. However, novel method analogues to pseudo flow visualization may be established in order to enable us to study an extended field of flow. The qualitative result of such a method would at least make us certain of the result of spectral analysis and also enables us to observe the nature of such events.
The Pseudo flow visualization is mainly associated with a hot wire anemometry where by gathering raw velocity signals and employing Taylor’s hypothesis, a record of contiguous measurements in time results in reconstruction of large organization of a flow which is much larger than the genuine region under direct measurement. This big picture assembled by integrating contiguous realizations may roughly demonstrate general structures.30 In case of SPIVs, if capturing larger structures as compared to the size FOV is planned, there are basically two methods:
Regarding the high velocity of the mean flow, it is not possible to establish a temporal relation between consecutive snapshots. During the time lap of two snapshots, i.e. order of 0.1 (s), the flow has been convected downstream a few meters, and therefore, the next snapshot has almost no relation with the prior one. It was already mentioned that doubling the length of FOV is not practical due to technical issues. In order to overcome these shortcomings, a new method is proposed. The SPIV technique provides space evolution of a flow in the domain of FOV at a fixed location, and measurements are made for the same setup configuration and same initial conditions. Accordingly, although there are no two consecutive snapshots related and neither snapshots is entirely coincident in details, there should be matching large behavior among the entire set of snapshots. It is fundamentally similar to a puzzle game requiring one to find and put pieces together. The logic behind how to arrive at the correct solution is a little tricky. If the most probable snapshots are arranged in a consecutive order, then space-evolution history of a larger domain can be estimated, and structures with larger wave-number can be studied. The schematic shown in Figure 8 demonstrates how to find the most probable snapshot that follows a chosen snapshot (Sn). Each snapshot (S) is subdivided into ten vertical strips of 1cm width, which is comparable to the integral scale of flow.
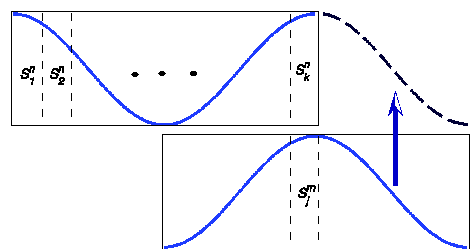
Figure 8 Schematic diagram of the procedure of dividing snapshots into strips and finding the probable continuation of the prior snapshot.
In this arrangement, the continuation of the snapshot Sn is defined as the remainder of another snapshot whose beginning constituent subsection Smj closely resembles the end of the prior snapshot Snk=10 . The subsection bears close resemblance when the Frobenius norm of |snk=10−smj≤5| is minimized among the first half sections of all snapshots. It is obvious that Sm can be any snapshot except Sn , and a recursive pattern is not allowed. This way a series of snapshots can create a pseudo extended flow. As Bonnet et al.,30 suggested the large flow organization can be characterized by the wz component of vorticity. Figure 9 shows vorticity content of pseudo extended fields of three typical snapshots. Figure 9A is an instance for which there is no indication of particular ordering of vorticity contours. However, Figure 9B & Figure 9C are typical instances of noticeable ordering which is not recognizable in the original domain of FOV. These non-regular temporary oscillations with wave numbers larger than the length of FOV are probably related to the quasi periodicities represented by the Morlet analysis. It is demonstrating the tendency but inability of flow to create periodic coherent structures because of initial turbulent intensities and natural excitations.
In this paper, free-stream turbulence is introduced to the entire low-velocity side by means of a honeycomb, and structures of the mixing layer are visualized and studied in the self-similar region. The mixing layer with turbulent initial conditions shows no dominant regular oscillations. The vertical patterns of snapshots do not indicate dominant coherency. This signifies that the persistence and strength of vertical structures are drastically reduced as also reported by Chandrsuda et al.10 However, the flow visualization in pseudo extended domain illustrates temporary oscillating layouts of scattered vorticity. This phenomenon manifests itself in quasi periodic behavior of the system with considerable amplitudes in frequency range of 50 to 150Hz obtained from the Morlet analysis.
This observation in the self-similar region is explained by the fact that details of the flow downstream of splitter plate trailing edge still affect this region, but irregular contributions may not show itself in statistical description required to define self-similarity. As a result, the self-preservation which asserts that under appropriate scaling, statistics of the flow is stationary is under question as also indicated by Bell & Mehta23 and Chandrsuda et al.10 Nonetheless, the self-similarity may exist since conventional mathematical tools such as Reynolds averaging and Fourier analysis are mainly concerned with overall behavior of realizations and entire physical space respectively and are statistically inappropriate to investigate this nature.31 This finding is of practical importance because the existence of temporary large ordering of irregular scattered vorticity and its dependence on initial boundary conditions beyond the hypothetical self-similar region introduce new methods of studying, controlling and enhancing mixing.32,33
Finally, the method proposed to extend the domain of observations is of interest. In spite of the fact that the larger the domain of FOV, the better, there exist restrictions on increasing size of FOV due to resolved scale and technical factors. However, this method can extend a field so as to realize larger wave numbers and is of practical significance in flow visualization.
Authors declare that there is no conflicts of interest.

©2019 Najafinia, et al. This is an open access article distributed under the terms of the, which permits unrestricted use, distribution, and build upon your work non-commercially.