eISSN: 2576-4500


Research Article Volume 6 Issue 4
1Astronomical Observatory of the I.I. Mechnikov Odesa National University, Ukraine
2Laboratory of Space Researches, Uzhgorod National University, Ukraine
3National Space Facilities Control and Testing Centre, Ukraine
Correspondence: Peter P Sukhov, Astronomical Observatory of the I.I. Mechnikov, Odesa National University, 1B Marazlyivska St, Odesa city, Ukraine
Received: October 07, 2022 | Published: October 24, 2022
Citation: PP, Yepishev VP, Sukhov KP. Ascertainment degradation of satellite surface optical characteristics by photometric data. Aeron Aero Open Access J. 2022;6(4):171-175. DOI: 10.15406/aaoaj.2022.06.00158
The aim of the work is to check the possibility of detecting degradation of the surface of a geostationary satellite according to B, V, R photometry during a long stay of the satellite in space. The change in reflective characteristics in three filters of four geostationary satellites with different platforms over a time interval of 3-9 years is studied. These are geostationary satellites with Eurostar E3000, SSL-1300, Spacebus-4000B2 and Express-2000 buses. It is revealed that the nature of the change in the reflectivity of different geostationary satellites is not the same. Spacecraft materials used for the surfaces of geostationary satellites built in the second decade of the 21st century are more resistant to the rigors of space than those used for satellites built in the late 20th century. The presented results show that the photometric method works and can be used to detect surface degradation of spacecraft.
Keywords: satellite bus, reflectance index, multicolour photometry, degradation
One of the topical issues related to the development of durable thermal-control coatings for the spacecraft (SC) surface is exposure to solar radiation that includes electromagnetic radiation and charged particle fluxes. There are of other factors which also affect the satellite remaining in the space environment for a long time. These include high vacuum, zero gravity, space or meteoric dust, orbital man-made debris, solar flares, the current state of the near-Earth ionising radiation and thermal shocks which the satellite experiences when entering and exiting the Earth’s shadow. Degradation of material in space changes mechanical, optical, spectral, electric and physical properties of coating materials used for the spacecraft hardware and also destroys fasteners used to mount solar panels (SP) and payload (PL) into the satellite bus. It results in breakdowns and failures that reduce the operational lifetime of the SC in orbit. An important problem associated with the creation of durable thermal control coatings on the surface of spacecraft (SC) is the effect of solar radiation, including electromagnetic radiation and charged particle fluxes. There are other factors that affect the surface of a satellite in the space environment. These are vacuum, weightlessness, meteor dust, orbital space debris, solar flares, the current state of near-Earth ionizing radiation, and thermal shocks that a satellite experiences when entering and exiting the Earth's shadow. Material degradation in space changes the mechanical, optical, spectral, electrical and physical properties of spacecraft coating materials, destroys the fastening of solar panels (SP) and external payload (PL) on board the satellite. This leads to breakdowns and failures, which reduce the service life of the spacecraft in orbit.
Studying and recording the interaction of different materials of the satellite surface with the near-satellite orbital environment has been mainly conducted experimentally under laboratory conditions or through simulation. However, simulations and laboratory experiments, despite their high cost, do not fully reflect actual space environmental effects on the SC surface. Such studies cannot factor in either a) the total effect of exposure to all space environmental factors on the geostationary satellite (GSS) surface; or b) ever-changing effects of the Earth’s atmosphere on the light falling onto or reflected off the satellite surface. Such “Relative complexity and high cost of tests in situ do not allow us to reckon them as a reliable tool for thorough investigation of the effects of the near-satellite environmental factors”.1
More detailed information about changes in the reflectance properties of SC can be obtained from the analysis of colourimetric observations in particular spectral bands, as well as from the analysis of the reflectance spectrum produced from the SC materials. The proposed method for studying the space environmental effects on the reflectance properties of the satellite surface materials is based on the analysis of ground-based multicolour photometric observations of the sunlight reflected off the satellite using known astrophysical methods. Although the method suggested here requires long-term studying GSS, in the authors’ opinion, the results obtained will significantly improve our knowledge about the true state of the SC surface after its being in operation in space for a long time.
The only publication known to the authors is the study by A. Didenko,2 which presents the results of changes in the reflective properties of GSS over time in several optical wavelength ranges during observations from the Earth's surface through the atmosphere. In the above-referred study, three GSS were observed, namely those of the series Gorizont, Raduga and Intelsat, launched into orbit at the end of the 20th century and at the beginning of the 21st century over a time span of 4.5 years. A. Didenko2 suggested examining the reflectance characteristics of GSS through changes in relative reflectance indices, and , with time of the GSS operation in orbit. He made the following conclusions: a) the greatest changes in the reflectance properties of the SC surface occur during the first three years after launch; b) the pattern of change in is dissimilar for different satellites. The computation of the relative reflectance index , and spectral reflectance index , as a fraction of incident solar radiation reflected from the SC surface was performed using a well-known formula for calculating the SC brightness2
Where does it follow that
where is the Sun's brightness (apparent magnitude) in the studied spectral band; S - is the apparent effective area of the SC surface illuminated by the Sun (estimated from the results of observations or adopted from the information sources); is the spectral reflectance index in the B,V,R bands; is the phase function; d is the topocentric distance to the SC specified from the positional observations.
Publications by О. Murtazov et al.,3 H. Cowardinet al.,4 and G.A.MсCue et al.,5 show high relevance of this line of research, as well as promising prospects for such studies, and present experimentally obtained B-V and V-R colour indices for some materials used in manufacturing surface hardware components of low-Earth-orbit SC. However, according to these data, it is quite difficult to determine the individual contribution from the SP and the satellite bus with external PL to the overall reflectance in a given spectral band. In the studies by V. Yepishev et al.,6,7 the effectiveness of extending spectral bands in such observations was demonstrated using the results of observations of three GSS. Five colour filters, namely U, B, V, R, I, were employed in the experiment. An analysis of the obtained results showed that for the observed objects some characteristic features manifested themselves in the ultraviolet region, but not in other spectral regions. Besides, it was partly figured out which materials had been used in manufacturing particular surface hardware components of modern GSS. As can be deduced from the afore-mentioned publications, in order to conduct more thorough research, it would be desirable to know spectral reflectance indices , at the time of observations or the tendency for these indices to change.
In the latter case, it becomes possible to estimate degradation of the SC surface materials to a certain extent and to identify new spacecraft materials which have been developed to replace the outdated ones.
This paper presents the results of studying only four GSS with known satellite buses, namely Eurostar E3000 (manufactured by EADS Astrium), Spacebus-4000B2 (by Thales Alenia Space), SSL-1300 (by Space Systems/Loral) and Ekspress-2000 (by ISS named M. Reshetnev). The reflectance properties were monitored from the start of the GSS operation at the sub-satellite point through the year 2021. The duration of observations varied from 3 to 9 years. The GSS under study were launched in the second decade of the 21st century. This study has been aimed at checking whether it is possible to detect the SC surface degradation from multicolour photometric observations using known astrophysical algorithms for the information processing.
The observations were carried out using a 20-inch telescope based on the Cassegrain optical system. A high-speed photomultiplier FEU-79 was employed in the pulse counting mode. We used B, V, R colour filters with pass bands pretty close to the Johnson-Cousins broadband photometric system shown in Figure 1. All GSS presented in Table 1 are three-axes stabilised objects deployed close to the observer’s meridian of longitude; they did not change their positions throughout the observation period. The types of satellite buses (platforms) and dimensions of GSS were taken from electronic resources, such as Gunter Space Page8 and Wikipedia9 and also from the web-site of ICC M. Reshetnev.10
GSS name and year of observation |
The satellite bus type |
Application |
Contractor |
Astra 2E 2013-2021 |
Eurostar E3000 |
Communication |
EADS Astrium (Europe) |
Sicral 2 2015-2021 |
Spacebus-4000B2 |
Military communication |
Thales Alenia Space ( Franco-Italian) |
Azerspace-2 2019-2021 |
SSL-1300 |
Communication |
Space Systems/Loral (USA) |
Blagovest 11L 2017-2021 |
Ekspress-2000 |
Military communication |
ISS Reshetnev (Russia) |
Table 1 The GSS under study
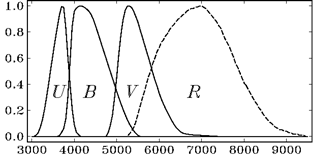
Figure 1 Schematic pass bands of the Johnson-Cousins multicolour system: the X axis represents the wavelength; the Y axis shows the spectral response of the photometric system expressed in relative units.
In Table 1 in the first column: – GSS name, length of observation time in years. The second column – the type of satellite bus this GSS. The third column is the functional purpose of this GSS. The fourth column is the contractor of this satellite. Silicon was the most common element used in photovoltaic cells in SP for a long time. In the 21st century, new photovoltaic cells based on compound semiconductor materials, such as gallium arsenide (GaAs), indium gallium phosphide (InGaP), indium gallium arsenide (InGaAs), etc. appeared. The main function of SP is to absorb and convert solar radiation into electrical energy. This is why the reflectivity of modern SP is rather low. However, due to the fact that the SC solar arrays are quite large in area (covering up to several hundreds of square metres and beyond), sunlight reflection off the SP is observed predominantly in the B filter. The reflectivity of the satellite bus, which consists of a service module with all subsystems and a payload module, is very high. It is required for thermal control and normal operation of the onboard radio electronic equipment. The external payloads in the buses of many communication satellites, including feed arrays of radio antennas, are covered in a thin film of yellowish or, in some cases, gold colour, which has a high spectral reflectance index ( ). In the V and R filters, one can observe the sunlight reflected off the satellite bus of a specific shape, such as cylinder, cone, cube, rectangular prism, etc., as well as off the external payload, including a service module and radio antennas of different shapes. Some portion of the reflected light observed in these filters is contributed from the SP based on GaAs, InGaP and other compound semiconductor materials.
In all the figures presented here below for each of the studied GSS the following data are depicted: changes in the averaged relative reflectance indices, and , with time of the satellite staying in orbit and also changes in spectral reflectance indices . In all the figures, the values and correspond to the observed spectral region in the Johnson-Cousins system, which is 3000Å-5500Å and 5500Å-8200Å, respectively. The Y axis represents the values of relative reflectance indices, and (Figure 2), the X axis shows the duration of the GSS staying in orbit in years.
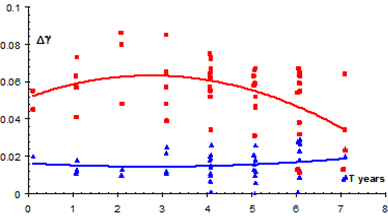
Figure 2 Astra 2E on the Eurostar E3000 bus.
Changes in relative reflectance indices Δγ(B-V) - (blue colour) and Δγ(V-R) - (red colour), of the GSS Astra 2E observed during 2013-2021.
The Eurostar E3000 satellite bus has been manufactured since 2004.As can be seen from the above-illustrated results for the Eurostar E3000 bus, the greatest changes in are observed during the first 3 years after launch, when the averaged relative reflectance index, , is increasing from 0.050 to 0.065. Later on, this value is decreasing. For this satellite bus, the values have barely changed over 7 years of observations, varying within the range 0.018-0.020. Figure 3 shows changes in spectral reflectance indices , of the GSS Astra 2E over the same time span of observations. As is seen from the plots, spacecraft materials which reflect light in the range from blue to yellow colours (at 3500Å-5500Å) are more susceptible to the deleterious effects of the space environment. Spacecraft materials reflecting red and near infrared colours (at 5500Å-8200Å) are less prone to change their reflectance properties.
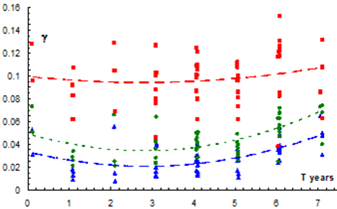
Figure 3 Astra 2E on the Eurostar E3000 bus.
Changes in spectral reflectance indices, γB - (blue colour), γV -(green), γR - (red), of the GSS Astra 2E observed during 2013-2021.
Similar results of the studies obtained for the GSS Sicral-2 are illustrated in Figures 4&5. The Spacebus-400B2 satellite bus has been produced since 1985. Over the first 3 years after launch, the relative reflectance index, , has decreased from 0.092 to 0.042; later on, this value starts increasing. As regards the relative reflectance index, , one can only observe a decrease from 0.038 to 0.09. A pattern of change in all three spectral reflectance indices, just like in relative reflectance indices, for this satellite bus is practically similar (Figure 5). These indices are decreasing over the first 3 year after launch, and then they all are increasing. The shape of the reflectance curves shown in Figures 4&5 appears to be illogical!
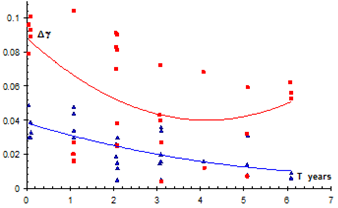
Figure 4 Sicral-2 on the Spacebus-4000B2.
Changes in relative reflectance indices, Δγ(B-V) - (blue colour), Δγ(V-R)) - (red), of the GSS Sicral-2 observed during 2015-2021.
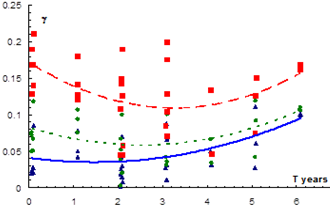
Figure 5 Sicral-2 on the Spacebus-4000B2.
Changes in spectral reflectance indices,γB (blue colour), γV - (green), γR - (red ), of the GSS Sicral 2 observed during 2015-2021.
The Express-2000 satellite bus employed in the GSS Blagovest 11L has been manufactured since 2014. As is seen from the data depicted in Figures 6, there is a minor increase in the averaged relative reflectance indices. Over the first 1.5-2 years of the GSS staying in orbit, the index has changed from 0.015 to 0.022, while has varied within 0.037-0.048. Spectral reflectance indices were increasing during the first 1.5-2 years, later on their growth rates slowed down (Figures 7).
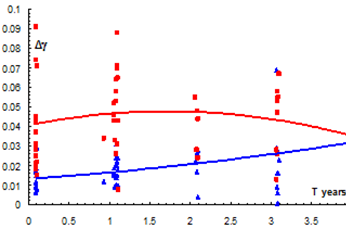
Figure 6 Blagovest 11L on the Ekspress-2000.
Changes in relative reflectance indices, Δγ(B-V) - (blue colour), Δγ(V-R)) - (red colour), of the GSS Blagovest 11L observed 2017-2021.
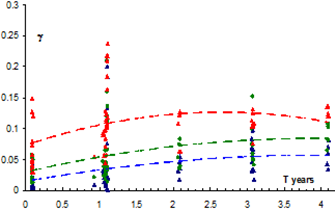
Figure 7 Blagovest 11L on the Ekspress-2000.
Changes in spectral reflectance indices, γB - (blue colour), γV - (green), γR - (red), of the GSS Blagovest 11L observed 2017-2021.
The satellite bus SSL-1300 (Structure, Composite & Al honeycomb), used in the GSS Azerspace-2, has been produced since 1989. Minor changes in and can be traced during the first year of operation, when the averaged relative reflectance index is increasing from 0.01 to 0.025 while is increasing from 0.033 to 0.045. (Figures 8)
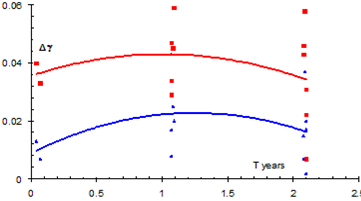
Figure 8 Azerspace-2 on the SSL-1300 bus.
Changes in relative reflectance indices Δγ(B-V) - (blue colour), Δγ(V-R)) - (red), of the GSS Azerspace-2 observed 2019-2021.
Likewise in Figure 9, the curves for only show minor changes during the first year in operation; this may indicate that the SSL-1300 satellite bus is more resistant to the space environmental effects. However, it is possible that the period of observations is not long enough to make such a conclusion.
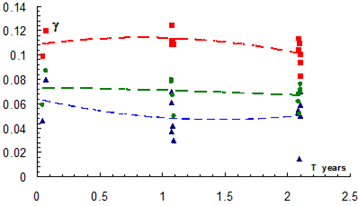
Figure 9 Azerspace-2 on the SSL-1300 bus.
Changes in spectral reflectance indices, γB - (blue colour), γV - (green), γR - (red), of the GSS Azerspace-2 observed 2019-2021.
Here, each cell in the Z column presents the range of changes in (the upper line) and (the bottom line). The Difference column shows the difference between the maximum and minimum and values, respectively. The first and second columns are similar to Table 1. The data given in the Difference column of Table 2 enable us to predict the extent of degradation of the surfaces of the four studied satellite buses.
GSS name, year observation |
Bus type |
Z* Δg(B-V), |
Difference |
Astra 2E, 2013-2021 EADS Astrium, (Europe) |
Eurostar-3000 |
0.018 - 0.020 |
0.02 |
0.050 - 0.065 |
0.015 |
||
Sicral 2, 2015-2021 Thales Alenia Space, (Franco-Italian) |
Spacebus-4000B2 |
0.038 - 0.02 |
-0.018 |
0.092 - 0.042 |
-0.05 |
||
Blagovest 11L, 2017-2021 ISS Reshetnev, (Russia) |
Ekspress-2000 |
0.015 - 0.023 |
0.08 |
0,038 - 0,047 |
0.09 |
||
Azerspace-2, 2019-2021 Space Systems/Loral, (USA) |
SSL-1300 |
0.01 - 0.025 |
0.015 |
0.033 - 0.045 |
0.012 |
Table 2 The average range of the Δγ(B-V) and Δγ(V-R) values for the satellite buses over the first 3 years after GSS launch*
The results presented in this paper show that the photometric method can be used to monitor and estimate the true degradation in optical properties of the SC surface with time of its stay in space.
It has been confirmed that a pattern of changes in the reflectivity of different GSS is dissimilar. It means that the leading manufacturers have been using different coating materials for the spacecraft SP and buses, which, in its turn, enables us to estimate the quality of these materials, as well as scientific and technological advances and innovations applied.
Spectral reflectance properties of the spacecraft materials used for the surfaces of GSS manufactured in the second decade of the 21st century make them more resistant to the harsh space environment as compared to those used for the GSS built in the late 20th century. It results from the technological progress. New materials are more resistant to the aggressive effects of the space environment. On average, the reflectance properties of the studied GSS are similar; however, the GSS on the European satellite bus Eurostar E3000 (Astra 2E manufactured by EADS Astrium) and US satellite bus SSL-1300 (Azerspace-2/Intelsat 38 built by Space Systems/Loral) have some advantages. It has been established that the spectral reflectance index is more prone to change while the spectral reflectance index changes just slightly, as expected. A photometric method is cheaper than laboratory experiments; it reflects more precisely the effects of the space environment on the satellite surface materials as enables to record the total effect of exposure to all existing near-Earth space environmental factors affecting the satellite surface.
The study and analysis of the photometric characteristics of the satellite, their change in time is useful and necessary for the Space Situational Awareness (SSA) program. Successful estimating the extent of degradation of the SC surface material using a photometric method requires conducting routine long-term observations of GSS in narrowband filters, if feasible, with bandwidth less than 300Å. In the future, the proposed method can be further refined and improved.
None.
The Authors declares that there is no Conflict of interest.

©2022 PP,, et al. This is an open access article distributed under the terms of the, which permits unrestricted use, distribution, and build upon your work non-commercially.