eISSN: 2576-4500


Research Article Volume 5 Issue 1
1Department of Electrical and Computer Engineering, Indiana University-Purdue University Indianapolis, USA
2Department of Mechanical and Energy Engineering, Indiana University-Purdue University Indianapolis, USA
Correspondence: Peter J Schubert, Department of Electrical and Computer Engineering, Indiana University-Purdue University Indianapolis, Indianapolis, Indiana, USA
Received: May 08, 2021 | Published: May 18, 2021
Citation: Schubert PJ, Kindomba E, Hantzis C, et al. Actinide concentration from lunar regolith via hydrocyclone density separation. Aeron Aero Open Access J. 2021;5(1):38-45. DOI: 10.15406/aaoaj.2021.05.00126
Beneficiation of regolith to concentrate the high-density ore fraction from the gangue can be accomplished through momentum transfer methods, such as ballistic deflection or cyclonic separation.This study explores the extraction of actinide-bearing minerals from lunar regolith based on the difference in apparent density between thorium-bearing minerals (e.g. ThO2ρ=10) from silicates (e.g. SiO2ρ=2.65).Thorium content in lunar regolith ranges from single-digit parts per million (ppm) to as high as 60 ppm.Concentrating thorium-bearing minerals is a required first step in the preparation of fission fuels for a nuclear reactor in which all of the radioactive operations are performed 380,000 km from the Earth’s biosphere. After comparison with ballistic deflection, cyclone separation with a non-volatile fluid carrier was chosen for further study.With sieving to separate particles by size, such a hydrocyclone can be used to efficiently separate the dense fraction from the lighter minerals.Design equations were used to fabricate an at-scale apparatus using water, iron particles, and glass beads as simulants.Results show the ability to effect a 2 to 5.4 % increase in dense fraction concentration each pass, such that 95% concentration requires between 50 and 100 passes, or a cascade of this many apparatuses.The selection of a suitable fluid for safe and low-mass transport to the Moon is part of a techno-economic analysis of the cost and infrastructure needed to produce highly-purified thorium minerals on the lunar surface.
Keywords:thorium, sorting, beneficiation, ISRU, Moon, fission
Beneficiation of regolith is more challenging in space than on earth because rich ore bodies are rare.The local environment on, for example, Earth’s Moon, is further challenged by the low gravity, lack of water and air, and the mobility, radiation, and temperature extremes faced by either a human or a robotic operator.In-situ resource utilization (ISRU) is the general term for extracting and using materials and energy already found in space.An important aspiration for ISRU activities is the ability to produce abundant baseload electricity.The ideal lunar power source is a nuclear fission reactor.However, because of terrestrial concerns over risk, the launching of radioactive material is controversial.An alternative exists.
Thorium on the surface of the Moon offers a powerful source of nuclear energy and is found in abundant concentrations across wide expanses of the lunar near-side and south pole. On the lunar surface, thorium is naturally occurring as thorium dioxide (ThO2) that needs to be processed, sorted, and separated from lunar regolith and refined into uranium-233 which is a fissile byproduct useful as nuclear fuel.
The present study was carried out to determine the viability of cyclone separators (centrifugal classifiers) in successfully separating, sorting, and concentrating extracted actinide-bearing minerals from lunar regolith based on the difference in apparent density. Particularly, this study focused on the use of hydrocyclones to classify particles of different densities. The effects of variables such as input mass ratio of dense particles and cyclone axis angle were investigated. Steel (7.5g/cc) and glass beads (2.4g/cc) were used to simulate high and low-density particles respectively. The separation products of the experiments with the most promising results were analyzed and then compared in terms of increase in high-density ore concentration. Lastly, due to wide variations in operating conditions on the moon, a suitable liquid is needed as the working fluid.While water is in this study for demonstration, other suitable fluids, proposed for safe and low-mass transport, are recommended for use of the moon.
Hydrocyclones are continuously operating centrifugal classifiers that use differences in drag and inertial forces to separate particles based on size, shape, and density. A hydrocyclone works by creating a vortex of water mixed with solids within a cylindrical vessel that tapers into a cone. The vortex causes centrifugal effects on the solids, inducing the heavier ones to disengage from the flow and remain along the interior walls, while light particles migrate towards the center of the vortex due to drag forces. Simultaneously, the taper of the cone causes the vortex to reverse direction, allowing most of the liquid to exit from a top port called the vortex finder, carrying with it the lighter particles. Figure 1 below illustrates the flow in a hydrocyclone.1
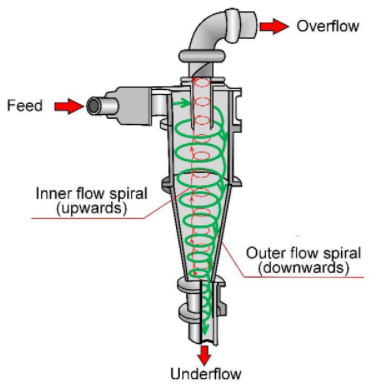
Figure 1 Visualization of a hydrocyclone.13
Cyclones in general offer the benefits of a continuous flow, separation of similarly sized particles by density and take a small footprint compared to other sorting devices such as gravity sorters.
Additionally, hydrocyclones can operate under lunar gravity. In fact, Bradley3 explains that “the cyclone is a piece of equipment which utilizes fluid pressure energy to create rotational fluid motion.” Gravity has a negligible effect on hydrocyclone performance. It is primarily by viscosity, drag forces and inertial effects or centrifugal forces that the separation effects occur. It is only for cyclones of large diameters and operating at low pressure that “the position of their axis,” hence gravity, matters.3
While there is an extensive amount of computational fluid dynamics studies, few analytical studies have investigated density separation in a hydrocyclone.4 Cyclone modeling is a complex undertaking. As indicated by Sovechles,1 empirical models for hydrocyclones “are not based on any specific theory of hydrocyclone operation and are derived by fitting models to experimental data.” Despite this lack of defining theories, key governing equations for fluid motion and particles interactions are the mass (1) and momentum (2) balance equations:
(1)
(2)
The main forces on particles include the centrifugal force due to the tangential motion, the centripetal buoyancy force due to the radial pressure gradient, and the centripetal drag force due to the viscosity of the liquid. They are governed by the Navier-Stokes equation, with components defined, respectively, as:5
(3)
Further mathematical models on particle-fluid interactions can be found elsewhere.6 Relevant models in software packages such as ANSYS include the Large Eddy Simulation (LES) to model the hydrocyclone turbulence, Discrete Phase Model (DPM) to predict particle separation, the Reynolds Stress Model (RSM) to predict the velocity and pressure distribution.5
Design process
The key design requirements for the prototype experimental density sorting device included the following considerations:
Density separation: To separate high-density particles from low-density ores with minimal noise from particle sizing effects. A target for less than 200 cycles to 99% purity was set for the sorter.
Semi-continuous process: To maximize the duration the process can run with minimal human interaction.
Visible operation: Clear materials and observable process. The opacity of slurries or cyclone materials can prevent proper assessment of the flow.
Iterable and adaptable: Flexible geometrical & operation changes
Empirical performance charts are typically used as design standards for hydrocyclones. Cyclones are generally classified by their diameters. It is an industry standard for manufacturers to produce a finite range of hydrocyclone designs with progressive diameters.These are characterized by empirical charts on separation versus flow rate for a given hydrocyclone design, with various “aperture sizes (inlet, overflow and underflow) through the use of interchangeable parts” for various cyclone operations.1From knowledge of standard diameters, capacities, pressure drops, and cut sizes, various cyclones can be designed to suit a wide range of operations.
Bradley3 adapted performance data for a Heyl and Patterson hydrocyclone, a widely used type of hydrocyclone, as seen in Table 1 below.
|
Diameter (mm) |
Capacity (m3s-1) |
Pressure Drop (kPa) |
Cut size (μm) |
|
28 |
0.2-0.4 |
276-414 |
2-10 |
|
76 |
1-3 |
138-276 |
5-20 |
|
203 |
11-45 |
138-207 |
20-80 |
|
356 |
34-159 |
103-172 |
80-300 |
|
610 |
159-454 |
69-138 |
150-500 |
|
914 |
454-908 |
28-83 |
200-600 |
Table 1 Heyl and Patterson hydrocyclone performance standards
Separation mechanism apparatus
A density separator setup was constructed for this study as depicted in Figure 4, consisting of a model CV06 mini cyclone separator (Figure 2-an air cyclone separator that was retrofitted into a hydrocyclone through the application of water-resistant sealants and a gasket), a water drum (liquid reservoir), an autotransformer (to adjust power to the pumps), a centrifugalpump (the primary pump for pumping liquid into the hydrocyclone from the reservoir), a diaphragm pump (sump pump responsible for returning spent fluids to the reservoir), two collection buckets (one overflow collection bucket and one underflow collection bucket) and a feed insert tube. Quick-Grip® clamps were used as gates to control the flow connection between the feed tube and the hydrocyclone. A custom-made table was designed to house the setup. The circuit was operated at a fixed flow rate of 1.24 l/s (1177 GPH).
Materials
Round glass beads having diameters of 0.25-0.4mm (2.4g/cc) were used to simulate the bulk of lunar regolith, and stainless steel balls of 0.25-0.4mm diameter (7.5g/cc) were used to simulate actinide minerals, and the working fluid was water. This relatively narrow size range provides greater clarity on density sorting relative to size sorting.

Figure 3 Fluid and material flow diagram showing a funnel shape hopper instead of the slurry bulb and clamp used herein.
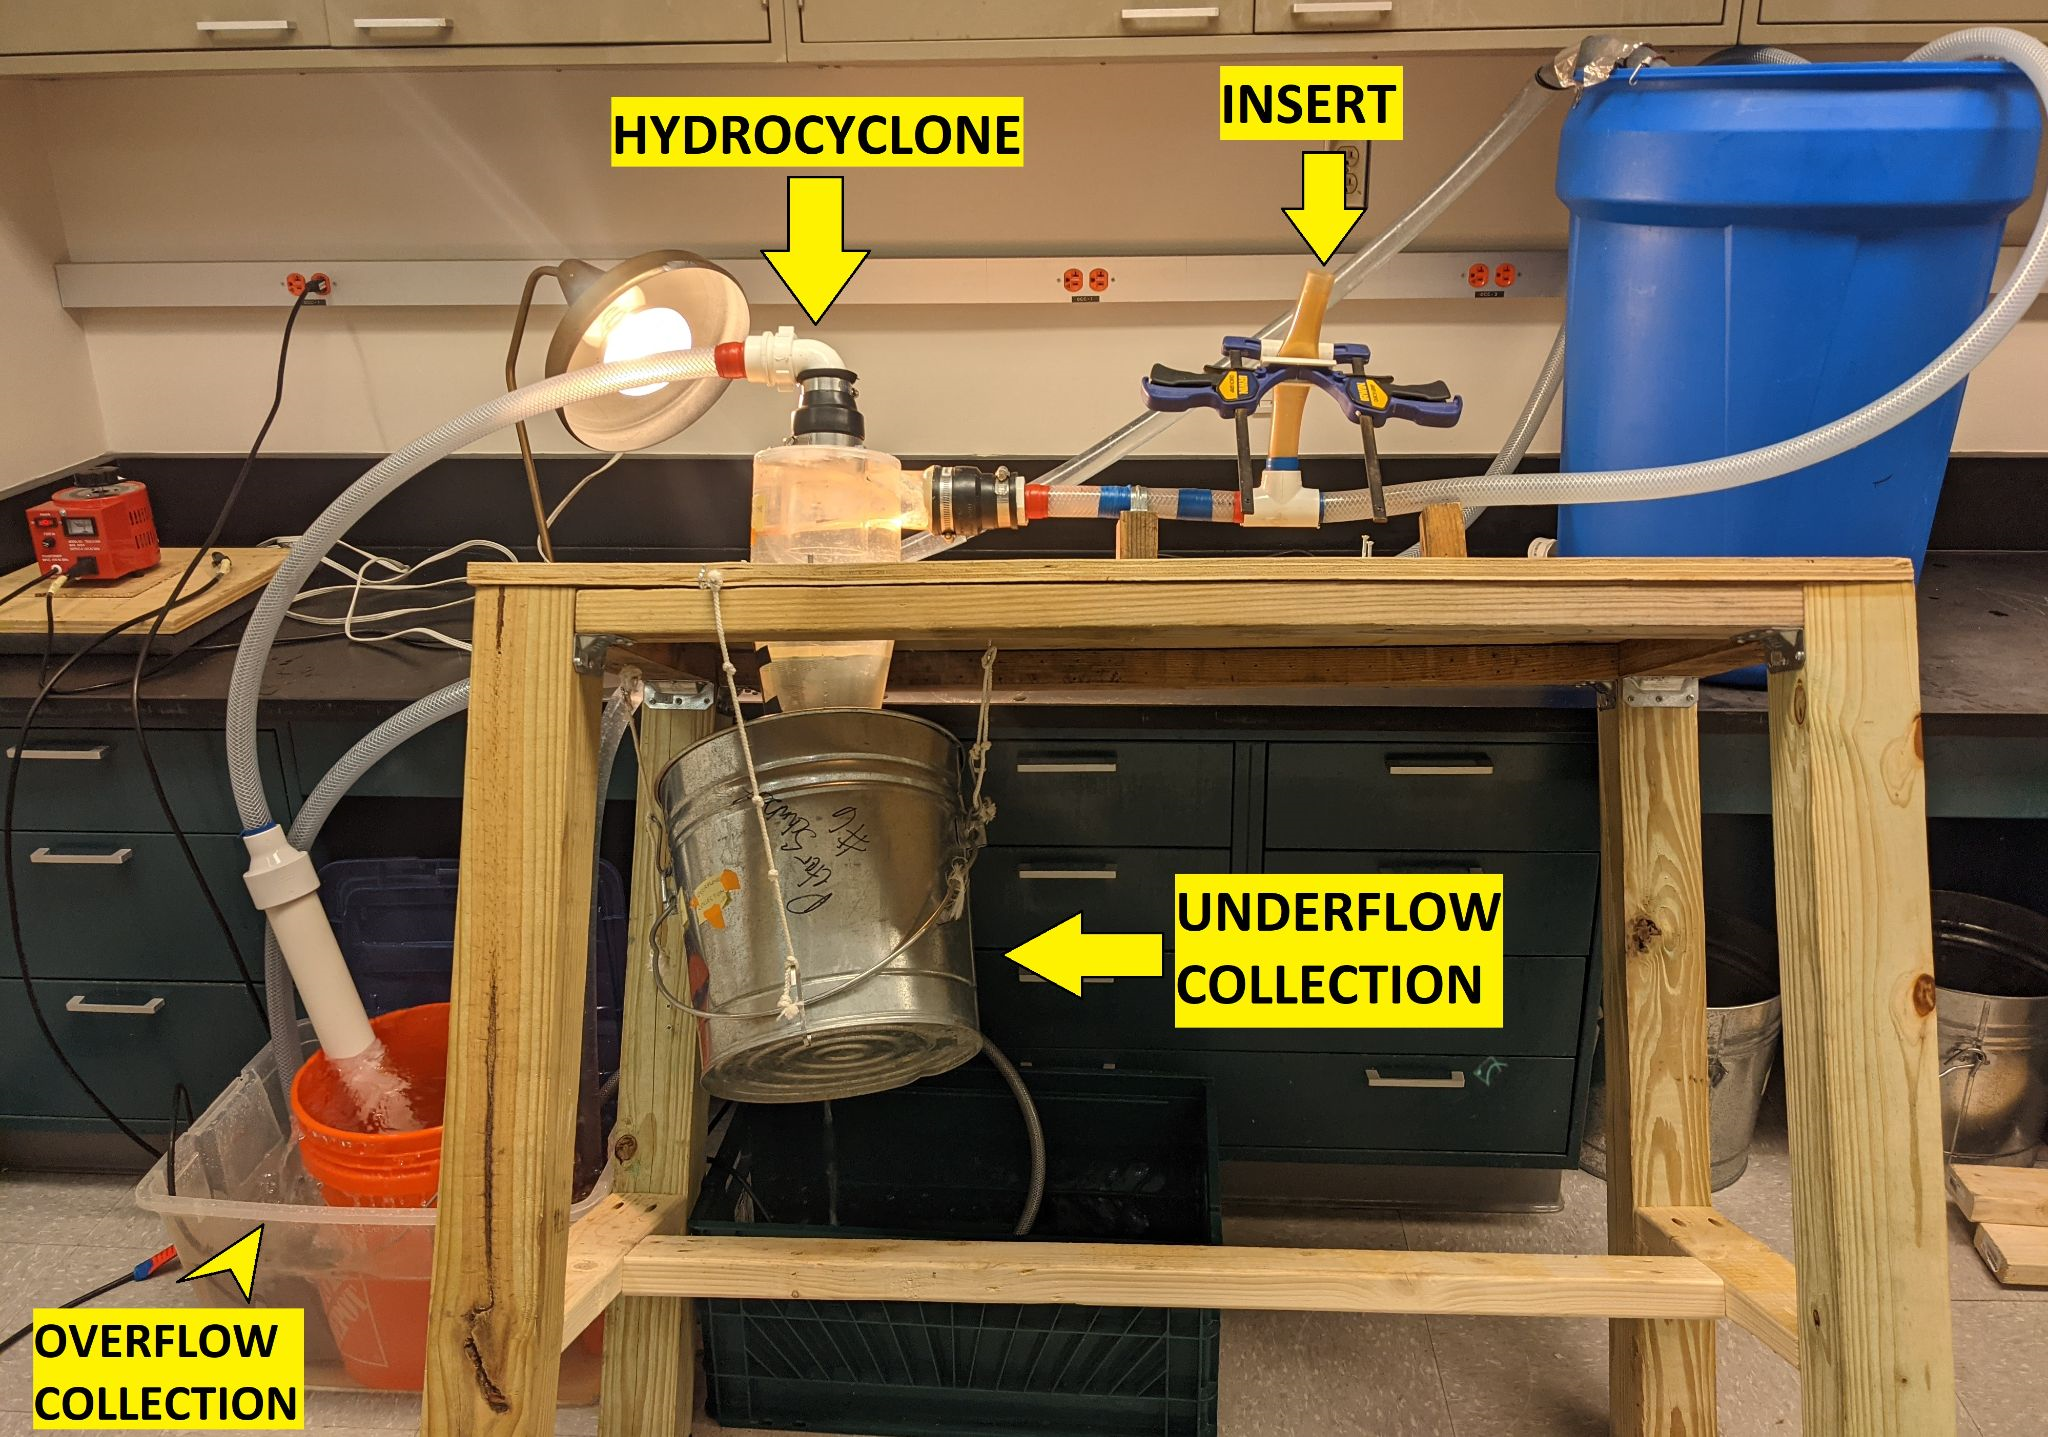
Figure 4 Experimental apparatus in tilted configuration, taken from 1.7 meters elevation (slurry bulb not shown at ‘INSERT’ point).
Post-separation mechanism (filtration)
A separate filtration system was utilized to ensure that the separation process using the hydrocyclone could be kept continuous eliminating the need to halt the system for particle filtration purposes. The filtration system consists of coffee filters, sieves of mesh size 40, 50 and 60 (425, 300, and 212 microns, respectively), and a bar magnet. The ideal outcome would be for all of the high-density metal particles to be caught in the underflow while all of the low-density glass particles would be collected in the overflow. However, given the number of factors that affects cyclone separation efficiency; there were always mixtures in both the overflow and underflow. After the particles from both sides were recovered and dried separately, the bar magnet was used to separate the steel particles from the glass particles so that the particles could be weighed independently and recorded.
Experiment setup
Figure 4 shows the experimental apparatus, which is tilted away from the point-of-view at an angle of 20 degrees. Water was drawn from the source reservoir and directed through a lateral tube to the tangential inlet port of the hydrocyclone.A T-junction along the lateral tube allowed introduction of particles to the water flow.Particles were mixed with water to form slurry, which was then introduced to a flexible plastic bulb.The bulb was attached to the T-junction via a flexible section of those whose cross-section was controlled by the Quick-Grip® clamps. To start an experimental run, the clamps were released, and the slurry ran downward (the rate is easily adapted to lunar gravity) allowing the particles to mix with the primary fluid flow along the lateral tube.
During experimental runs, the primary fluid flow was established first, so that the air core inner vortex initially created has time to be fully-filled with water.In a vacuum environment this would happen even faster.In continuous operation this step would only be needed at cold starts.Once the flow has stabilized the clamp is released and the slurry of particles and water drain into the lateral tube.The particles become entrained with the primary flow and are injected into the hydrocyclone tangential inlet port, and begin to swirl, as shown in figure 1.
The mixture of particles is then becomes separated into the overflow and the underflow. The particle collection buckets were tilted at an angle to allow excess particle-free fluid to flow into a fluid collection container.From there, the fluid is pumped back to the source reservoir to be recycled for continuous operation.These buckets were sized such that the particles settled in front of the weir, and must be taller for operations in lunar gravity (0.166g), where settling is slower.
Due to the experimental constraints of having the test results independent from one another, the operation of the system was halted once the mixture of particles had gone through the hydrocyclone. This also allowed for the monitoring of clogged particles’ presence in the apparatus so that they can be removed to ensure subsequent experiments were carried out with similar and consistent parameters(Figure 3-6).
Test conditions
A key change from the original CV06 Mini Cyclone was the addition of a 3D-printed underflow spigot/apex nozzle made of PLA (see Figure 7). This changed the underflow opening from the original diameter of 2.25 inches (designed for air) to 0.25 inches (adapted for water).As was observed during the experiment and from literature that “limiting the fraction of water in the underflow increases the separation efficiency”.1Sovechles also indicated that “this restriction increases both the particle density and the radial velocity around the apex region,” leading to more water and low-density materials reporting to the overflow while high-density ones report to the underflow.
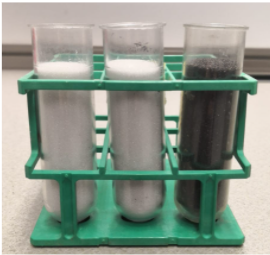
Figure 6 Total of 270 g of particles, consisting of glass (white) and steel (dark gray), before mixing and testing.
It has been indicated that the shape of the underflow spray influences the performance of a hydrocyclone.7 The change to a 0.25-in diameter underflow (Figure 8) also led to a discharge visually shaped between a roping discharge and a spray (figure 9 left).The 0.25-inch diameter was submerged underwater to eliminate the air core, and reduce underflow particle mixing (figure 9 right).This reasonably simulates the airless conditions on the Moon. Further details on methods are presented in the Appendix.
Separation and concentration results
After running a test, there are three outcomes from the input of steel and glass particles:
The hypothesis to be tested is that proportionately more steel than glass will be recovered in the underflow, and that the rejected overflow will be deficient in high-density particles.An ideal design will have no dead spaces in which particles of either density can become fully disengaged through the flow.With the extant apparatus, some amount of loss was experienced in each run.Lost material was removed from results, and assumed to be all high-density particles, so that all readings are reported in the least favorable way possible.
Figure 10 shows the particles recovered in the underflow from the original 270g of figure 7. Visually, the loss of glass particles in the underflow is readily appreciated.In terms of solids concentration, this indicates an increase in steel concentration at the underflow, or a higher ratio of steel mass to total underflow mass.

Figure 10 Recovered, dried, and magnetically separated underflow particles from a test run using the material of Fig 6.
Figure 11 shows the rejected overflow material, which has been dried and then separated magnetically to separately weigh each fraction.Visually, the amount of glass (light brown) is much more than the amount of steel (dark).Of course, mass readings have given a more accurate indication, as presented below.Variable loss of material inside the cyclone became a source of experimental error, per the assumption made that only high-density particles were lost in this way.
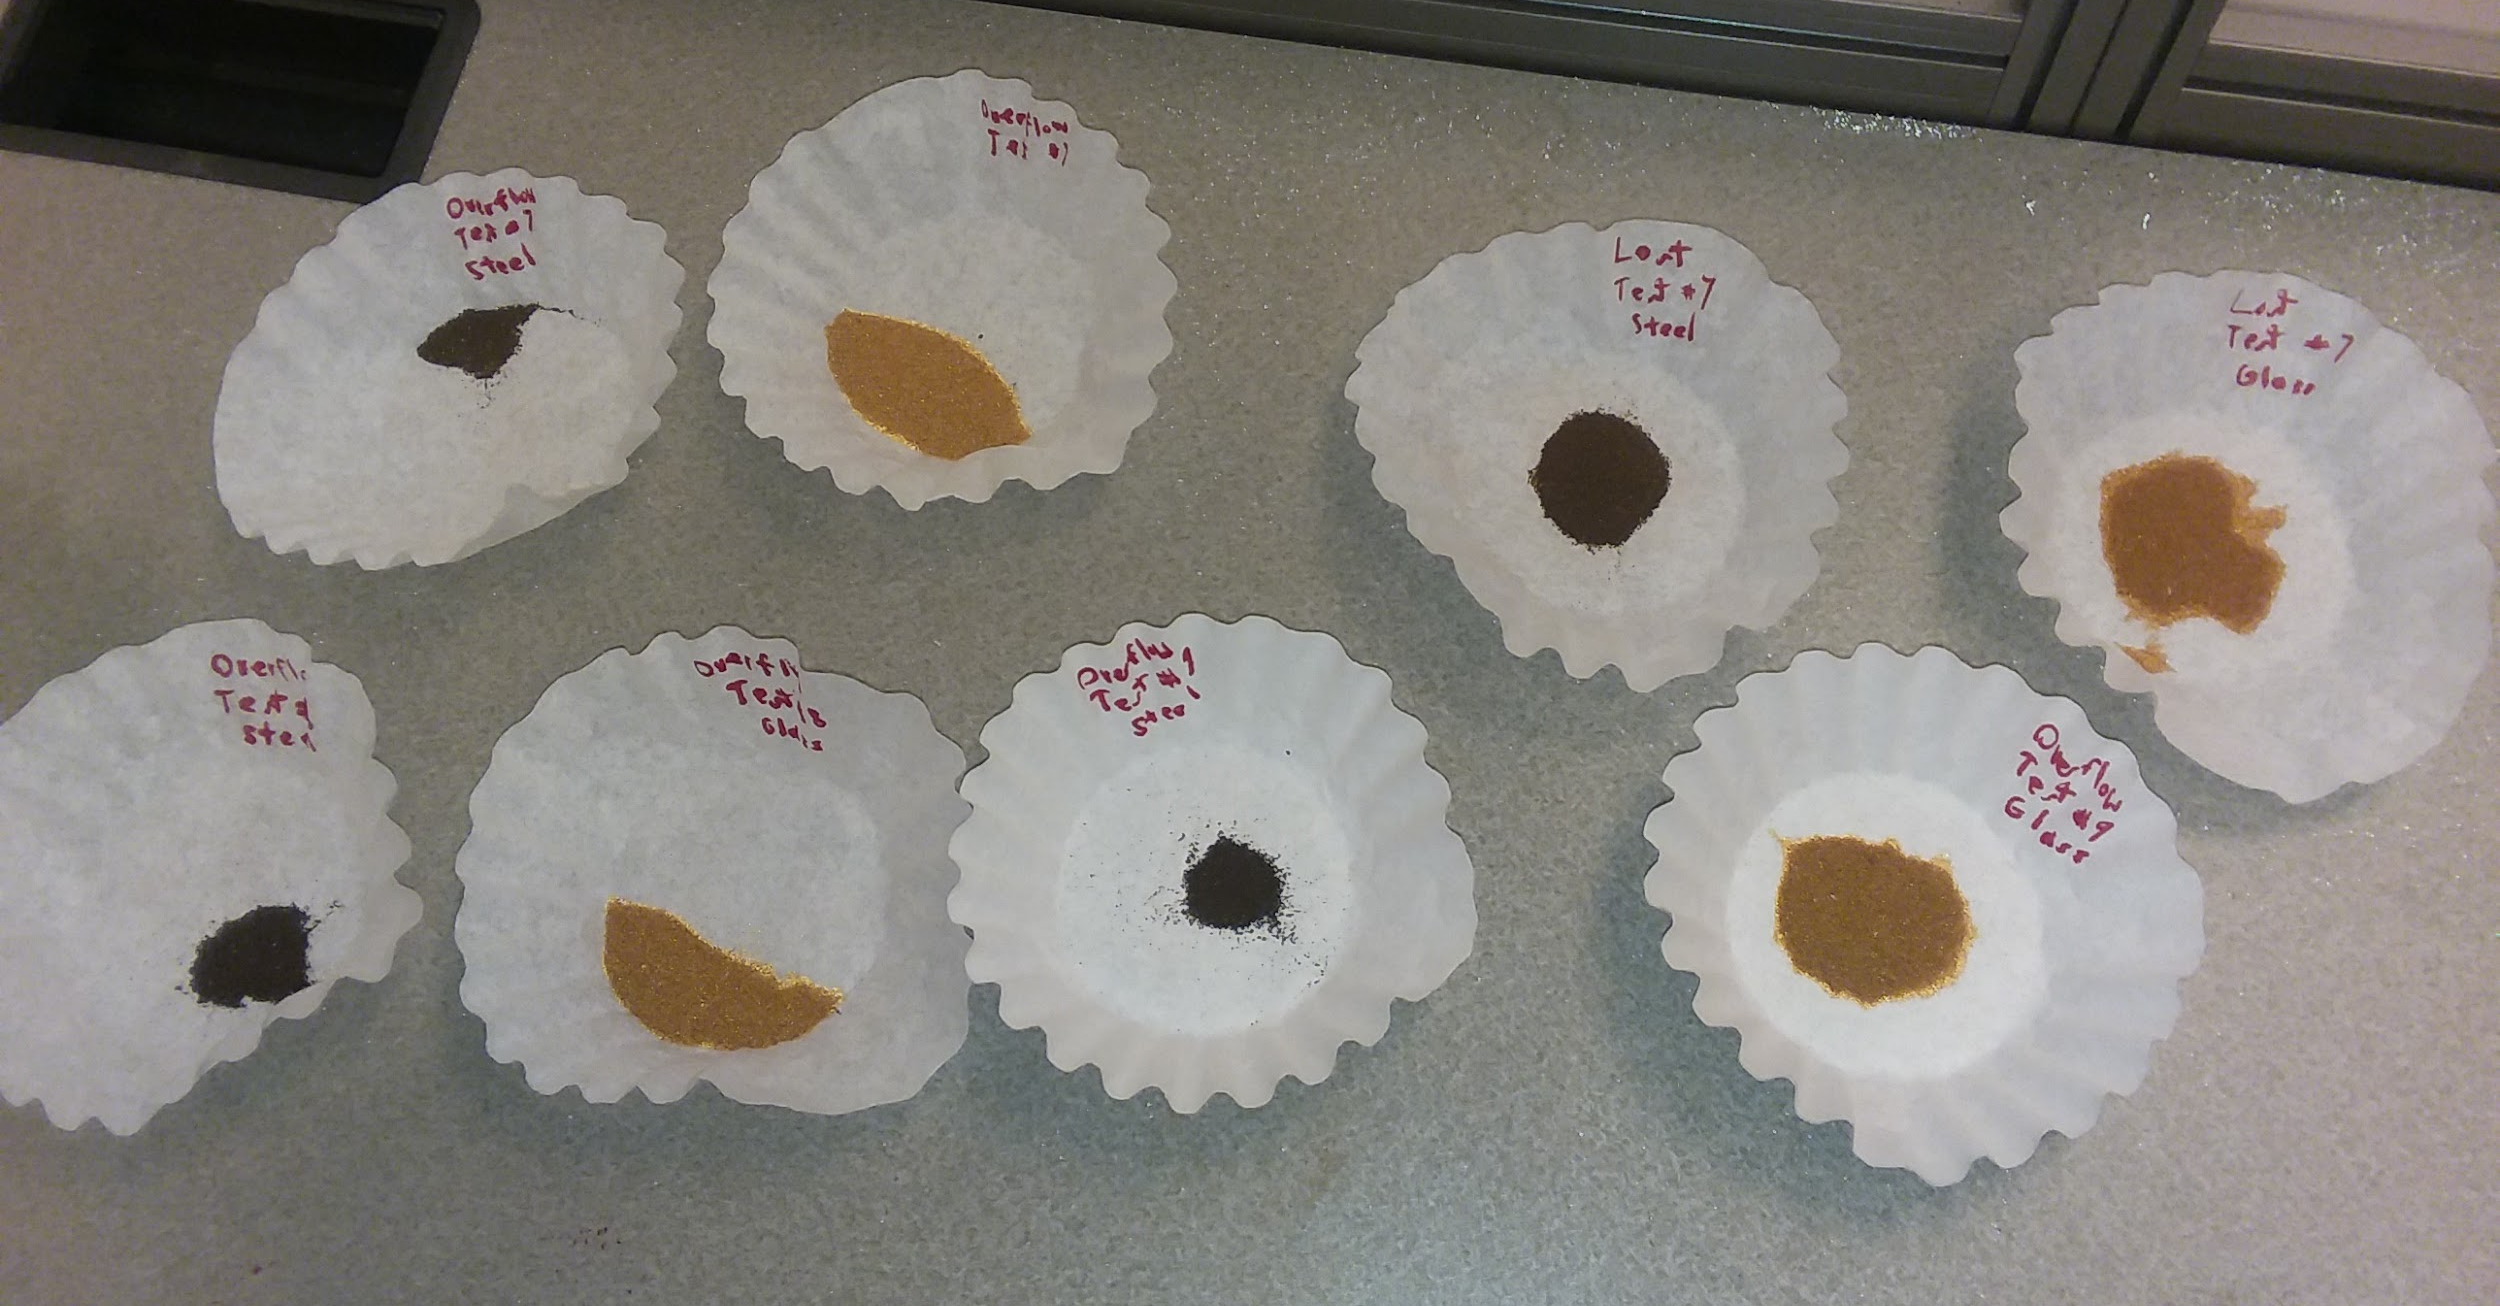
Figure 11 Steel (black) and glass (light brown) across three independent tests. Top row: The two on the left are from overflow and the two on the right are lost from that test. Bottom row: Two on the left and two on the right are from the overflow of two different tests.
Measured results for overflow and underflow are reported in input ratio of high-density to total input mass, and the increase in recovered underflow concentration of high-density particles after one cycle, as a function of hydrocylone tilt angle.Separation enrichment as a percentage is reported in the last column, and ranges between 1.0 and 5.4 percent concentration per cycle(Table 2).
|
Input mass ratio (steel/total) |
Absolute input mass (g) |
System angle (º) |
Increase in concentration after 1 cycle (Separation) |
Separation as % |
|
0.141 |
270 |
23 |
0.01 |
2.4 |
|
0.259 |
270 |
27 |
0.022 |
3.6 |
|
0.259 |
270 |
27 |
0.034 |
2.1 |
|
0.259 |
270 |
45 |
0.019 |
2.3 |
|
0.259 |
270 |
23 |
0.028 |
2.2 |
|
0.356 |
270 |
23 |
0.054 |
1.3 |
|
0.574 |
270 |
24 |
0.024 |
3.4 |
|
0.574 |
270 |
27 |
0.021 |
2.1 |
|
0.574 |
270 |
27 |
0.021 |
1.1 |
|
0.598 |
254 |
24 |
0.036 |
1.9 |
|
0.605 |
239.7 |
0 |
0.018 |
1 |
|
0.623 |
209.7 |
0 |
0.017 |
5.4 |
|
0.634 |
238.2 |
27 |
0.011 |
2.8 |
|
0.64 |
197.1 |
0 |
0.028 |
1.8 |
|
0.654 |
176 |
0 |
0.017 |
1.7 |
|
0.759 |
270 |
27 |
0.023 |
2.8 |
|
0.878 |
270 |
27 |
0.013 |
1.7 |
Table 2 Combined results by steel input mass ratio
Not reported are many of the early trials, which were not usable due to issues with measurement and learning to operate the system. An immediate observation from Table 2 is that across various test conditions, relatively similar concentration improvements were observed. Within the range reported, most results lie within the range of 2 to 3 percent separation enrichment.
Graphs of each variable versus the separation (steel concentration increase) are shown below. As multiple factors were changed between trials, these graphs provide only average behavior, with other variables being confounded behind a linear trend line.Goodness-of-fit metric R2 is low due to variability, but also due to the relative insensitivity of performance to initial material mix ratio.This is a favorablefinding when considering multiple sequential separation stages(Figures 12-14).
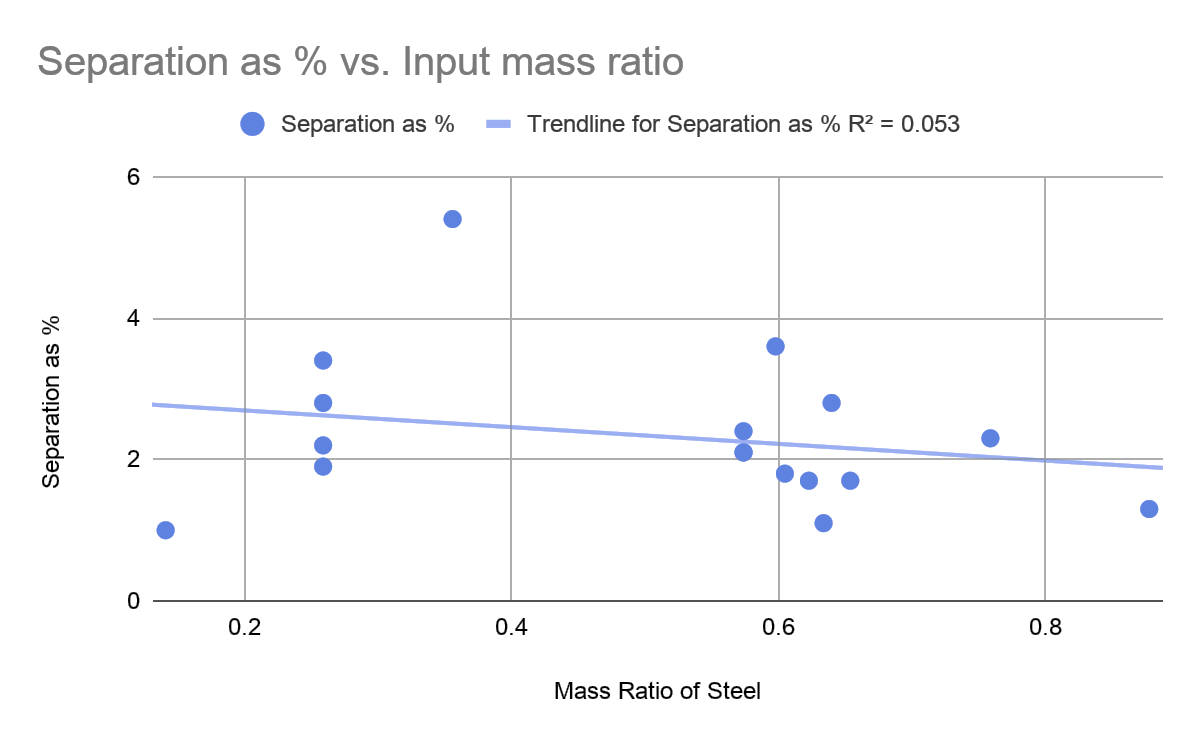
Figure 12 Separation enrichment of high-density particles (steel) as a function of the input mass ratio.
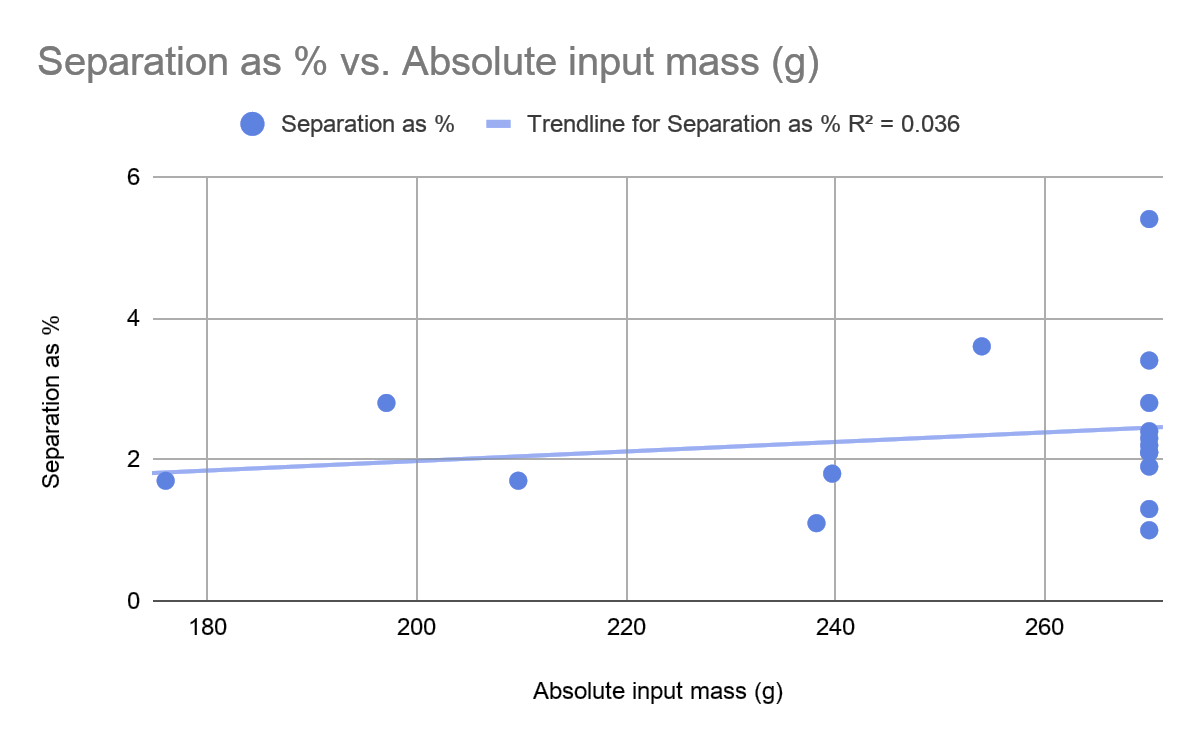
Figure 13 Separation enrichment of high-density particles as a function of the absolute total mass of input material.
Figures 13 & 14 show insensitivity to starting load mass and to the tilt angle of the apparatus.The first is favorable becausethe process operates within at least this range of input flow rates without appreciable influence on the outcome.The second is favorable because it indicates insensitivity to gravity, as was expected based on review of the literature.
Effects of particles steel input mass ratio on high-density particles concentrations
Figure 15 shows composite data on enrichment versus input mass ratio of high-density particles. Results from repeated trials were averaged to reduce scatter.
The rightmost point on the plot of figure 15 was calculated because, obviously, if only high-density steel is input, than the underflow will be 100% steel, and the enrichment will be identically zero.The other three points, covering a 3:1 range of concentration, again show the relative insensitivity of separation enrichment with the mix ratio of high- and low-density particles.The rise towards smaller input mix ratios is encouraging because of the low initial concentration of actinide-bearing minerals in the lunar regolith.This result increases confidence in predicting the outcome of successive or repeated passed through the hydrocyclone.
This would seem consistent with expectations of hydrocyclone operation, as when a larger proportion of the light material (glass in the experiments) is present, it is more likely for the reversed vortex to capture it and for it to report to the overflow. Further, existing research indicates that heavy particles are much easier to control than lighter ones,5 which is consistent with this trend: the primary factor changing between trials can be assumed to be the number of light particles (glass) being removed through the overflow, which is more volatile than the number of heavy particles (steel) falling to the underflow.
Estimation of the number of cycles to purity
One goal of this research was to estimate the required number of cycles to achieve relatively pure thoria in the practical version. There are several variables that still need to be tested, especially the behavior of the hydrocyclone starting from very low mass concentrations of the heavy material and with smaller particle sizes as would be prevalent in situ. However, some amount of rough estimation is possible.Given the weak dependence of separation enrichment with respect to most process variables, a simple relationship between the purity C and thenumber of cycles n can of enrichment fraction x be expressed as:
(4)
This assumes the initial actinide concentration is approximately 10ppm.With the average concentration results found herein of about 0.025, and a target concentration of 95% pure actinide mineral (eg. thoria), the number of cycles required is 120.
Each sample run, after reaching steady state, required between 22 and 30 seconds before the particles were no longer visible inside the clear hydrocyclone body.Using 60 seconds as a cycle time, including time to return the underflow to the inlet feed, a 0.25kg batch can be purified in 2.0 hours.This results in a process flow rate of 1.25mg of actinide material per hour of operation.To achieve a 15kg mass of material then requires 12,000 hours, or 50 earth-days of duration.If this work is performed using solar power which only runs 50% of the time, the duration extends to 100 days of lunar operations.This quantity of thoria, when transmuted to uranium, can power a 2MWe fission reactor for over six years.8
The mass of this prototype apparatus was 95kg dry, and used a total of 246kg of water.Closed-loop steady state power consumption was 0.98kW.Now-outdated lunar landers contemplated by NASA envisioned soft-landing payloads of 6 MT, compared to which the 0.34 MT of this apparatus leaves plenty of room for more.The power can be provided by two solar panels.Neither the mass nor the power were optimized for lunar operations, and can likely be made appreciably smaller.
While hydrocyclones can be used to separate particles by size and density, the size effects are generally dominant. Changes highlighted below are needed to enhance density separation.
Using a non-optimized home-built hydrocyclone density separator, technical feasibility has been proven for density-based beneficiation of actinide-bearing minerals on the lunar surface.The following conclusions have been determined:
This study focused on concentrating the sparse ore, and implicitly assumes excavation and materials handling pre-processing steps.Using the fuel preparation methods published elsewhere, this work demonstrates a practical approach to plentiful baseload power on the Moon.
This project is sponsored by the Richard G. Lugar Center for Renewable Energy (www.lugarenergycenter.org). The authors would like to thank the Department of Mechanical and Energy Engineering and the Department of Electrical and Computer Engineering at IUPUI for their logistical support.The guidance of Prof. J. Stang is especially appreciated.
Authors declare that there is no conflict of interest.
Design equations
Loss Coefficient as a function of cyclone geometry
Static head as a function of velocity head at periphery
Velocity increases as radius approaches vortex, established empirically
Most common approach to estimating reynolds: function of inlet velocity and cyclone diameter
Navier-Stokes approach to motion inside cyclone
Detailed testing procedure

©2021 Schubert, et al. This is an open access article distributed under the terms of the, which permits unrestricted use, distribution, and build upon your work non-commercially.