eISSN: 2576-4543


Mini Review Volume 2 Issue 1
1Department of Physics, The Islamia University of Bahawalpur, Pakistan
2Department of Physics, Government Sadiq College Women University, Pakistan
3Department of Physics, Bahauddin Zakariya University, Pakistan
Correspondence: Hafeez Ullah, Biophotonics Research laboratory, Department of Physics, The Islamia University of Bahawalpur, 63100, Pakistan
Received: August 10, 2017 | Published: February 6, 2018
Citation: Ullah H, Andleeb F , Hussain F. Fundamentals of optical coherence tomography: a critical review. Phys Astron Int J. 2018;2(1):59-62. DOI: 10.15406/paij.2018.02.00049
The main objective of this work is to go through fundamentals, mechanism and types of the state of the art emerging imaging modality i.e. optical coherence tomography (OCT) for non-invasive 3D imaging of bio tissues. This work consists of literature studied critically for OCT’s contribution in axial scanning of bio tissues with it different types to the best of our knowledge. Doppler optical coherence tomography (D-OCT) and speckle variance optical coherence tomography (SV-OCT) for blood flow assessment and blood microvasculatures on micron-scale resolution with dorsal skin-fold window chamber model (WCM) of mouse, Fourier domain common path (FD-CP-OCT) for applications in the setting of delicate microsurgical procedures such as intraocular retinal surgery have been explored. We conclude that OCT is the promised imaging modality in 3D regime for non-invasive applications.
Keywords: optical coherence tomography; 2D and 3D imaging; ocular vision; non-invasive imaging
OCT is a high resolution imaging modality that uses low coherence interferometry (LCI) techniques (in situ and real time) with axial resolution of 1-15 µm to perform high resolution imaging of biological tissues.1 OCT is suitable for real time imaging modality of transparent tissues up to depth limit of ~2 mm by scanning the reference mirror.2,3 In the beginning, LCI was applied in measurement of in vivo corneal thickens in noninvasive high precision and high resolution ophthalmologic biometry using a dual beam interferometer. David Huang et al.,4 in 1990’s made advancement in two dimensional LCI of eyes towards clinical studies.4 In the same decade Brezinski et al.,6 started the development of OCT for imaging in nontransparent tissues like vulnerable plaques mapping and human coronary artery.5,6 The significant applications of OCT include clinical diagnostics of cardiovascular system, joints, gastrointestinal tract, bladder, female reproductive tract, respiratory tract, surgical guidance and dentistry.7
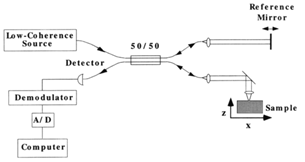
Figure 1 shows a schematic diagram of a simple Michelson interferometer used in time domain (TD-OCT). The reference arm is needed to measure the intensity of interference to assess back reflection intensity indirectly. In TD-OCT, light from the source is divided evenly by the beam splitter, half towards the sample and half towards a moving mirror.8 Light is reflected back from the mirror and within the sample. Both of the signals are recombined at the beam splitter and detected usually by a photodiode or CCD camera. The interference signal depends on the difference in path length and coherence length of the system. If the path length lies within the coherence length of the light source, the interference is produced and intensity of interference represents back reflection intensity.

Figure 1 A conceptual diagram of Michelson interferometer in OCT system. The resultant interferogram is sent to detector (Copyright Wiley-VCH Verlag GmbH & Co. KGaA. Reprinted from).26
Other than TD-OCT, the types of OCT include FD-OCT, SS-OCT, PS-OCT, D-OCT and SV-OCT etc. the detail of each type with signal detection and processing is described below.
Ultra high resolution optical coherence tomography and electroretinography
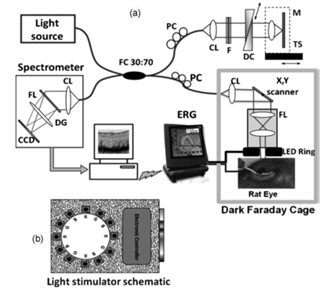
Ultra high resolution optical coherence tomography (UHR-OCT) is coordinated with electroretinography (ERG), as UHR-OCT+ERG, to study the function of rodent eye of rat (Figure 2 (A)). This OCT system, uses super-luminescent diode ( ) with beam diameter of 2.5mm, resolution 3 x 5µm (axial x lateral), and sensitivity 99dB for 1.3mW power at the rat cornea.9 The read out rate of the indium-gallium arsenide (InGaAS) CCD camera is 47-kHz. The retina is fully illuminated with light simulator made of 12 LEDs (red, blue, and green) shown in Figure 2 (B). A 120nm center hole in the ring was used to obtain a clear path of the imaging beam mounted coaxially to the distal end of the UHR-OCT imaging probe (d=25mm, f=35mm). UHR-OCT also has potential application for imaging the capillaries in the inner and outer plexiform layers of retina.10

Figure 2 (A) Conceptual diagram of the combined UHR-OCT and ERG system; here, CL: collimating lenses, DC: dispersion compensation unit, NDF: neutral-density filters, FOI: fiber optic isolator, M: mirror, PC: polarization controllers, TS: translation stage, DG: diffraction grating, FL: focusing lens (reprinted with permissions).10
Fourier domain optical coherence tomography (FD-OCT)
In FD-OCT, the light is scattered from all layers or targets simultaneously and is measured at the same time in which the number of photons scattered back from illuminated tissues are measured as a function of the path length in the tissue resulting in scattering amplitude ID(z).11 A spectrometer can differentiate the wave numbers at the output of the interferometer.
The demerits of FD-OCT include are (1 FD-OCT is sensitive to motion artifacts of the sample because wavelengths scattered within a volume present in the power spectrum can interfere. 2) In FD-OCT, the usual light source is an infrared laser ~1300nm so a high resolution spectrometer is needed for large wavelength that cannot be detected by silicon photodiode.
Fourier domain common path OCT (FD-CP-OCT)
The FD-CP-OCT optical setup is mostly used for birefringent imaging of bio tissues and consists of SLED ( ) in which light is coupled to one of the arm of the optical fiber coupler (2×1) and exiting beam is incident on the sample from other end of the probe. A partial reflector is situated near the distal end of the probe arm to provide the reference signal. The coupled signal is received by the spectrometer capable of up to 28,000 line scan per second (2048 pixel) from the other arm of the optical fiber coupler to get longitudinal images.12 For the birefringence sample’s (e.g. fresh beef) tomograms, this system is manipulated by putting the fiber-type circular retardation plates between the bare fiber probe and the directional fiber coupler for different polarizations and positions to characterize the collagen tissue.12
Swept source-OCT (SS-OCT)
The tissue motion artifacts are not periodic in nature; such types of artifacts can be removed by faster imaging. SS-OCT similar to FD-OCT as discussed above is based on spectral interferometery and is faster than conventional time domain OCT. SS-OCT produces similar images to time domain OCT with resolution ~10μm and flow sensitivity in tens of microns per seconds. The system is not complex as TD-OCT.13 In this review article, we have included Fourier domain mode locked laser for SS-OCT imaging of glucose monitoring in whole blood. The laser had an optimal signal to noise ratio (SNR) than time domain OCT and capable of sweeping rates of 36kHz that make it a better choice for phase sensitive imaging. The mathematical treatment behind SS-OCT is given below.
Spectral domain polarization sensitive OCT (SD-PS-OCT)
This free space polarization-sensitive OCT setup mostly uses super-luminescent diode ( , axial resolution ~4.4μm in air, power ~25mW) to image intensity, phase retardation, and fast axis orientation of ex vivo bio tissues with a single line-scan In GaAs camera (1024 pixels) and an optical switch.14 The acquired data is digitized with a frame grabber (PCIe-1427). The spectral domain data is sampled as a function of the wave number using the linear interpolation method. The SD-PS-OCT systems have very good performances for ex vivo images of a rat tail tendon.
Doppler optical coherence tomography (D-OCT)
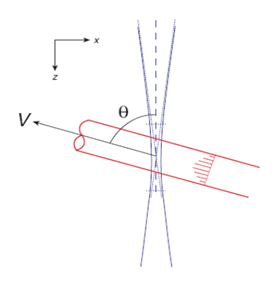
The Doppler effect is used in laser Doppler flowmetry (LDF) and Doppler ultrasound imaging whereas, only LDF can be implemented for microcirculation assessment in the clinical environment for endoscopic tissue access.15 LDF is an excellent tool for detecting relative blood flow changes in superficial tissues, such as the skin, retina, and gastrointestinal tract.16–19 Consider the arbitrary geometry with Doppler angle as shown in Figure 3, the Doppler frequency of the blood flow can be written as;19

Figure 3 Coordinate system for blood flow (red) through the optical beam (blue) (reprinted from) (Color online).19
Where v is the blood flow velocity ( ), f0 is the center frequency of the broadb and light, is the refractive index of tissue, is the wavelength in the medium with refractive index ‘n ’and ‘c’ is the velocity of light. This frequency shift is much harder to detect, consequently D-OCT provides the possibility to detect the minimum velocity.19
Velocity variance mode of D-OCT
This mode of Doppler flow detection requires relatively little additional computation to obtain the velocity variance information. This mode can detect areas of significant turbulence, such as flow near obstructions and bifurcations in vessels from heart wall motion. The information from color Doppler and variance mode can be combined to display directional velocity variance data.19 A self-referenced D-OCT Michelson interferometer can perform this velocity detection from thick medium very easily.20
Intravital imaging of microvasculature during photodynamic therapy (PDT)
D-OCT has been proved to give good results in case of vascular response to localized PDT. PDT is the new technique for treatment of many cancers like abnormal choroidal neovascularization using the photosensitizer Visudyne.21 This Visudyne single-photon PDT has been implemented using the WCM to investigate the vascular-PDT response in vivo at the single blood vessel and vascular endothelial cell levels. The WCM is applied to the ~400µm thickness of the tissue.
Speckle variance OCT (SV-OCT)
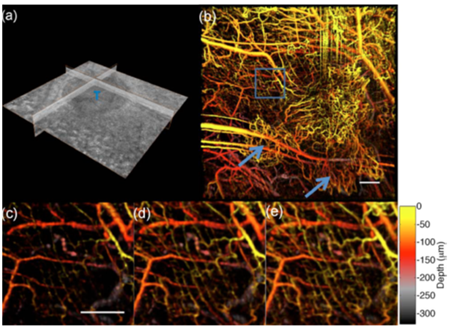
SV-OCT has been potentially applied for the microvasculature imaging.22–24 To minimize the effect of motion artifacts, the correct choice of imaging parameters is necessary. WCM is implemented on nude mouse for low bulk tissue motion (low BTM) to iamge 9L gliosarcoma tumor 9 days after implantation in the WCM. SV-OCT scans the spatial area ~5 x 5mm2 at 1600 positions and it takes 10 min to complete the whole imaging. Figure 4 (A) shows the orthogonal slices through the structural data whereas the SV-OCT’s 3D image of vasculatures is shown in Figure 4 (B), with color coding according to its depth in the tissue.22,23 Since, the gate length plays a vital role in SV-OCT, therefore in Figures 4 (C–E) it is demonstrated that how the contrast of smaller vessels has been improved for change in the gate from 2 to 8. These results reflect that the SV approach is superior for detecting microvasculature when compared to color Doppler.23

Figure 4 (A) Structured orthogonal slices through a 9L gliosarcoma tumor (t), (B) micro vascular projection image of the tumor, the depth of the vessels is represented by the color bar and (C)-(e) magnified region (750 x 750µm2) demonstrating the effects of increased gate length (N = 2,4,8). Scale is bar=250µm (reprinted with permissions) (Color online).23
Parallel OCT (pOCT)
In pOCT’s image acquisition, there is no need of lateral scanning of the beam which consequently reduces the acquisition time. It consists of a free space interferometer instead of the fiber-optics version in which two-dimensional image sensor is used as a detector. Thus, the speed of the axial scanning in pOCT can be increased by the factor equivalent to the number of parallel pixels. A signal wise demodulation is needed to get full-field imaging which usually implies resolving the low-amplitude interference pattern on top of the dominating static component.25
OCT can provide anatomical and physiological information of the body for medical imaging as noninvasive and free contact. In this context, OCT has played a vital role in real time control of clinical treatment like photodynamic therapy, laser therapy etc. in this review, we conclude that, OCT devices have been built according to the desire applications of organ imaging. Thus, among different types of OCT, Fourier domain OCT is found to be faster than rest of the techniques but swept source OCT provided high resolution that others. In the in vivo study, Doppler color OCT provide the best imaging mechanism for measurement of velocity of the blood flow underneath the skin. For Clinical application of skin tumor, OCT provides a platform to vessel envisioning.
We would like to acknowledge all those authors whose work is included/cited in this work.
Authors declare there is no conflict of interest.

©2018 Ullah, et al. This is an open access article distributed under the terms of the, which permits unrestricted use, distribution, and build upon your work non-commercially.