Open Access Journal of
eISSN: 2575-9086


Research Article Volume 1 Issue 2
1Centre of Studies for Surveying Science and Geomatics, Faculty of Architecture, Planning and Surveying, Universiti Teknologi MARA, 40450 Shah Alam, Selangor, Malaysia
2Applied Remote Sensing and Geospatial Research Group, Universiti Teknologi MARA, 40450 Shah Alam, Selangor, Malaysia
Correspondence: Khairul Nizam Tahar, Applied Remote Sensing and Geospatial Research Group, Faculty of Architecture, University Teknologi MARA, Malaysia
Received: June 02, 2017 | Published: August 1, 2017
Citation: Hadi MHA, Tahar KN. 3D slope based on different scanning resolution using geodetic laser scanner at Tanah rata Cameron highland. Open Access J Sci. 2017;1(2):29-32. DOI: 10.15406/oajs.2017.01.00008
The terrestrial laser scanner is a new technology which is use remote sensing and photogrammetric concept as efficient tools for fast and reliable three-dimensional point cloud data acquisition. This technology can measure a very high accuracy point cloud per minutes and this instrument is reflector less and contactless of acquisition of a point cloud by using the time of flight distance measurement of an infrared laser pulse. This study focuses on the capability of TLS in slope mapping. The objectives of this study are to generate 3D slope model based on various resolutions and to study the different attribute for each resolution. The resolutions that use such as 5mm, 10mm, 15mm and 20mm resolution. This study has been conducted at Tanah Rata Cameron Highland, Pahang Malaysia. The data acquisition is conducted at the selected slope at Tanah Rata using Topcon GLS1500 laser scanner. Ground control points are established using, Real Time Kinematic to provide a local coordinates system for laser scanner’s data position.1 The different resolution has been evaluated based on the slope mapping pattern. In this study, it was found that the resolution gives an effect in slope mapping pattern. Each resolution has each suitable degree of slope. Therefore, the scanning resolution needs to be identified according to the application.
Keywords: laser, slope, mapping, assessment, kinematic global positioning system, photogrammetry, terrestrial
Today, slopes are produce using Terrestrial L: aser Scanner (TLS) with high accuracy data. It has been used for monitoring land slide incident. Monserat et al.1 has proposed a new land deformation using TLS. According to Tsaki et al.2 there are many previous techniques has been used for landslide movement detection such as close range photogrammetry, real-time kinematic global positioning system, satellite image, leveling, airborne laser scanner and total station. The TLS have captured a high resolution of point cloud with x, y and z coordinate by sending a signal and capture it back. The principal use in laser scanner same as photogrammetry but the different is laser scanner can measure the distance from object to the centre of the instrument. Besides that, it offers a different scanning resolution and wider angle of coverage which is not available in photogrammetry.3,4
The laser scanner calculated the three-dimensional coordinates of each pixel of the object which is bearing, distance and high. 3D laser scanner is ideally suitable for the measurement and inspection of contoured surface that massive around of data for their accurate description. GLS measure details and capture free-from shape and quickly generate a highly accurate point. Besides that, GLS offers very high resolution of spatial sampling in 3D measurement without contact with the hazardous area Syahmi et al.4 The aim of this study is to determine the effect of the scanning resolution to the slope map. The different scanning resolution was captured by using 5mm, 10mm, 15mm and 20mm resolution at the same slope and same area. The data was produced a slope map to be analyze.
This study involves several phases. These include preliminary study, data collection, data processing and result and analysis. Figure 1 shows the flowchart of methodology used in this study. This study was conducted at prone area at Tanah Rata Cameron Highland, Pahang. Figure 2 show the location of study area and the condition of the slope of the study area at Cameron Highland.3 The study area is located about 10kilometres north of Ringlet or two kilometres before Brinchang along the main road. The coordinates is about latitude 4.4667 degree and longitude 101.3833 degree. In this study, data collections are obtain using terrestrial laser scanner, Topcon GLS 1500. The data were capture using four different resolutions at one selected study area. This study area was selected due to the frequent landslide incident in this area. So it is suitable for this study in order to analyze the slope model using TLS especially before and after landslide incident. The distance between TLS and target area were fix which is 100m and four epoch of observation were carried out in this study. A TLS is an active image capturing that sends out a laser beam that captures data at 30000 points per second at range about 150m with x, y and z dimension. This TLS also equip with 2.0 megapixel camera which is able to capture sharp and detail image of scanning area. Figure 3 shows TLS instrument and target point that has been set up for data collection.
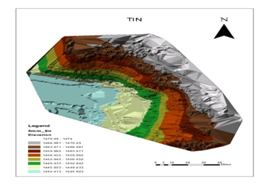
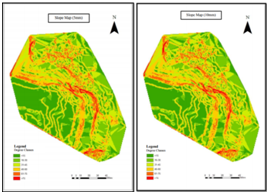
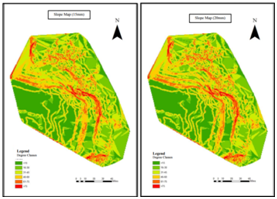
The data know as point cloud and their density based on the scanning resolution. The TLS record every single of features with x, y and z coordinate that is available during the scanning process. Figure 4&5 shows the example of point cloud data and triangulated irregular network (TIN) of the study area. All the point cloud was processed to obtain the objective of this study. Each resolution which is 5mm, 10mm, 15mm and 20mm was processed until produce a slope map. Each resolution took about two hours and if the resolution decreases, it will take more time to process. Figure 6 shows the slope map of each four resolution. Based on Figure 6, the results show the resolution effect on the slope map product. However, there is not much different between each resolution and each resolution can be used for difference slope degree. As a result, the scanning resolution can be determined based on the slope degree. These results describe in the Figure 7.

Figure 5 Triangular Irregular Network (TIN) after Processing Shows the General Visual of Slope Surface.

a) 5mm resolution b) 10mm resolution

c) 15mm resolution d) 20mm resolution
Figure 6 Slope Map for Four Difference Scanning Resolution (5mm, 10mm, 15mm and 20mm) With Six Classes.
Based on Figure 7, percentage of slope attributes for each class has slightly different for different resolutions. The different percentage between 5mm and 10mm resolution the first class (<15˚) is 0.03%, different 5mm and 15mm is 0.014% and different 5mm and 20mm is 0.525%. For the second class (16˚-30˚), the highest percentage is 15mm (21.751%) resolution and 5mm (21.626%), 10mm (21.615%) and 20mm (21.490%) resolution. The different percentage between 5mm and 10mm is 0.011% while the difference between 5mm and 15mm is 0.125% and 5mm to 20mm is 0.136%. Third class, 20mm is the highest percentage for the class (31˚-45˚) with 22.896%, 10mm (23.400%), 5mm (23.304%) and lastly 15mm (23.291%) resolution. The difference between 5mm and 10 mm is 0.096% and different between 5mm and 15mm is 0.013%. For 5mm and 20mm resolution, the difference is 0.408%. Fourth class, the highest percentage of slope attribute for the class (46˚-60˚) is 5mm (22.390%), 15mm (22.309%), 10mm (22.29%) and 20mm (22.004) resolution. The difference of the percentage of the resolution is 0.1% for resolution 5mm and 10mm. For the resolution 5mm and 15mm, the difference is 0.081% and 5mm to 20mm is 0.386%. Fifth class is (61˚-75˚) records the highest percentage is 20mm (8.665%) resolution, second is 10mm (8.262%), third is 5mm (8.360%) and last is 15mm (8.251%) resolution. The difference between 5mm and 10mm is 0.002%. The difference between 5mm and 15mm resolution is 0.009% and the difference between 5mm and 20mm is 0.405%. Sixth class (>75˚), there are two resolution which is the highest percentage is 5mm and 20mm with percentage 0.982%, 10mm (0.966%) resolution and 15mm (0.974%) resolution. There are 0.016% differences between 5mm and 10mm resolution and 0.008% different between 5mm and 15mm while there are no difference between 5mm and 20mm.
For this study, it can be concluded that scanning resolution effected on slope map result. Therefore, the scanning resolution must be set based on the average slope gradient. The TLS provide high accuracy data and the faster data collection in slope area. The density of the point cloud also depends on the scanning resolution. In future, the scanning resolution can be change to larger interval or in centimetre value in order to see the effect in slope map. For the accuracy assessment, the study also can conduct for measurable object such as cube with well-known size that can be compare the true shape and scanning shape. Lastly, the study also can be carried out by using different distance.
None.
Author declares that there is no conflict of interest.

©2017 Hadi, et al. This is an open access article distributed under the terms of the, which permits unrestricted use, distribution, and build upon your work non-commercially.