eISSN: 2574-9927


Research Article Volume 3 Issue 2
University of Hassan, Morocco
Correspondence: Khalil El-Hami, Faculty Polydisciplinary, Laboratory of Nanosciences and Modeling, University of Hassan 1st, B.P. 145 Khouribga, Morocco
Received: March 05, 2019 | Published: April 16, 2019
Citation: Labtaini I, El-Hami K. X-ray diffraction characterization of the untreated calcium phosphate from two Moroccan mining zones. Material Sci & Eng. 2019;3(2):67-70. DOI: 10.15406/mseij.2019.03.00093
X-ray diffraction (XRD) analyses were performed on untreated calcium phosphate samples of the two mining zones of Morocco: Benguerir and Khouribga. XRD was investigated for the determination of the structure. However, a comparative study was carried out between the two types of phosphate to implement the observed differences. Results showed that the comparison between the two samples reveals significant differences at the level of the refinement parameters, crystallite size and microstrain but no changes in the crystal system.
Keywords: untreated phosphate, comparative study, X-ray diffraction
Calcium phosphate Ca3(PO4)2 has a wide range of applications in a number of fields, such as medical, chemistry and industrial. Calcium phosphates are used in many biomedical applications through good biocompatibility and bioactivity. In biochemistry, calcium phosphates participate in providing energy for metabolism and substances and contribute to important metabolic and enzymatic reactions in almost all organs and tissues.1 The main industrial application of calcium phosphate is in the production of agriculture fertilizers. Many studies have been carried out on the crystalline structure and the crystallographic parameters of natural phosphates; the most common way to determine such structures is X-ray diffraction. Therefore, a study at the crystallographic level can be useful to help us understand some properties related to different problem and applications. Indeed, many authors explored several analyses of untreated phosphates that show a variation of their characteristics and their field of application.2–4 The aim of this article is to compare the composition and the structure of calcium phosphate Ca3(PO4)2 from two different mining centers with X-ray diffraction. The particularity in this study is the characterization of the calcium phosphate samples as-received.
The collection of samples has been operated in the two mining centers located in Khouribga and Benguerir in the following manner: the untreated calcium phosphate is collected using a ladle of taking of samples from the conveyor belt, which ensures the supply of trains. The samples of untreated calcium phosphate as-received are put in Bottles and sent to the regional center of analysis and characterization “CRAC” located in the faculty of sciences and techniques Settat Morocco. X-ray diffraction (XRD) patterns were recorded by a diffractometer of type D2 PHASER Bruker (CuKα radiation, SSD160 detectors).
Rietveld refinement
For this comparative study, the Rietveld Refinement method was implemented. For the indexing of diffraction diagram, the informatics program DICVOL developed by Louër and al.,5 was used. This consists of a comprehensive method proceeds by direct variation of parameters by successive dichotomies. For the refinement, the Full prof program was used. This method allows adjusting the experimental diffraction diagram using as variable cell parameters. From the well-known Rietveld refinement method, cell parameters were determined, crystallite size and microstrain from broadening effects on the diffraction profiles of the untreated calcium phosphate samples.
Size of crystallites and microstrain
XRD is one of the direct methods that provide the possibility for calculating the particle size from the XRD data by Scherrer formula:6
L=K.λ/β.cos (θ) (1)
Where L is the crystalline size, λ is the wavelength of the radiation (λCuKα1/Kα2=1,54439Å). K is a constant; for this study we used the formula initially developed by Scherrer given by a value of:
2(ln (2/)1/2=0.94 (2)
β is the full width at half maximum (FWHM) given by the following expressions:
β2=|βcalc-βobs|2 (3)
θ is the range of the considered Bragg reflection. The technique of XRD is used to investigate structure parameters such as microstrain. The determination of microstrain is important for industrial applications. The microstrain is calculated using the following equation:7
M=4.ε.tan (θ) (4)
Where M is the microstrain and ε is a constant:
ε=/d (5)
And is the variation of the reticular distance of plans hkl:
=0.001/sin (θ) (6)
Figure 1 shows the representative powder X-ray diffraction patterns of calcium phosphate Ca3(PO4)2 taken from the mining center in Khouribga, recorded in a 2θ range from 10° to 52°. The automatic search of diffraction peaks, the refinement of their positions as well as the profile setting with the Win PLOTR program allows to obtain the precise positions of the lines in the diagram. All the reflection peaks were indexed in the monoclinic system (P2/m space group). The parameters generated by Full prof program are a=13.5 Å b=6.7 Å c=8.4 Å and β=93.9°. Direct cell parameters and volume, agreement factors are shown in Table 1 & Table 2 presents the hkl Bragg reflections (i.e., its position, width and intensity) obtained from Rietveld method, and the inter planar spacing that was calculated using Bragg’s law which relates dhkl to 2θhkl.

Figure 1 Rietveld refinement of untreated calcium phosphate as received taken from Benguerir mining center. The spectrum shows the Rietveld refinement of the untreated phosphate calcium from Benguerir zone.
Space group |
Cell parameters |
Volume |
Reliability factors |
P 2/m |
a=13.5 Å |
V=759.3 Å3 |
RP=36.4% RWP=37.6% |
Table 1 Parameters in the Refinement Rietveld Analysis of calcium phosphate as received taken from Benguerir mining center
N° |
2θ[°] |
Ic |
Iobs |
strF^2 |
dhkl |
H |
K |
l |
multi |
1 |
24.2 |
0 |
0 |
0 |
3.6 |
-2 |
0 |
2 |
2 |
2 |
25.7 |
35.8 |
36 |
40022.5 |
3.4 |
2 |
0 |
2 |
2 |
3 |
28.1 |
11.1 |
11.1 |
17016.1 |
3.1 |
-3 |
0 |
2 |
2 |
4 |
29.2 |
6.6 |
6.5 |
11766.4 |
3.1 |
4 |
0 |
1 |
2 |
5 |
31.9 |
75.8 |
76 |
98072.1 |
2.7 |
2 |
2 |
1 |
4 |
6 |
33.1 |
39.0 |
39.1 |
50058.8 |
2.7 |
4 |
1 |
1 |
4 |
7 |
40.1 |
18.9 |
19 |
148510.5 |
2.2 |
6 |
0 |
0 |
2 |
8 |
40.8 |
0.6 |
0.5 |
4798.8 |
2.2 |
-6 |
0 |
1 |
2 |
9 |
42.3 |
3.8 |
3.8 |
20521.3 |
2.1 |
6 |
1 |
0 |
4 |
10 |
43.8 |
3.7 |
3.8 |
24260.2 |
2.1 |
-5 |
2 |
1 |
4 |
11 |
46.9 |
27.6 |
27.6 |
283062.1 |
1.9 |
3 |
3 |
1 |
4 |
12 |
48.2 |
9.5 |
9.4 |
116959.9 |
1.8 |
2 |
1 |
4 |
4 |
13 |
49.5 |
16.5 |
16.5 |
492398.5 |
1.8 |
-4 |
0 |
4 |
2 |
Table 2 Indexing of hkl lines of calcium phosphate as received taken from Benguerir mining center
Determination of crystallites size and microstrain
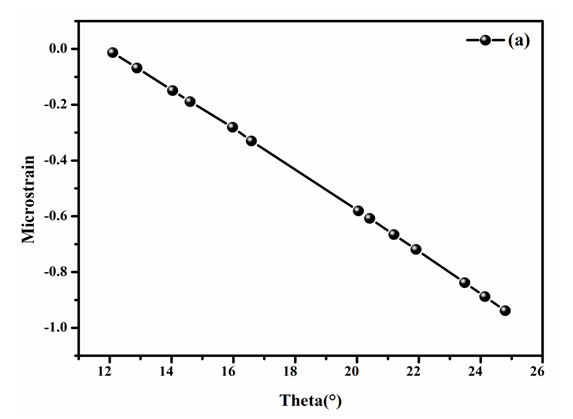
The Scherrer crystal size of the untreated calcium phosphate taken from Benguerir is obtained from the Eq. 1. Subsequently, the crystalline size is 40.8nm. It is calculated using the most intensive peaks at 2θ=31.9°. Figure 2 shows the profile of microstrain M found from the values that are shown in Table 3. The microstrain was inferred using Eq. 4 by taking the peaks determined by Rietveld refinement. Microstrain ranging from -1.3×10⁻² to -9.3×10⁻¹and decrease with the decrease of θ. There are many mechanisms that can induce microstrain such as: vacancies, dislocations, solutes or lattice bending.8

Figure 2 Micro strain of untreated calcium phosphate as received taken from Benguerir mining center. The micro strain of untreated calcium phosphate from Benguerir zone decreases as a function of theta. (A): The untreated calcium phosphate as received taken from Benguerir mining center.
N° |
2θ[°] |
Hw |
M |
1 |
24.2 |
1.6×10⁻¹ |
-1.3×10⁻² |
2 |
25.7 |
1.7×10⁻¹ |
-6.8×10⁻² |
3 |
28.1 |
1.8×10⁻¹ |
-1.4×10⁻¹ |
4 |
29.2 |
1.9×10⁻¹ |
-1.8×10⁻¹ |
5 |
31.9 |
2.1×10⁻¹ |
-2.8×10⁻¹ |
6 |
33.1 |
2.1×10⁻¹ |
-3.3×10⁻¹ |
7 |
40.1 |
2.5×10⁻¹ |
-5.8×10⁻¹ |
8 |
40.8 |
2.6×10⁻¹ |
-6.1×10⁻¹ |
9 |
42.3 |
2.7×10⁻¹ |
-6.6×10⁻¹ |
10 |
43.82 |
2.8×10⁻¹ |
-7.1×10⁻¹ |
11 |
46.9 |
3.1×10⁻¹ |
-8.3×10⁻¹ |
12 |
48.2 |
3.1×10⁻¹ |
-8.8×10⁻¹ |
13 |
49.5 |
3.2×10⁻¹ |
-9.3×10⁻¹ |
Table 3 Determination of microstrain of calcium phosphate as received taken from Benguerir mining center
Calcium phosphate taken from the mining center Khouribga
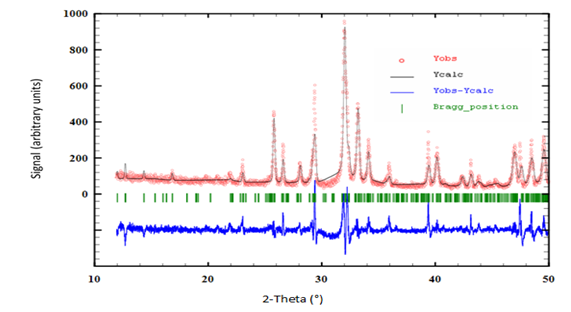
Figure 3 illustrates the Rietveld refinement of the Ca3 (PO4)2 untreated calcium phosphate taken from the mining center in Khouribga. The crystal system was confirmed to be monoclinic, space group: Pm/2, with refined cell parameters: a=14.2(8) Å b=8.1(9) Å c=7.8 (5) Å and β=102.1 (0)°. Rietveld refinement parameters are given in Table 4. The summary comparison of the two diffractogrammes samples did raveled no difference at the level of the crystalline system and space group. The unit cell volume and a, β parameters are significantly greater than those for Ca3 (PO4)2 from the mining center in Benguerir. In this case the increase in cell parameters and volume may be attributed to the different origin of the two samples. Table 5 synthesized the hkl Bragg reflections achieved by Rietveld method. Which depends to dhkl and 2θhkl. There is no parameter that can control the hkl reflections namely miller indices. They are associated with diffraction peaks and gave us atomic plans.

Figure 3 Rietveld refinement of untreated calcium phosphate as received taken from Khouribga mining center. The spectrum shows the Rietveld refinement of the untreated phosphate calcium from Khouribga zone.
Space group |
Cell parameters |
Volume |
Reliability factors |
P 2/m |
a=14.2 Å |
V=872.6 Å3 |
RP=52% RWP=45.3% |
Table 4 Parameters in the Refinement Rietveld Analysis of calcium phosphate untreated as received taken from Khouribga mining center
N° |
2θ[°] |
Ic |
Iobs |
strF^2 |
dhkl |
h |
k |
l |
multi |
1 |
25.7 |
51.9 |
52 |
25438.3 |
3.4 |
-4 |
0 |
1 |
2 |
2 |
26.5 |
20.6 |
20.6 |
5364.5 |
3.3 |
-2 |
1 |
2 |
4 |
3 |
29.3 |
40 |
40 |
12598.2 |
3.1 |
3 |
2 |
0 |
4 |
4 |
32.1 |
14.5 |
14.3 |
10773.2 |
2.7 |
5 |
0 |
0 |
2 |
5 |
33.1 |
74.3 |
74.3 |
29350.4 |
2.6 |
3 |
2 |
1 |
4 |
6 |
34.1 |
27 |
27.2 |
11239.5 |
2.6 |
1 |
3 |
0 |
4 |
7 |
39.3 |
22.8 |
22.9 |
12351.3 |
2.8 |
-3 |
3 |
1 |
4 |
8 |
40.1 |
16.2 |
16.5 |
18177.5 |
2.2 |
2 |
0 |
3 |
2 |
9 |
46.9 |
19.3 |
19.4 |
14214.3 |
1.9 |
7 |
1 |
0 |
4 |
10 |
48.4 |
35.4 |
35.4 |
55103.2 |
1.8 |
4 |
0 |
3 |
2 |
11 |
49.5 |
39.2 |
39.6 |
64520.5 |
1.8 |
1 |
0 |
4 |
2 |
Table 5 Indexing of hkl lines of calcium phosphate as received taken from Khouribga mining center
Determination of crystallites size and deformation
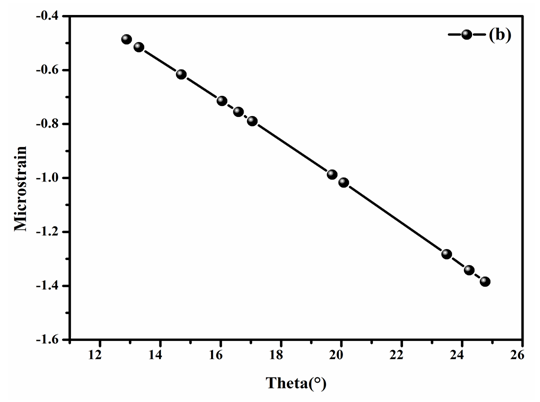
Analyses from XRD data using Eq. 1 gave an average size of 66.5nm calculated at 2θ=32.1°. It is seen that crystalline size of the Ca3 (PO4)2 from Khouribga center mining is greater than the one from Benguerir. This difference is evident in a comparison of the two samples. Table 6 recapitulates the microstrain values for the different peaks, which are plotted in Figure 4. The microstrain is plotted against θ. The two microstrain plots Figure 2 & Figure 4 of the two samples have provided the range of the crystalline microstrain of an untreated phosphate. Comparing the microstrain of the two samples a small change in values is observed. For both samples, when microstrain is present, the calculated “Crystallite Size only” will tend to decrease as a function of 2 theta and when crystallite size broadening is present, the calculated “Microstrain only” will tend to decrease as a function of 2 theta.

Figure 4 Micro strain of untreated calcium phosphate as received taken from Khouribga mining center. The micro strain of untreated calcium phosphate from Khouribga zone declines as a function of theta. (B): The untreated calcium phosphate as received taken from Khouribga mining center.
N° |
2θ[°] |
Hw |
M |
1 |
25.7 |
1.8×10⁻¹ |
-4.8×10⁻¹ |
2 |
26.5 |
1.9×10⁻¹ |
-5.1×10⁻¹ |
3 |
29.3 |
2.1×10⁻¹ |
-6.1×10⁻¹ |
4 |
32.1 |
2.1×10⁻¹ |
-7.1×10⁻¹ |
5 |
33.1 |
2.2×10⁻¹ |
-7.5×10⁻¹ |
6 |
34.1 |
2.3×10⁻¹ |
-7.8×10⁻¹ |
7 |
39.3 |
2.6×10⁻¹ |
-9.8×10⁻¹ |
8 |
40.1 |
2.6×10⁻¹ |
-1.1 |
9 |
46.9 |
3.1×10⁻¹ |
-1.2 |
10 |
48.4 |
3.1×10⁻¹ |
-1.3 |
11 |
49.5 |
3.2×10⁻¹ |
-1.3 |
Table 6 Determination of microstrain of calcium phosphate as received taken from Khouribga mining center
XRD analysis investigated by the Rietveld refinement was applied to untreated calcium phosphate samples Ca3 (PO4)2 untreated from two mining center: Benguerir and Khouribga. The Rietveld method allowed, simultaneously, perform direct cell parameters, hkl lines, and refinement of the crystal structure. Through the Scherrer formula, the size of crystallites was determined for both samples, the crystalline size was 40.8nm and 66.5nm for the untreated phosphate from Benguerir and Khouribga respectively. From the Rietveld method, the microstrain was also calculated concerning the untreated phosphate from Benguerir, microstrain was ranging from -1.3×10⁻² to -9.3×10⁻¹, as regards untreated phosphate from Khouribga microstrain was variations from -4.8×10⁻¹ to 1.3. Microstrain and crystallite size can be analyzed only when the broadening due to both is equivalent; when the amount of microstrain is large, the maximum observable crystallite size will be limited. These findings of the comparative study may help to identify for each type of untreated phosphate the adequate application: biology (teeth, bone), agriculture (production of fertilizers), in the electrical lighting industry (coating of fluorescent tubes) and in the field of quantum electronics. More specifically, it is interesting to compare the crystallographic parameters by XRD of both samples in order to investigate the variation of the composition by substitutions and thus act on their physicochemical properties.
None.
Author declares that there is no conflicts of interest.

©2019 Labtaini, et al. This is an open access article distributed under the terms of the, which permits unrestricted use, distribution, and build upon your work non-commercially.