eISSN: 2574-9927


Research Article Volume 5 Issue 4
1Centro de Investigación y Desarrollo en Mecánica, Instituto Nacional de Tecnología Industrial
2Instituto de Tecnologías y Ciencias de la Ingeniería, Universidad de Buenos Aires-CONICET, Argentina
3Consejo Nacional de Investigaciones Científicas y Técnicas (CONICET), Argentina
Correspondence: Leonardo Nicolás Tufaro, Centro de Investigación y Desarrollo en Mecánica, Instituto Nacional de Tecnología Industrial. Av. Gral. Paz 5445, B1650KNA, San Martín, Buenos Aires, Argentina
Received: August 06, 2021 | Published: August 23, 2021
Citation: Tufaro LN, Buglioni L, Svoboda HG. Effect of welding parameters on heat generation mechanisms in friction stir welding of AA5083 aluminium alloy. Material Sci & Eng. 2021;5(4):124-132. DOI: 10.15406/mseij.2021.05.00167
Friction Stir Welding (FSW) is a solid-state welding process which has revolutionized several industries in the last thirty years. The heat needed to produce the joint is generated by friction at the tool-workpiece interface and plastic deformation of the material, being affected by parameters like tool rotational speed, travel speed, axial load and tool geometry, among others. The objective of this work was to analyse the energy transformations during FSW of AA5083 aluminium alloy in order to achieve a better comprehension of the whole process, and particularly the heat generation mechanisms and material flow, which will define the quality of the joint. Experimental measurements of process parameters and conceptual analytical and numerical models were implemented. Consumed electric current, axial load and thermal cycles were acquired during FSW of AA5083 plates, for different rotational and travel speeds. From these measurements, different magnitudes (heat and torque) associated to the energy transformations were calculated. The relationships between welding parameters, generated heat and torque, sticking and sliding components and contact condition were analysed and related with material flow. The sticking heat was always higher than the sliding one, even when contact condition was closer to pure sliding. For a giving heat input, a higher sticking component produced an increase in the material flow.
Keywords: axial load, thermal cycles, heat, torque, sticking, sliding
Friction Stir Welding (FSW) is a welding process in solid phase, which has become the most important research subject of welding science and technology in the last years. Particularly, it has found numerous applications in joining aluminium alloys for welded structures in industries such as aeronautical and aerospace, automotive and shipbuilding, among others. The heat needed to produce the required plastic flow is generated by the friction at the tool-work piece interface and also by the plastic deformation of the material, being affected by factors such as rotational and travel speeds, axial load and tool geometry, among others.1–3 Colligan & Mishra4 proposed a conceptual model for process variables related to heat generation in FSW. As can be stated from this model, frictional stress and plastic flow stress are involved in torque and heat generation, responsible for the established thermal field, which also affect the first mentioned aspects. This interdependency shows the complexity of the heat generation study in this process. Schmidt et al.5 developed an analytical model for heat generation in FSW, being the most important difference with some pre-existent models the consideration of the contact condition at the interface through a dimensionless contact state parameter. This parameter is defined as the ratio between the stirred material velocity and the tool velocity at the interface, which can be called sticking rate (d).6 When contact condition is pure sticking d is 1, and when contact condition is pure sliding d is 0.3,5,6
Finally, it is important to note that the heat generated due to plastic deformation is in essence a volumetric heat flux, which can be modelled in that way in fully coupled thermo-mechanical or computational fluid dynamics (CFD) models.3,10,11 In thermal models, this heat can be considered as a surface heat flux at the tool-workpiece interface like in the analytical model of Schmidt et al.5 used in this work.3,5,10 Recently, some authors have performed experimental measurements of different parameters such as torque, axial load and thermal cycles during FSW of aluminium alloys, which have been used with analytical and numerical models to analyse the generation and transfer of heat during this process.3,5,7,9,12–16 Despite the significant contribution of these investigations to this subject, it has not been reached yet a full understanding of the different energetic transformations during FSW. The aim of this work has been to perform a comprehensive analysis of the energy transformations during FSW of AA5083 aluminium alloy, through experimental measurements of electrical current, axial load and thermal cycles during welding and simple analytical and numerical models, to reach a large and better understanding of the effect of welding parameter on the different mechanisms of heat generation and material flow. In this way, from experimental measurements and simple analytical and numerical models it was proposed a methodology to quantify the magnitudes associated to these transformations, with the purpose to achieve a better understanding of the friction stir welding phenomena, as a previous instance to the development and analysis of more complex numerical models. In particular, although the sticking and sliding components of the generated heat and torque were taken into account in models of other works, in general the magnitude of each component and the effect of the variation of the contact condition on them were not analysed. In contrast, it was an objective of this work to quantify the sticking rate and each component of heat and torque, which could be useful in the optimization of the welding procedure as Arora et al. Proposed,8 through a better understanding of the effect of welding parameters on these aspects. These concepts are not discussed enough in the literature. Finally, it was aimed to correlate this sticking and sliding heat components with the material flow, considering its relationship with the quality of welded joints.
Problem description
In Figure 1 is shown a graphical representation of the energetic balance during FSW process, in which the magnitudes can be considered values of energy per unit length (J/mm). In this scheme, it can be appreciated the energy transformations and losses which take place in FSW, from the consumed electrical energy by the machine to the net heat input which produces the thermal field in the welded sample (plates). This energy transformations that take place in FSW can be divided in three stages. The first one is associated to the machine energetic balance, in which the difference between consumed electrical energy and total mechanical work (WTotal) generated at the tool-workpiece interface (total torque ´ pitch) is associated to electrical and mechanical losses at the machine itself, i.e. the machine efficiency (hMach).12 Note that the pitch number is the ratio between the rotational speed (w) and travel speed (U). This machine efficiency is particular for each FSW equipment, but it must be considered depending on the type of measurements that can be done to characterize the process (i.e.: consumed electrical current).9 The second stage, associated to the heat generation at the tool-workpiece interface, is represented by the Schmidt et al. analytical model for the generated power (QTotal), expressed in Equation 1.
(1)
This model is a function of rotational speed (w), shoulder radius (Rs), pin radius (Rp), pin height (Hp) and shoulder cone angle (a), among others. Yield stress (sy), friction coefficient (m), contact pressure (p) and sticking rate (d) are considered uniform along all tool-workpiece interface.3,4,6 This is the major limitation of this analytical model, which can only be solved with numerical models.3 In this sense, in the recent years numerical models had been developed considering these parameters non-uniform along this interface and within the workpiece.7–9 Furthermore, to the Schmidt et al.5 model was added the mechanical efficiency (h), which indicates the fraction of plastic strain work which is converted to heat and which value is generally 0.9,6–8 although other authors have used lower values.9 In this second stage friction work (sliding torque ´ pitch) is totally transformed in sliding generated heat (HSliding), whereas the plastic strain work (sticking torque ´ pitch) is transformed with certain mechanical efficiency (h), resulting in the sticking generated heat (HSticking).5,7 At last, the third stage shows the heat transfer during FSW process, in which certain portion of the total generated heat (HTotal = HSliding + HSticking) is lost by conduction through the tool, whereas the remain is the net heat input (H), which produces the thermal field in the plates and later is transferred to ambient by convection and conduction through the plate’s sides.3 The ratio between net heat input and total generated heat is the thermal efficiency (hT), whose value is commonly in a range between 0.7 and 0.9.3 To perform an experimental analysis of the energy transformations during FSW process, electrical current, axial load and thermal cycles were measured during FSW of AA5083 under different welding conditions. From these obtained values, consumed electrical energy, generated heat for pure sliding condition (HSlidingd=0) and the net heat input (H) were calculated, respectively, as it is described below. At last, it was possible to calculate the remaining magnitudes of the process which appear in Figure 1, to perform a detailed analysis of them.
Welding and data acquisition
AA5083 plates of 150´75´3mm were butt welded with FSW process with different operating conditions, using an adapted milling machine. In Table 1 are shown the welding parameters used for the six different analysed conditions, as well as the resulting pitch number. The w and U were varied, whereas tool tilt angle was kept constant in 1.5° The employed tool was built with H13 tool steel with a smooth tapered pin and a concave shoulder. The pin length was 2.8mm, the shoulder diameter was 12mm and major and minor diameters were 4 mm and 3mm, respectively. During FSW, different process variables were acquired using a data acquisition card of 4 differential channels. Firstly, thermal cycles were measured with two K type thermocouples (TC1 and TC2), which were placed at mid length of the sample, at the advancing side. These were located at different distances of weld centreline, TC1 between 7 and 8mm and TC2 between 11 and 12mm, inside holes with 1mm diameter and 2mm depth. In Figure 2A is presented the FSW a detail of the thermocouples (TCs) location respect to weld centreline, whereas in Figure 2B is shown a welded sample with the experimental set up. Secondly, the line current (IL) of the asynchronous three-phase motor of the FSW machine was obtained by using a current transducer with a 10mV/A sensitivity and calculating the signal root mean square (rms) value. Finally, the axial loads (F) were measured, for which was employed an installed strain gage located at the machine head. Axial load magnitude was indirectly obtained by acquiring the deformation of the machine head, for which a previous calibration had been performed. Both signals were acquired during welding with the mentioned data acquisition card.
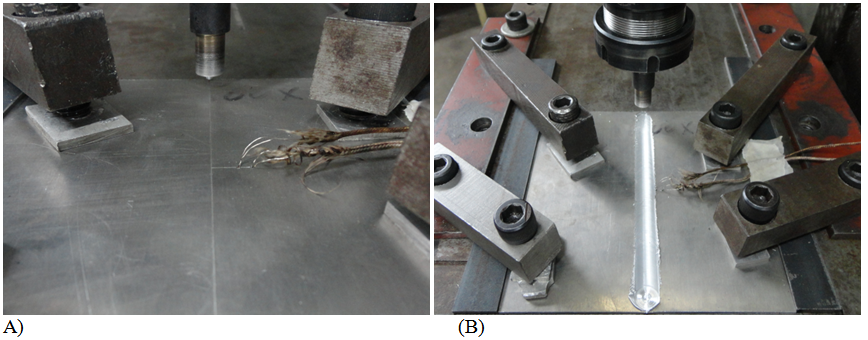
Figure 2 A) TCs locations for thermal cycles acquisition during FSW, B) Welded sample and FSW experimental set up.
Finite element modelling of heat transfer
To obtain net values of power (Q) and heat input (H) from acquired thermal cycles, the heat transfer during welding process was modelled by finite element method (FEM). To achieve this, three-dimensional heat transfer was considered only by conduction in the plates, solving the model in a transient way.17 The thermal properties of the material were considered constants, whose values were a density of 2660kg/m3, a thermal conductivity of 117W/(m.K) and a specific heat of 900J/(kg.K).18 Heat density generated by the friction between tool shoulder and plates increases with tangential velocity, which is indeed the product between rotational speed and distance to the heat source centre.6,10,12 For this reason, in the model it was used a spatial distribution of heat source, linear with distance to tool centre. The heat losses to the ambient by conduction to the backing plate and by convection in the remaining boundary surfaces were considered. Dissipated heat by convection depends on convection coefficient between plate boundary and ambient, which has been considered of 20W/(m2.K).19 It was supposed also that heat transfer towards backing plate is with a large enough solid to not modify its temperature (20°C).12 This dissipated heat depends on conduction coefficient, which was determined experimentally when finite element model was calibrated. The conduction coefficient resulted to be 200 W/(m2.K), which is similar to the value reported by other authors.12 Net power (Q) was obtained matching the thermal cycles with the numerically obtained ones corresponding to the location of each thermocouple. Then, the neat heat input (H) was calculated as the ratio between net power (Q) and travel speed (U).17
Macrographic analysis of welded joints
Cross section samples were extracted from the middle length of different welded joints and were prepared for metallographic observation. By means of Light Microscopy (LM) different characteristics of the welding nugget (WN) were analysed. Particularly, the welding nugget area (WNA) for each welding condition was calculated using an image analysis software. Other aspects related to material flow were also assessed, as penetration or defects presence.
Thermal cycles
Acquired thermal cycles for the studied welding conditions for extreme values of pitch number (4.7 and 12.4) are shown in Figure 3. It can be seen significant variations in peak temperatures, cooling rates and duration of the thermal cycles between the maximum pitch value and the minimum one, showing the influence of welding conditions on the generated thermal fields. In Table 2 the characteristic values obtained from the acquired thermal cycles for the different welding conditions are shown. The effective positions referred to weld centreline (yTC1 and yTC2) were measured over each sample after welding joints were made. The minor differences between these positions difficult the direct comparison of them, considering the high temperature gradient that take place. Despite that, in general, it was appreciated the fact that maximum temperatures decrease with U for a certain w and increases with w for a certain U, consistently with reported results.1 As it has been described on previous section, power (QNet) and heat input (HNet) net values were obtained from the position and peak temperature of each thermocouple, using a FEM heat transfer model. QNet obtained values were between 322 and 391 W. In general, there was not a significant variation, but it shows a slightly increase with w, accordingly with the higher peak temperatures.20 It was not observed a clear tendency with U, consistently with the results found in previous works, where it had been found that net power can be considered nearly independent of U.7,17,20 HNet varied between 132 and 282J/mm, decreasing with U and showing a slight increment with w.6,21
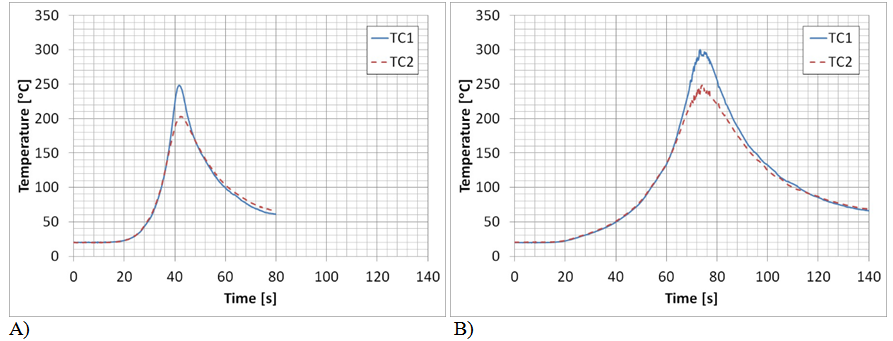
Figure 3 Acquired thermal cycles for extreme pitch values: A) Pitch 4.7 (680-146), B) Pitch 12.4 (903-73).
Consumed electrical power and axial load
Consumed electrical power were calculated from the current measured values using the expression which corresponds to an asynchronous three-phase motor, which is shown in Equation 2, where line tension (VL) was 380 V, line current (IL) was the acquired current and power factor (cos j) was considered 0.77.22
(2)
In Figure 4 are shown the values of consumed electrical power (P) and axial load (F0) against time for the extreme conditions of pitch number (4.7 and 12.4). To ease the comparison between both process variables, consumed power does not include the base power (P0) associated to unloaded condition. At the beginning of the welding, during the tool insertion, it was observed that P and F rise quickly presenting one or two peaks associated to contact of tool pin and shoulder with the sample surface. After these peaks, in general it was observed a drop in both records, due to material softening caused by heat generation and temperature increase.23 At first stage, it can be appreciated certain differences between different welding conditions, which were associated to the tool indentation. Later, it was observed that in general P decreased monotonically during the process time, whereas F increased until it reached a maximum value. The decrease of P could be associated to the material flow stress decrease, whereas the increase of the F could be related to the sample dilatation, both caused by the temperature increase. At last, at the end of the welding process, tool is located increasingly near to the sample edge, so that heat diffusion capacity decrease, resulting on a temperature increase.17 This causes a decrease in material tension flow in a greater degree, as much as the tools shoulder capacity to contain material plastic flow, taking place an increase of the flash and a decrease of P and F.23 Similar axial load records during FSW in aluminium alloys had been found in literature.3,5,23,24 It had been reported a slow decrease of total torque measured during FSW,3,5 which can be related to the electrical current consumed. Schmidt et al.5 proposed that the lack of proportionality between both records could be associated to the presence of a sticking component in the heat generation.5 Furthermore, the change in this proportion could imply a change in contact condition during welding. After tool insertion, P values had been found generally between 1 and 2.5kW, whereas maximum F values varied between 6.4 and 8.2kN. Mean consumed electrical power (̄P̅) was obtained directly from temporal integration of the consumed electrical power (P), divided by the total integration time. The mean generated power for pure sliding condition (Q̅Slidingd=0) is computed in the same way, but it was necessary to calculate the instant values of this power from the axial load (F) records using the expression of the generated sliding power (QSliding) shown in Equation 3, which arises from heat generation analytical model presented in Section 1.
(3)
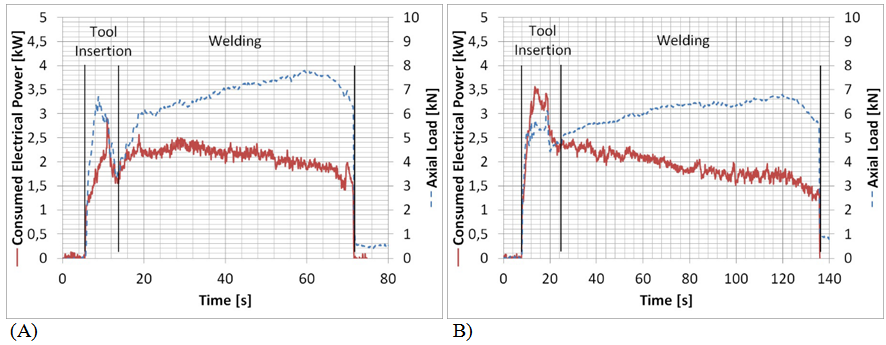
Figure 4 Consumed electrical power and axial load records for extreme pitch values: A) Pitch 4.7 (680-146), B) Pitch 12.4 (903-73).
On this expression, mean contact pressure (p) is calculated as the ratio between axial load (F) and the projected tool shoulder area.3,5 Concerning friction coefficient (m), in bibliography can be found a wide range of values used in FSW heat generation models, depending on relative displacement velocity, pressure and temperature.3,25 In this work, it was used a coefficient of 0.1. Finally, the mean power values ̄P̅ and Q̅Slidingd=0 were divided by travel speed to calculate consumed electrical energy (E) and generated heat for pure sliding (HSlidingd=0), respectively. In Table 3 these characteristic values obtained from the consumed power and axial load records are shown. The calculation of the P̅ was made considering the tool insertion part of the records. The differences observed in the calculated values without considering this tool insertion period were less than 5%, therefore, the adopted criterion has a minor effect in the analysis. E values were in a range between 830 and 1640 J/mm, whereas HSlidingd=0 varied between 91 and 223J/mm. Like HNet, these two process variables decreased with U, whereas they increase for higher w.
Heat generation mechanisms
Figure 5 shows the variation of consumed electrical energy (E) and net heat input (HNet) with the pitch number. It can be appreciated that E was significantly greater than HNet, due to the different energy losses mentioned schematically in Figure 1. The observed difference between both magnitudes can be associated to the total process efficiency (hTotal). Also, it is observed that both parameters have increased with pitch number, showing a good correlation with a linear tendency, consistently with bibliography.1,20 This proportionality can be associated to the fact that WTotal is equal to the product between total torque and pitch number (Figure 1). Thus, a null origin of coordinates was imposed to the obtained linear correlations. From these tendency lines a value for hTotal can be obtained by the ratio between both slopes, which results in 18 %. This value is particularly for the equipment used in this work and could be strongly dependent of the mechanical efficiency of the machine used.
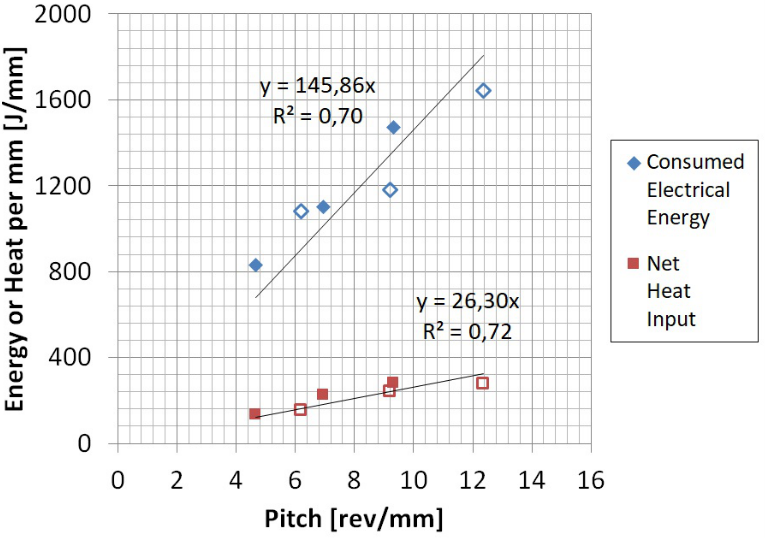
Figure 5 Consumed electrical energy (E) and net heat input (HNet) vs. pitch number. Note: Full markers corresponds to w = 680rpm and empty ones to w = 903rpm.
As mentioned before, thermal efficiency (hT) is found commonly between 0.7 and 0.9.3 Considering a hT of 0.8, HTotal can be obtained from the HNet. HSlidingd=0 also present a linear tendency with pitch number, showing a good agreement (Figure 6). The generated sticking power (QSticking) shown in Equation 4 can be computed considering a mechanical efficiency (h) of 0.9 and a yield stress (sy) of 30MPa associated to a representative condition in the stirred zone for all analysed welding parameters.3,26
(4)
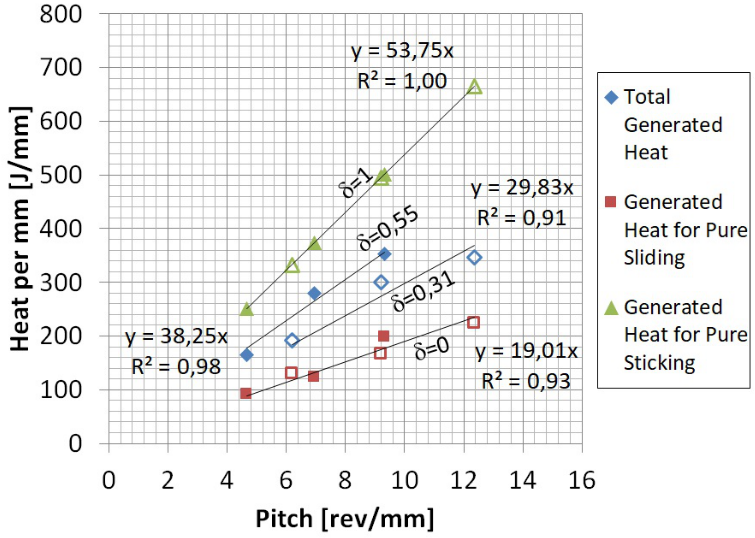
Figure 6 Total generated heat (HTotal), generated heat for pure sliding (HSlidingd=0) and generated heat for pure sticking (HStikingd=1) vs. pitch number. Note: Full markers corresponds to w = 680 rpm and empty ones to w = 903 rpm.
Finally, generated heat for pure sticking (HStikingd=1) was calculated from Q Sticking. Hence, it was obtained a linear regression with a correlation coefficient of 1 because this heat was not obtained from experimental values (Figure 6). HTotal is equal to the sum of HSticking and HSliding, as observed in Equation 5.
(5)
This equation also shows that limit values for HTotal are the HSlidingd=0 and HStikingd=1. This aspect can also be appreciated in Figure 6, where obtained values of HTotal were located in an intermediate zone between both limit values. Furthermore, the proximity of HTotal with each one of the limit values is associated with sticking rate (d), which can be calculated from correlations of Figure 6 and Equation 5. Obtained d values were 0.55 and 0.31 for w of 680 and 903rpm, respectively. This result indicates that for lower w a contact condition nearer to pure sticking was obtained, which produced a higher HTotal. This d variation with w is consistent with bibliography and is considered by several authors for the development of FSW models.7–9,20 The developed analysis can be applied to different welding conditions and materials, reaching a deeper understanding of the heat generation mechanisms acting in FSW process for each case. From the expressions obtained in Figure 6 and considering the d values can be calculated HSticking and HSliding for each w, and its variation with the pitch number is shown in Figure 7.

Figure 7 Total generated heat (HTotal), sliding generated heat (HSliding) and sticking generated heat (HSticking) variations with pitch number: a. 680 rpm, b. 903 rpm.
It can be observed that for both cases HSticking was greater than HSliding, although contact condition was closer to pure sliding for 903rpm.16 This result shows that a contact condition closer to pure sliding (903rpm) do not imply that the sliding heat is greater than sticking heat, which is because HSlidingd=0 is the lower limit for HTotal. This fact indicates that the main heat generation mechanism in FSW is in general sticking, associated to the plastic deformation of the material. The slopes of the linear correlations obtained in Figure 6, are associated with torque values for each w, (expressed in J/rev, which means Nm/(2p)). This imply that torque does not vary significantly with U, accordingly with bibliography.7,14,20,27 In this way, both sliding torque (TSliding) and sticking torque (TSticking) can be calculated from the expressions of the Figure 7. TSliding equals the slope of the HSliding correlation, which was 1.4 and 2.1Nm for 680 and 903 rpm, respectively. For the sticking component, must be considered the mechanical efficiency (h) of 0.9, so that TSticking resulted to be 5.3 and 3.0Nm for 680 and 903 rpm, respectively. As it was expected, the torque components presented the same behaviour as heat components. Even though a decrease in w produced a decrease in sticking component and an increase in sliding component, the TSticking was greater that TSliding in both cases, although contact condition was closer to pure sliding for 903rpm. Total torque (TTotal) was obtained by the sum of both torque components, which resulted to be 6.6 and 5.0 Nm for 680 and 903 rpm, respectively. Values of TTotal, TSliding and TSticking were of the same order of those reported by other authors for similar welded joints.8 TTotal decreases with w, accordingly with the bibliography.4,7,9,13,14,20,27 Other authors proposed that this decrease could be associated to the fact that the material can flow easier at higher temperatures.7,20 Although an effect of temperature exists on material flow stress, it does not explain completely the involved phenomena since in Figure 6 it can be observed that for a same w, the generated heat increases with a decrease in U, without a significant variation in TTotal. Furthermore, some authors have suggested that the increase of w produces a strain rate increase that improves the material flow.7,20 However, in agreement with different models used for this material, that increase in the strain rate produces an increase in flow stress.28 Instead, the analytical model used in this work, that do not consider the variation of the material flow stress with temperature and strain rate, shows that the decrease in TTotal with the w can only be associated to the decrease in w. Therefore, it can be concluded that the mentioned decrease is mainly due to the decrease of the w, i. e., the change in contact condition at the tool-workpiece interface.
Finally, it was possible to obtain the exclusive FSW process efficiency (hFSW), calculating the ratio between HNet and WTotal at the tool and it resulted 75%, showing a small variation with the contact condition. The hFSW depends on hT and h, which are took from bibliography, but it is not possible to obtain the hFSW directly from them because h only affects the HSticking. The value of hFSW is around the obtained experimentally from TTotal measurements by Gallais et al., which had resulted to be 60%.12 Then, since the total process efficiency (hTotal) equals the product between hFSW and the machine efficiency (hMach), it was possible to calculate the last one, which resulted 24 %. The hMach was considerably lower and similar to hTotal, in comparison with hT and h. This result indicates that low hTotal obtained previously is associated to hMach. As it was mentioned before, the hMach depends on the equipment employed, which will be possibly higher for machines with advanced technology than the one used for this work, so that E could be lower. In the future is expected to be able to measure TTotal at the tool to improve the obtained results and go further into experimental analysis about energetic balance of FSW process.
Material flow
Cross sections macrographs of the welding joints are shown in Figure 8, indicating the calculated WNA for each case. Defect free and full penetration joints were obtained for all welding conditions. A defect free WN indicates that an adequate material flow is achieved during the welding process. Changes in the shape and size of the WN with the w and U can be appreciated. The material flow in the WN is composed by two flows, one related with the tool shoulder action (upper zone and wider) and other with the tool pin one (lower central zone and narrower).29 These variations in the WN were observed in both zones, thus the components of sticking and sliding would affect both types of material flow. For the lower U, the shape is smoother, and the size is bigger, which are related with a higher volume of stirred material. An increase in U, generates a sharper and smaller WN, especially for 903rpm. Figure 9A shows the welding nugget area (WNA) vs. pitch. The WNA rises linearly with the pitch number for the same w (or d), similarly to the observed for the HTotal vs pitch (Figure 6). This behaviour is related to the fact that a decrease in U produces an increase in HTotal, which implies that a higher volume of material achieves an adequate temperature to flow properly, without affecting the capability of the tool of driving the material flow associated to the d and w, resulting in a higher WNA. On the other hand, an increase in w produces a slight increment in HTotal with a decrease in d, which produces an increase in the extent of sliding at the tool-work piece interface, reducing the capability of the tool of driving the material flow and consequently the size of the WN. Therefore, it can be said that the material flow depends on HTotal, w and d. HSticking is related with these three magnitudes. Figure 9B. Shows that WNA has a direct relation with HSticking for all the welding conditions. This behaviour implies that the selection of welding parameters in FSW to obtain sound welds should consider the extent of HSticking which improves the material flow during welding, according with Arora et al. proposal of maximize the sticking torque to enhance the material flow.8
The authors acknowledge to Universidad de Buenos Aires, Agencia Nacional de Promoción Científica y Tecnológica (ANPCYT) and Instituto Nacional de Tecnología Industrial for the funding and the facilities in order to develop this work and also to the personnel of Instituto de Tecnologías y Ciencias de la Ingeniería and Centro de Investigación y Desarrollo en Mecánica for its collaboration.
The authors declare that there is no conflict of interest.

©2021 Tufaro, et al. This is an open access article distributed under the terms of the, which permits unrestricted use, distribution, and build upon your work non-commercially.