MOJ
eISSN: 2379-6294


Research Article Volume 2 Issue 3
1Department of Biological Sciences, North Carolina State University, USA
2State Key Laboratory of Environmental Criteria and Risk Assessment, Chinese Research Academy of Environment Sciences, China
Correspondence: Gerald A LeBlanc, Department of Biological Sciences, North Carolina State University, Raleigh, North Carolina, USA, Tel 9195 1574 04, Fax 9195 1574 04
Received: July 29, 2016 | Published: December 16, 2016
Citation: Wang W, Kwon G, An, et al. Differential interactions of the flame retardant triphenyl phosphate within the PPAR signaling network. MOJ Toxicol. 2016;2(3):67–74. DOI: 10.15406/mojt.2016.02.00039
Triphenyl phosphate is an organophosphate flame retardant and plasticizer that has been detected in a variety of environmental media and shown to cause weight gain in rats. We hypothesized that triphenyl phosphate would modify the activity of the PPAR: RXR signalling network in a manner that would favor lipid accumulation. Gal4-driven luciferase-based transcription reporter gene assays were used to evaluate the responses of human PPARα: RXRα, PPARγ: RXRα, and the individual receptor subunits, to triphenyl phosphate. Triphenyl phosphate was a potent inhibitor of PPARα: RXRα signalling. The flame retardant interacted with both the PPARα and RXRα subunits to inhibit their respective activities at concentrations that were not overtly toxic to the cells. Bioluminescence resonance energy transfer experiments revealed that triphenyl phosphate actually inhibited the dimerization of PPARα and RXRα. In contrast, triphenyl phosphate modestly activated the PPARγ: RXRα receptor complex. This net activation of the complex was due to strong activation of the PPARγ receptor subunit and modest inhibition of the RXRα subunit. Further experiments revealed that triphenyl phosphate stimulated pre-adipocyte differentiation to lipid-laden adipocytes at a concentration that disrupted the PPAR signalling network. This dual activity of triphenyl phosphate, as an inhibitor of PPARα: RXRα signalling and an activator of PPARγ: RXRα signalling provides a regulatory scenario that could lead to weight gain and other symptoms of metabolic syndrome.
Keywords: triphenyl phosphate, PPAR, metabolic syndrome, weight gain
Organophosphate flame retardants are increasing in commercial use with the banning of brominated flame retardants.1 Some organophosphate flame retardants are also used as plasticizers.1 Triphenyl phosphate is an organophosphate flame retardant that is used in applications such as polyurethane foams used in residential furniture.2 Triphenyl phosphate has been detected in house dust (<1700 ug/g),3,4 air (<200 ng/m3),5 and biota (<770 ng/g).6 Accordingly, the potential for human exposure to triphenyl phosphate is significant, and it has been detected in human milk (<11 ng/g).6 Triphenyl phosphate is considered to be of low concern with respect to reproductive, developmental, and systemic toxicity to mammals.7 However, several studies have implicated this compound in interacting with nuclear receptors or steroidogenic enzymes.8-10 Recently, triphenyl phosphate was reported to activate the peroxisome proliferator activated receptor gamma (PPARγ) signalling pathway.11 PPARγ signalling stimulates pre-adipocyte differentiation and lipid accumulation.12,13 Thus, this molecular activity could be responsible for the observed obesogenic activity associated with feeding of a triphenyl phosphate-containing flame retardant to rats.14 Indeed, triphenyl phosphate exposure stimulated lipid accumulation in cultured murine bone marrow stromally derived adipocytes (BMS2).11 The PPAR signalling network is comprised of several ligand-activated nuclear receptor proteins. Three isoforms of PPAR contribute to the regulation of various aspects of energy homeostasis.15 The PPAR proteins dimerize with the retinoid X receptors (RXR) to form active transcription factors.16 RXRs are also ligand-activated and ligand occupancy on either the PPAR or the RXR subunit can result in activation of the complex.17 Thus occupancy of the PPARγ protein by triphenyl phosphate would specifically activate PPARγ-regulated processes (e.g. increased insulin sensitivity, adiposeness and lipid accumulation,17 whereas, activation of the PPARγ: RXR receptor complex by binding to the RXR subunit would likely result in the activation of all PPAR isoforms receptor complexes, as well as, other RXR-containing signaling pathways resulting in pleiotropic consequences. In the present study we tested the hypothesis that triphenyl phosphate elicits multiple effects on the PPAR signalling network through interactions with human PPARα, PPARγ, and RXRα. Further, we utilized bioluminescence resonance energy transfer (BRET) to decipher the impacts of triphenyl phosphate binding on subunit dimerization along with recruitment of steroid receptor co-activator 1 (SRC1) to the receptor complex. Finally, we evaluated the ability of triphenyl phosphate to stimulate pre-adipocyte differentiation to adipocytes at levels that impacted the PPAR signalling network. Results revealed complex interactions of triphenyl phosphate on the PPAR signalling network which could be used to infer outcomes of triphenyl phosphate exposure on lipid/glucose metabolism and other physiological processes.
Plasmids and chemicals
The plasmids containing the human gal4-RXRαfusion construct (pBIND-gal4-hRXRα(DEF)) and the pG5-luc reporter gene under the control of the gal4 response element were previously described [18]. The pcDNA-RLuc2 plasmid was a gift from Dr. Sanjiv Gambhir (Stanford University, Stanford, California). Plasmids containing human PPARα (pcDNA-hPPARα (ORF)) and PPARγ (pcDNA-hPPARγ (ORF) were generously provided by Dr. Jeffrey Peters (Pennsylvania State University, University Park, PA). pcDNA3.1(-) and pRL-CMV plasmids were provided by Dr. Seth Kullman (North Carolina State University, Raleigh, NC). Both pEBFP2-nuc and pBAD-mAmetrine1.1 were purchased from Addgene (www.addgene.org; Addgene plasmids 14893 and 18084). 9-cis Retinoic acid, clofibrate, rosiglitazone, oleic acid, insulin, and triphenyl phosphate were obtained from Sigma-Aldrich (www.sigmaaldrich.com).
RXRα-Rluc2 construct
PBIND-gal4-hRXRα (DEF) was used as the source of RXRαfused to the gal4 DNA binding domain for use in transcription reporter gene assays as we have described previously.18 This plasmid also was used as the source of RXRα for the preparation of fusions to Renilla luciferase 2 (Rluc2). Rluc2 served as the photon source (emission: 410 nm) for the detection of fluorescent protein-fused PPAR, PPARγ, or SRC1 during BRET assays. Amplified gal4-hRXRα (DEF) fragments were digested with Nhe I and cloned into the pcDNA-RLuc2 plasmid. This plasmid contains Renilla luciferase (RLuc) with 2 mutations at C124A and M185V (RLuc2).19 A 21 base pair linker was added between gal4-RXRα (DEF) and RLuc2 to facilitate independent flexibility of the fused proteins. Antarctic Phosphatase (New England Biolabs, www.neb.com) was used to catalyze the removal of 5´ phosphate from the pcDNA-RLuc2 plasmid to decrease the possibility of plasmid self-ligation. The chimeric construct was designated as pcDNA-gal4-hRXRα (DEF)-RLuc2. The final construct was verified by sequencing.
PPARα-EBFP2 and PPARγ-EBFP2 constructs
PPAR was fused to the fluorophoreEnhanced Blue Fluorescent Protein 2 (EBFP2; excitation: 410 nm, emission: 475 nm) to assess dimerization with RXRα-Rluc2 using BRET. PCR fragments of the PPARα and PPARγ open reading frame (ORF) without a stop codon were amplified from the parent plasmid using primers harboring ApaI/BamHI or NheI/XhoI restriction enzyme sites respectively, and subcloned into the pcDNA3.1(-) plasmid. EBFP2 was amplified out of its parent plasmid (pEBFP2-nuc) with a stop codon and a 30 base-pair linker at its 5’ end. The EBFP2 was fused to the 3’ end of PPARα or PPARγ at a BamHI or XhoI restriction enzyme fusion site, respectively. These constructs were named pcDNA-hPPARα-EBFP2 and pcDNA-hPPARγ-EBFP2. Linkers were placed between the PPAR and EBFP2 sequences to provide independent flexibility of the fused proteins. Final constructs were verified by sequencing. Preliminary experiments revealed that the fusion of EBFP2 to the 3’ end of the PPARs provided the optimum BRET signal.
SRC1-mAmetrine Construct
The full frame of SRC1 isoform E used in this study wasconstructed from the 5’ region of SRC1 derived from the pSG5-SRC1A-ORF plasmid (provided by Dr. Seth Kullman, North Carolina State University, Raleigh, NC) and the 3’ portion of SRC1E (representing amino acids 381-1399) derived from pSG5-SRC1E (S. Kullman). Splice variations at the 3’ end of these mRNAs have been shown to render SRC1A much less effective than SRC1E as a co-activator.20,21 Therefore, the 3’ end of the SRC1A open reading frame was replaced with that derived from SRC1E. The SRC1E ORF was created by fusion PCR. The 5’ portion of SRC1A was amplified using the primers: forward: 5’-CGTGCTGGTTATTGTGCTGT-3’; reverse: 5’-CTTCCGGGTGAGCATCCGAAACT TCCT-3’. The 3’ portion of SRC1E was amplified using the primers: forward: 5’-AAGTTTCGG ATGCTCACCCGGAAGTCA-3’; reverse: 5’-ATTGATGAGTTTGGACAAACCAC-3’. A twenty four base pair overlap was used to conjoin the two PCR products. The resulting final PCR product was purified and amplified using the primers, forward: 5’-ATGAGTGGCCTTGGGGACAGTTC-3’ and reverse: 5’-CTAGTCTGTAGTCACCACAGAGAAGAACTC-3’ primers at 60.5˚C annealing temperature using the Advantage HF 2 PCR kit (Clontech) to give a 4kb PCR product. Restriction sites ApaI/AflII were added to the final PCR product for cloning by PCR using the 4kb product as template with the forward primer: 5’-TACTATGGGCCCACCATGAGTGGCCTTGGGGACAGTTC-3’ and reverse primer: 5’-TACTATCTTAAGCTAGTCTGTAGTCACCACAGAG-3’. The amplified SRC1E ORF was subcloned into ApaI/AflII sites of pcDNA3.1 (-) plasmid and named as pcDNA3.1-hSRC1E. SRC1E was fused to the fluorescent protein mAmetrine (excitation: 410 nm, emission: 535 nm) to assess recruitment of SRC1 to the RXRα: PPAR dimers using BRET. The fusion construct of SRC1 and mAmetrine was created as described for the PPARs and EBFP2. SRC1 ORF fragments were amplified by PCR from the pcDNA3.1-hSRC1E plasmid using primers with KpnI/AflII enzyme sites and then subcloned into the pcDNA3.1 (-) plasmid. The mAmetrine PCR fragment without a stop codon but with a 30 base pair linker was ligated in-frame to the XhoI/KpnI sites at 5’ end of SRC1 to generate pcDNA-mAmetrine-SRC1. The final construct was verified by sequencing. Preliminary experiments revealed that the fusion of mAmetrine to the 5’ end of SRC1 provided the optimum BRET signal.
PPARα-gal4 and PPARγ-gal4 constructs
The human PPARαand PPARγligandbinding domains with a stop codon was amplified from pcDNA-PPAR α or pcDNA-PPARγ using the primers harboring SalI and KpnI restriction enzymes sites. Digested PCR product was then inserted at the 3’ end of the gal4 DNA binding domain in the pBIND plasmid by SalI/KpnI restriction sites. The constructs were named pBIND-gal4-hPPARα and named pBIND-gal4-hPPARγ. The final construct was verified by sequencing.
Reporter gene transcription assays
Reporter gene assays were used to evaluate the ability of triphenyl phosphate to modulate the PPAR signalling network. HepG2 cells, cultured in MEM supplemented with 10% FBS, were plated at a density of 25,000 cells per well in 96 well plates. The next day, 25 ng of the relevant plasmids containing the fusion constructs were co-transfected with 125 ng of pG5-luc, 6 ng of pRL-CMV, and 25 ng of pcDNA-mAmetrine-SRC1 using TransIT-LT1 (Mirus) reagent following the manufacturer's protocol. When assessing heterodimer activities, the transfected plasmids were pBIND-gal4-RXRα (DEF) along with pcDNA-PPARα-EBFP2 or pcDNA-PPARγ-EBFP2. When assessing reporter gene activation by individual receptor subunits, the plasmids transfected were pBIND-gal4-hRXRα (DEF), pBIND-gal4-hPPARα, or pBIND-gal4-hPPARγ. Empty plasmid was transfected to keep the amount of plasmid transfected into the cells constant. The next day, the medium in plates was replaced with serum-free medium containing triphenyl phosphate or other ligands (i.e. positive controls) at the desired concentrations. DMSO was used as a solvent carrier for all ligands and kept constant among all treatments and controls (0.1%, v/v). After 24 hours of incubation, firefly and Renilla luciferase were measured using Dual-Glo luciferase assay system (Promega, www.promega.com) using a FLUOstar Omega microplate reader (BMG Labtech). Firefly luciferase values were normalized to the Renillaluciferase values. Positive controls (9-cis retinoic acid for RXRα, clofibrate for PPARα, and rosiglitazone for PPAR) were routinely evaluated to ensure proper assay function.
BRET assays
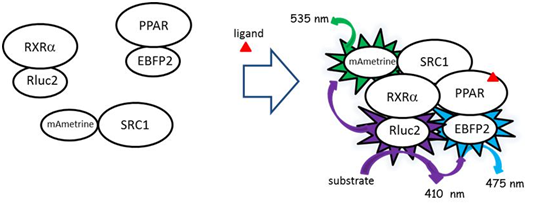
Bioluminescence resonance energy transfer (BRET) assays were used to assess ligand-dependent dimerization of the PPAR subunits with RXRα and to assess recruitment of the co-activator SRC1 to the receptor complex. The fusion construct gal4-RXR α (DEF)-Rluc2 served as the photon donor during BRET assays. PPAR subunits (α and γ), fused to EBFP2, and SRC1 fused to mAmetrine served as the fluorophore during BRET assays (Figure 1). BRET assays were performed in HepG2 cells obtained from ATCC® (www.ATCC.org) and cultured in minimum essential medium (MEM) supplemented with 10% fetal bovine serum (FBS). Cells (500,000) were plated in each well in 6-well plates. The next day, the plasmids containing the gene constructs were transfected into the cells using TransIT-LT1 (Mirus) following the manufacturer's protocol. Typically, 230 ng of plasmid containing the photon source and 1,380 ng of the plasmids containing the fluorophores were transfected. Cells were trypsinized after 24 hrs and pelleted at 1,500g for 2 minutes. Cells were then suspended in phosphate-buffered saline (PBS) and transferred to 96-well plates where cells were incubated with triphenyl phosphate or other ligands for 20 minutes at 37C. Coelenterazine 400a (DeepBlueC, Biotium, www.biotium.com) in PBS was added at a final concentration of 5 µM to each wells which served as the luminescent substrate for the Rluc2. Photon emissions were measured immediately on a FLUOstar Omega microplate reader (BMG Labtech, www.bmglabtech.com) with 3 filter settings (Rluc2, 410 ± 40nm; EBFP2 filter, 475 ± 15nm; mAmetrine filter, 535 ± 15nm). Dimerization of RXRα and the PPARs was detected as the BRET ratio by measuring the light emitted by the fluorophore (475 nm) divided by the light emitted by the donor protein (410 nm) with corrections for background fluorescence (using cells that were not transfected with the fusion proteins) and contaminating emissions from the donor into the acceptor’s emission wavelength (475nm). This latter correction factor was derived by measuring fluorescence at 475 nm in cells transfected with Rluc2-RXRα alone minus the fluorescence measured with untransfected cells at 475 nm divided by the fluorescence of Rluc2-RXRα alone at 410 nm minus the fluorescence of untransfected cells at 410 nm. Recruitment of SRC1 was determined using this same procedure with BRET ratios determined using the fluorophore emission at 535 nm.
Cytotoxicity and metabolic viability
HepG2 cells were trypsinized and plated at adensity of 10,000 cells per well in white opaque 96-well plates using MEM supplemented with 10% FBS. Next day, cells were treated with concentrations of triphenyl phosphate in serum free medium for 24 hours at 37C. Triphenyl phosphate was delivered to the wells dissolved in DMSO which was present in all wells, including controls, at a concentration of 0.1% v/v. Cellular toxicity was measured using the CellTox™ Green Cytotoxicity Assay (Promega, www.promega.com) following manufacturer’s protocol. This assay functions on the premise that living cells cannot take-up a cyanine dye; while, the dye traverses the compromised membrane of dead cells, binds to DNA, and fluoresces at 485 nm excitation/520 nm emission. Fluorescence was measured on a FLUOstar Omega microplate reader (BMG Labtech). Immediately following these assays, cells were evaluated for metabolic viability using the CellTiter-Glo® 2.0 Assay (Promega) following manufacturer’s protocol. This assay is designed to measure cellular ATP levels by luminescence. Luminescence was measured on a FLUOstar Omega microplate reader (BMG Labtech).
Pre-adipocyte differentiation assays
Mouse 3T3- L1 cells (ATCC) were seeded at adensity of 70,000 cells in 35 mm (diameter) petri dishes along with 2.0 ml of high glucose (4.5 g/l) Dulbecco’s Modified Eagle Medium (DMEM) with 10% FBS and allowed to reach confluence. Two days after reaching confluence (day 0), cells were treated with either 10 µM triphenyl phosphate, 2.0 µM rosiglitazone (positive control), or 0.10% DMSO (negative control). On days 2 and 4, the medium was renewed with the same concentrations of the test materials along with 10 µg/ml insulin. On day 6, cells were rinsed twice with PBS, fixed with 3.7% formalin for 60 min at room temperature, and then rinsed twice with PBS. Isopropanol (60%) was the added to each dish. After 5 min, the isopropanol was removed and cells were stained with freshly diluted Oil Red O solution (3 mg Oil Red O/ml isopropanol, diluted to 3 parts of Oil Red O stock solution to 2 parts deionized water and allowed to remain at room temperature for 10 min prior to use) for 60 min with gentle agitation. Excess stain was then removed with 60% ethanol and cells were rinsed 3-times with distilled water. Cells were imaged at 10X magnification using an Olympus microscope. Each treatment was replicated 3-times per experiment. Images presented are representative of the replicates.
Significant (p<0.05) differences between treatments and controls wereevaluated using One Way ANOVA accompanied by Turkey’s test. Homogeneity of the variances was confirmed by Levenes’s test. All assays were performed with three true replicates.
Modulation of PPARα signalling
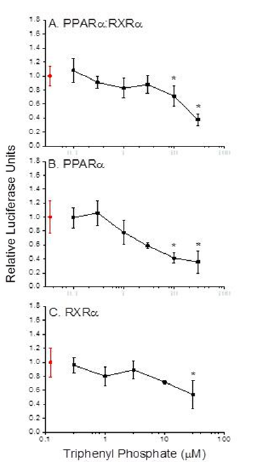
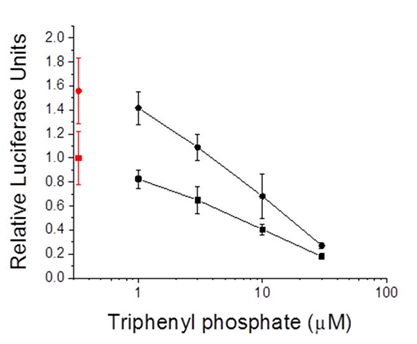
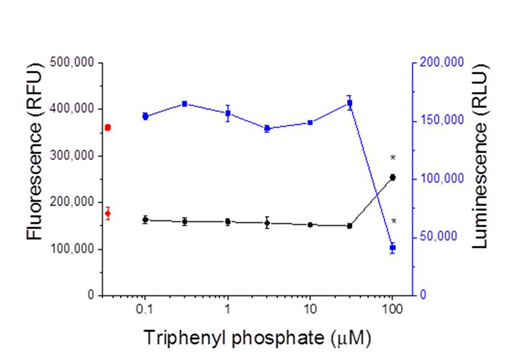
Transcription reporter assays performed with thehuman PPARα: RXRα receptor revealed that triphenyl phosphate did not activate receptor signalling at the concentrations evaluated (Figure 2A). Rather, triphenyl phosphate inhibited the constitutive activity associated with the receptor with significant (p<0.05) inhibition occurring at 10 and 30 µM. Evaluation of the individual receptor subunits revealed that triphenyl phosphate inhibited activity associated with both the PPARα subunit and RXRα subunit but with greater inhibitory potency towards PPARα (Figures 2B & 2C). As these assays were performed in the absence of receptor-activating ligand, the ability of triphenyl phosphate to inhibit PPARα: RXRα signalling following activation by the natural ligand oleic acid was evaluated. Oleic acid activated the PPARα: RXRα receptor Figure 3 and triphenyl phosphate inhibited oleic acid-activated PPARα: RXRα down to a residual level of activity consistent with that observed in the absence of ligand (Figure 3). Thus, triphenyl phosphate effectively suppresses the ability of PPARα:RXRα to respond to activating ligand. Suppression of the receptor activity suggested that triphenyl phosphate may be toxic to the HepG2 cells at these exposure concentrations. Cell toxicity and metabolic viability assays both established that triphenyl phosphate was nontoxic to the cells at concentrations that inhibited receptor activation (Figure 4). Thus, triphenyl phosphate specifically suppressed the activation of PPARα: RXRα independent of overt adverse effects on the cells.
PPARα receptor assembly
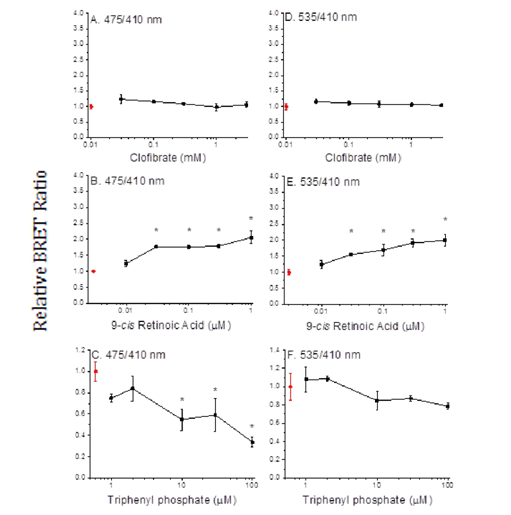
We performed BRET assays with triphenyl phosphate todetermine whether the inhibitory activity of this compound may be due to the prevention of subunit dimerization or the dissociation of constitutive dimers. The PPARα positive control ligand, clofibrate, did not stimulate dimerization of the PPARα and RXRα subunits (Figure 5A) nor did it stimulate SRC1 recruitment (Figure 5D). While, the RXRα positive control ligand, 9-cis retinoic acid, did stimulate subunit dimerization (Figure 5B) and recruitment of SRC1 to the dimer (Figure 5E). In contrast, triphenyl phosphate caused dissociation of the PPARα: RXRα complex (Figure 5C); while having no significant impact on the constitutive association of SRC1 with RXRα. Thus, the inhibitory activity of this compound is consistent with its negative effect on receptor unit dimerization.
Modulation of PPARγ signalling
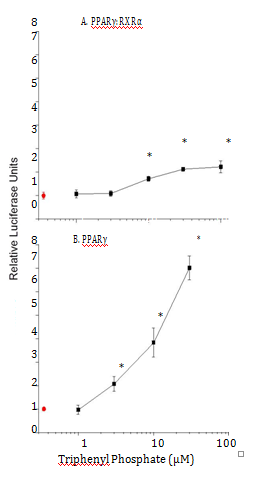
In contrast to the inhibitory effects of triphenylphosphate on PPARα: RXRα signalling activity, this compound exhibited modest activation of the PPARγ: RXRα receptor complex (Figure 6A) Evaluation of the interactions of triphenylsphate. With the PPARγ receptor subunit established that this compound significantly activates this protein (Figure 6B). The dual interaction of triphenyl phosphate with the PPARγ subunit (activation, Figure 6B) and the RXRα subunit (inhibition, Figure 3C) appears to result in the net modest activation of the PPAR γ: RXRα receptor complex (Figure 6A).
PPARγ receptor assembly
BRET assays performed with the known PPARγagonistrosiglitazone and the known RXRα agonist 9-cis retinoic acid revealed that the PPARγ agonist did not stimulate receptor assembly (Figures 7A & 7D) while the RXRα agonist did stimulate receptor assembly (Figures 7B & 7E). Triphenyl phosphate had no effect on PPARγ receptor complex assembly (Figures 7C & 7F), suggesting that triphenyl phosphate activates constitutively present PPARγ: RXRα dimers.

Pre-adipocyte differentiation
Theobserved alterations in PPAR network signaling would be expected to decrease the utilization of lipids and increase their storage. Indeed, exposure of mouse 3T3-L1pre-adipocytes to 10 µM triphenyl phosphate or 2.0 µM rosiglitazone (positive control) resulted in increased differentiation of the cells from an elongated fibroblast-like appearance to globular, lipid-laden adipocytes (Figure 8).
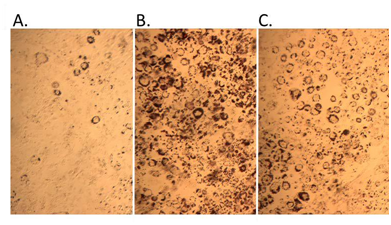
Figure 8 Pre-adipocyte differentiation and lipid accumulation with triphenyl phosphate treatment. A. control, B. 2 µM rosiglitazone (positive control), C. 10 µM triphenyl phosphate.
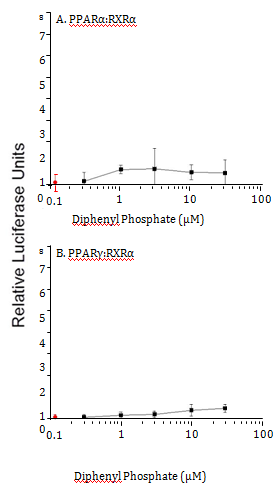
Figure 9 Gal4-driven luciferase reporter gene activity following treatment of cells with diphenyl phosphate. A. Activity associated with the PPARα:RXRα-gal4 heterodimer. B. Activity associated with the PPARγ:RXRγ-gal4 heterodimer. Control (0 µM diphenyl phosphate) values are presented in red. Data are presented as the mean and standard deviation (n=3) and are normalized to the control values.
Reporter gene activation by diphenyl phosphate
Diphenyl phosphate is the major hepatic metabolite of triphenyl phosphate. Therefore, the ability of this compound to modulate the PPAR signaling network was evaluated. Diphenyl phosphate had no effect on the activity of PPARα:RXRα or PPARγ:RXRα complexes (Figure 9).
The triphenyl phosphate-containing flame retardant Firemaster 550 has been implicated in metabolic dysfunction in a rodent model resulting in weight gain.14 Results of the present study demonstrate that triphenyl phosphate interacts with several transcription factors that regulate lipid and glucose storage and metabolism. Further, the effects of this compound are differential, resulting in the activation of some regulatory processes and inhibition of others. Notably, triphenyl phosphate is an inhibitor of RXRα regulatory activity. RXRα serves as a dimerization partner to several nuclear receptors that are involved in energy homeostasis; and, ligand-binding to RXRα results in the activation of these dimeric nuclear receptors.16 Responsive partners include the farnesoid X receptor (FXR), constitutive androstane receptor (CAR), the pregnane X receptor (PXR), the liver X receptor (LXR), and the focus of the present study, the peroxisome proliferator activated receptor (PPAR).16 Adverse outcomes from the inhibition of RXRα might include elevated bile acid levels22 resulting in colon cancer.23 (FXR inhibition), increased cholesterol accumulation and associated risk of cardiovascular disease24 (LXR inhibition), lipid accumulation and insulin resistance25,26 (CAR, PPAR inhibition). Interestingly, these conditions are all associated with metabolic syndrome.17-27
The effects of triphenyl phosphate on PPAR signaling are compounded by its ability to interact with both the RXRα subunit and the PPAR subunits. This dual activity is reminiscent of the activity of the obesogenic organotins.28,29 However, unlike the organotins, which activate RXRα, PPARα, and PPARγ subunits,28-31 triphenyl phosphate activates the PPARγ subunit but its interaction with RXRα and PPARα result in inhibition, not activation. The net effect of these multiple interactions would be an enhancement of PPARγ-regulated processes and a suppression of PPARα regulated processes.
Evidence indicates that triphenyl phosphate-bound RXRα attenuates the activation of the PPARγ subunit. In the present study, the PPARγ subunit was activated approximately 7-fold by triphenyl phosphate, but when associated with RXRα, activation was only ~2 -fold. Belcher et al.9 observed a 20-fold activation of PPARγ using a commercial reporter assay that apparently does not include RXRα. However, Pillai et al.11 observed a ~2-fold activation using a system that utilized both PPARγ and RXRα. Taken together, results from these studies suggest that activity of the PPARγ: RXRα heterodimer is dominated by the action of ligand with the PPARγ subunit, while ligand interaction with the RXR subunit can modify this activity.
Belcher et al.9 evaluated the toxicity of triphenyl phosphate in Chinese hamster ovary cells and D283 Med cells. They observed evidence of toxicity, after 24-hours exposure, at concentrations as low as 3 µM with an IC50 in Hamster ovary cells of 37µM. Cellular toxicity is normally evident in our BRET assays as a reduction in the signal associated with the Rluc2 fused to RXR. These assays provided no evidence of toxicity to the HepG2 cells although exposure durations in this assay are short (20 min). Therefore, we performed two assays for cellular toxicity following exposure of HepG2 cells to triphenyl phosphate for 24 hours. These assays utilized the retention of membrane integrity and metabolic activity as indicators to cellular toxicity. These assays confirmed that, at concentrations as high as 30 µM, triphenyl phosphate elicited no discernible toxicity to the cells. Our results are consistent with those of Pillai et al.11 who observed no toxicity to BMS2 cells following 24-hours exposure to triphenyl phosphate concentrations as high as 40 µM. Thus, the modulation of PPAR signaling observed in our experiments was not an artifact of toxicity.
BRET analyses revealed that triphenyl phosphate stimulated the dissociation of the PPARα: RXRα dimer while having no effect on the dimerization on PPARγ and RXRα. Accordingly, this dissociative effect of triphenyl phosphate is not likely due to its demonstrated interaction with the RXRα subunit, but rather due to its interaction with the PPARα subunit. This specific effect of triphenyl phosphate on PPARα: RXRα is not likely to be responsible for the inhibitory effect of this compound on the PPARα: RXRα transcription factor since the compound also inhibited activity associated with PPARα modified to function as a monomer. Thus, the binding of triphenyl phosphate to the PPARα subunit inhibits the ability of this protein to trans-activate gene expression and also cripples its ability to dimerize with its RXRα partner.
PPARα and PPARγ function coordinately in the allocation of fuel for the production of energy. PPARγ regulates the expression of genes that function in carbohydrate oxidation in the liver and other tissues while directing lipids towards their storage in adipocytes.32 PPARα suppresses the cellular utilization of glucose as an energy source, and stimulates the liberation of stored lipids along with their oxidation.32,33 Thus the simultaneous activation of PPARγ and the inhibition of PPARα would favor the utilization of glucose as an energy source while enhancing the storage and retention of lipids. Increased adiposity is a hallmark of both PPARα deficiency34 and PPARγ activation.35 We demonstrated in the present study that triphenyl phosphate does indeed stimulate adipocyte differentiation and lipid storage.
Triphenyl phosphate undergoes hepatic hydrolysis to diphenyl phosphate.36 Results from the present study indicate that this compound poses low risk of hazard as related to the modulation of the PPAR signaling network. However despite its metabolism, Jonsson et al.37 reported human plasma triphenyl phosphate concentrations to range from 0.12 to 0.14 µg/g. These analyses reflected levels in plasma samples from only three individuals and we are not aware of any other reports of triphenyl phosphate concentrations in human plasma or blood. However, based upon these analyses, human plasma is estimated to contain approximately 0.4 µM triphenyl phosphate. The lowest triphenyl phosphate concentration that both inhibited the PPARα signalling pathway and stimulated the PPARγ signalling pathway was 10 µM. Since we are presently unaware of the distribution of plasma triphenyl phosphate concentrations present in the human population and where 0.4 µM fits within this distribution, efforts to minimize exposure to this compound seem prudent.
The organophosphate flame retardant, triphenyl phosphate, both inhibits PPARα signaling and activates PPARγ signalling. This dual effect may be responsible for the observation that exposure to this compound causes weight gain in rodents.
None.
The author declares no conflict of interest.

©2016 Wang, et al. This is an open access article distributed under the terms of the, which permits unrestricted use, distribution, and build upon your work non-commercially.