MOJ
eISSN: 2379-6294


Research Article Volume 4 Issue 2
1Department of Chemical Pathology, Chukwuemeka Odumegwu Ojukwu University, Nigeria
2Department of Pharmacology & Therapeutics, University of Nigeria, Nigeria
3Department of Pharmaceutics, University of Nigeria, Nigeria
4Department of Medical Laboratory Sciences, University of Nigeria, Nigeria
5Department of Pharmacognosy and Environmental Medicine, University of Nigeria, Nigeria
6Gombe State Ministry of Health, Nigeria
7Department of Pharmacology & Therapeutics, University of Nigeria, Nigeria
Correspondence: Fred C Otuu, Molecular and Environmental Research Group, Department of Pharmacology & Therapeutics, College of Medicine, University of Nigeria, Enugu Campus, Enugu State, Nigeria, Tel +2347 0324 5422 2
Received: February 07, 2018 | Published: March 14, 2018
Citation: Obi-Ezeani NC, Otuu FC, Onyeanwusi JC, et al. Evaluation of oxidative stress-induced diabetic complications on alloxan-treated hyperglycaemic rats, using some biochemical parameters and histological profiles of three major organs. MOJ Toxicol. 2018;4(2):59–67. DOI: 10.15406/mojt.2018.04.00091
Background: Oxidative Stress evaluation is fast becoming a diagnostic tool in many disease conditions affecting man. This study evaluated oxidative stress on alloxan-induced diabetic rats by measuring serum Gamma-Glutamyl Transferase (GGT). Total Antioxidant Content (TAC), Lipid Profile, Fasting Plasma Glucose, Transaminases (ALT, AST). Methods: 40 albino Wistar rats of both sexes weighing 190±20g were used for this study. The animals were randomly assigned into two groups A and B consisting of twenty rats each. Group A was the control (non-diabetic) group, while Group B was the experimentally-induced diabetic group. The study lasted for five weeks and blood samples were collected at the third and fifth weeks for some biochemical studies. The following biochemical parameters: Fasting Plasma Glucose (FPG) Serum Urea Creatinine, Alanine and Aspartate Transaminases (ALT, AST) Lipid profile, Gamma-Glutamyl Transferase (GGT) and Total Anti-oxidant Content (TAC) were measured according to standard methods. Histological examinations of major organs - heart, kidneys, and liver - were made according to standard methods.
Results: There were significant differences between the groups in the biochemical parameters (p>0.05) and the histological examinations at weeks 3 and 5. The mean serum GGT concentration of the diabetic group at 3 and 5 weeks (4.0±0.2iu/l and 4.4±0.2iu/l respectively) were significantly increased (p<0.001) when compared to the control group 0.8±0.2iu/l and 0.8±0.1iu/l at 3 and 5 weeks respectively while the mean serum TAC of the diabetic group at 3 and 5 weeks (0.8±0.1mmol/l and 0.6±0.1mmol/l) respectively were significantly decreased (p<0.001) when compared to the control 1.6±0.1mmol/l and 1.7±0.1mmol/l at 3 and 5 weeks respectively. The mean Urea, Creatinine, ALT, AST, TC, LDL-C, VLDL-C, TG, FPG and HbA1c values were significantly increased (p<0.001) in the diabetic group when compared to the control group while the mean serum HDL-C value of the diabetic group decreased significantly (p<0.001) when compared with the control at 3 and 5 weeks of the study. Histological examinations showed mild structural distortions of the organs studied in the experimental group.
Interpretation: The present study shows that alloxan injection caused a significant increase in plasma glucose levels in rats in comparison with the control rats. Persistent hyperglycaemia resulted in a number of biochemical and pathological changes in the diabetic rats but the control rats were normoglycaemic and showed no biochemical or pathological changes .There was a correlation between GGT and TAC, indicative of oxidative stress on the diabetic rats.
Keywords: alloxan, biochemical parameter, diagnostics, histological profile, hyperglycaemia, oxidative stress
Diabetes mellitus often simply referred to as diabetes is one of the most important health problems with very high prevalence, morbidity and mortality. It is a group of metabolic diseases characterized by chronic hyperglycaemia resulting from defects in insulin secretion, action or both.1 Insulin is a hormone produced by the pancreas that allows glucose from food to enter the body’s cells where it is converted into energy needed for muscles and tissues to function. As a result, a person with diabetes does not absorb glucose properly, and glucose stays circulating in the blood (hyperglycaemia) damaging tissues over time. This damage leads to life threatening health complications.2 Diabetes is the world’s largest endocrine disorder with deranged carbohydrate, fat and protein metabolism.3 The World Health Organization in 2002 predicted that the worldwide number of patients with diabetes will double by the year 2025, from the current number of approximately 150 million to 300 million. Uncontrolled or poorly controlled diabetes increases both short and long term complications like micro- and macrovascular complications. The most common complications are atherosclerosis, nerve damage, renal failure, blindness, infertility and so on. The liver has also been shown to be affected by diabetes, although the exact mechanism still remains unclear.4 Alloxan is a diabetogenic agent used to induce experimental model of diabetes. Administration of alloxan to different animals produces necrosis of the islets, several features common to those observed in human diabetes.5 Animal models of diabetes are increasingly being used in the investigation of the pathogenesis of diabetes and long term diabetic complications seen in clinical studies.6 Diabetes mellitus results in multi-system consequences which present with biochemical and anatomical changes. Disturbances in the metabolism of carbohydrates, proteins and fats are the biochemical consequences, while micro-and macrovascular complications are the anatomical derangements. Increasing evidence in both experimental and clinical studies suggest that oxidative stress plays a role in the pathogenesis of diabetes mellitus, and the free radicals formed as a result leads to a decline in the anti-oxidant defense mechanism which consequently lead to increased risk and development of complications of diabetes, all of which affect longevity and quality of life. Moreover, accumulating evidence suggests that oxidative stress plays a pivotal role in the aetiology of diabetic complications. Living organisms have developed complex antioxidant systems to counteract reactive species and to reduce their damage. These antioxidant systems include enzymes such as catalase, superoxide dismutase and glutathione peroxidase; macromolecules such as albumin, ceruroplasmin and ferritin, and an array of small molecules, including ascorbic acid, α-tocopherol, β-carotene, ubiquinol-10, reduced glutathione (GSH), methionine, uric acid and bilirubin.7,8 The Total Antioxidant Concentration (TAC) serves as a general marker of the antioxidant defenses. In vitro and clinical studies may provide additional useful ways to probe the inter connections of oxidative stress and diabetes, and there is a need to continue to explore the mechanisms by which increased oxidative stress accelerates the development of complications in diabetes.9
Experimental animals
40 albino Wistar rats of both sexes weighing between 190g±20g were used for this study. The animals were maintained on a standard poultry diet (Vital Feeds, Jos) and water ad libitum, and were allowed an acclimatization period of two weeks. They were handled according to the institutional and international guidelines for the care and use of laboratory animals.
Experimental design
The animals were randomly assigned into two groups A and B consisting of twenty rats each. Group A was the control (non-diabetic) group, while Group B was the experimentally-induced diabetic group.
Induction of experimental diabetes
After an overnight fast, experimental diabetes was induced in group B animals by a single intraperitoneal dose of alloxan monohydrate at 150mg/kg body weight dissolved in freshly prepared normal saline while those in group A were given normal saline intraperitoneally after an overnight fast. Development of diabetes was confirmed one week post-alloxan administration in Group B after an overnight fast by measuring the fasting plasma glucose (FPG) levels using a commercial glucose kit (Randox). Only rats with FPG above 11mmol/l were included in this study. On the 3rd and 5th weeks respectively, 10 rats from each group were fasted overnight, euthanized, and blood samples collected through cardiac puncture for the estimation of biochemical parameters and organs excised for histological studies. The body weights of the rats were measured using a spring balance before and at the end of the experiment.
Biochemical assays
Blood samples were collected in three different test tubes; fluoride oxalate tube for the estimation of plasma glucose, plain tubes (without anticoagulants) to separate serum for estimation of some biochemical parameters and EDTA tubes for glycated haemoglobin (HbA1c) estimation. Blood samples in fluoride oxalate and plain tubes were centrifuged in Techmel and Techmel 800D centrifuge USA at 3000g for 5 and 10 minutes respectively. The supernatant plasma was used for FPG assay while the serum was used for urea, creatinine, ALT, AST, lipid profile, GGT and TAC assay.
FPG assay
This was done using the glucose oxidase method as described by Trinder et al.9 1000μl of the working reagent (Randox kit) was added to 10μl of sample and standard, this was mixed and incubated for 20 minutes at 25 °C (room temperature) and absorbance of sample and standard were measured against the reagent blank at 520nm.
Urea assay
The diacetylmonoxime (DAM) method was used. DAM was hydrolyzed to diacetyl and monoxime in a hot acid medium, diacetyl condensed with urea to form a pink coloured complex whose intensity was proportional to the urea concentration. 2000μl each of the mixed acid and colour were added to 10μl of sample, standard, mixed and incubated at 100oC for 10 minutes. Absorbance of sample and standard were read at 540nm after cooling.
Creatinine assay
This was according to Jaffe’s method as modified by Fabing & Ertingshaushen et al.10 1500μl of distilled water was added to 500μl of both serum and standard while 2000μl of distilled water was added to the blank. 1000μl each of H2SO4 and sodium tungstate were added to sample, standard and blank, incubated at room temperature and then centrifuged for 10 minutes. 500μl each of NaOH and picric acid were added to 1500μl of the supernatant incubated at room temperature for 15 minutes and read at 490nm.
This was estimated according to the method described by Rietman & Frankel et al.11 500μl each of ALT and AST substrates were incubated for 5 minutes at 37 °C (for Test and Blank). 100μl and 200μl of test samples were added to the ALT and AST substrates respectively, mixed and incubated for 30 minutes at 37 °C. 500μl of 2,4-DNPH was added to both Test and Blank. For the Blank sample, 100μl and 200μl of samples were added as in Test above to the substrate/DNPH mixture and incubated for 20 minutes at room temperature. 5000μl of NaOH was added to both Test and Blank, and absorbance read at 540nm.
Total cholesterol (TC) assay
This was estimated as described by Richmond & Roeschlau et al.12,13 1000μl of cholesterol reagent (Randox kit) was added to 10μl each of the sample and standard, mixed and incubated for 10 minutes at room temperature. The absorbances were measured against the reagent blank at 540nm.
High density lipoprotein cholesterol (HDL-C) assay
This was measured using the method of Wacnic & Alber et al.14 500μl of diluted precipitant and 200μl of sample and standard were mixed and incubated for 10 minutes at room temperature, then centrifuged for 10 minutes. 1000μl of cholesterol reagent (Randox kit) was added to 10μl each of the supernatant and standard, mixed and incubated for 10 minutes at room temperature, then read colorimetrically at 540nm.
Triglyceride (TG) assay
This was estimated according to the method described by Tietz et al.15 1000μl of the TG reagent (Randox kit) was added to 10μl each of sample and standard, incubated for 10 minutes at room temperature, and absorbance read at 540nm.
Low density lipoprotein cholesterol (LDL-C) assay
This was calculated in mmol/l using the Friedewald’s equation as stated below:16
Very low density lipoprotein cholesterol (VLDL-C) assay
This was also calculated in mmol/l using the Friedewald’s equation as stated below:16
Gamma-glutamyl transferase (GGT) assay
This was measured as described by Persijn & Gendler et al.17,18 Samples were analyzed using Mindray BS-120 auto analyser and colour intensity measured photometrically.
Total antioxidant concentration (TAC) assay
The TAC of serum was estimated as described by Koracevic et al.19 Six test tubes labeled sample (A1), sample blank (A0), negative control (K1 and K0) and standard (UA1 and UA0) were used, in which each sample was analyzed in six (6) runs with negative control for each series of analysis prepared in duplicate containing the same reagents as A1 and A0 except for serum. 10μl of serum was added to A1 and A0, 10μl of uric acid was added to UA1 and UA0 after which 490μl of buffer, 50μl of sodium benzoate, 200μl of iron-EDTA and 200μl of hydrogen peroxide were added to A1, A0, K1, K0, UA1 and UA0. 1000μl of acetic acid was then added to A0, K0 and UA0. The solutions were mixed and incubated at 37 °C before adding 1000μl of acetic acid to A1, K1 and UA1, and 1000μl of thiobarbituric acid to A1, A0, K1, K0, UA1 and UA0.
Glycated haemoglobin (HbA1c) assay
This was measured in whole blood using the micro-column chromatography method as described by Bissé & Abragam.20 The columns and reagents were brought to room temperature. 50μl blood and 200μl reagent 1 were mixed (haemolysate) and incubated for 15 minutes at room temperature. 50μl of haemolysate and 200μl reagent 2 were added to each column and left to drain to waste. The columns were then placed over new test tubes and 4ml reagent 3 was added, and the absorbance of the eluate (AHbA1c) collected read at 415nm. 12ml reagent 3 and 50μl of haemolysate were mixed and the absorbance (AHb Total) read at same wavelength.
All tissues were fixed in 10% formalin, the fixed tissues were dehydrated with grades of alcohol beginning from 70% to absolute. They were then cleared with xylene, impregnated and embedded in paraffin wax. Sections were prepared, stained with haematoxylin and eosin (H&E) stain, and then mounted using DPX (Distrene 80 dibutylphthalate Xylene) for light microscopy and photomicrography.
Statistical analyses
Values obtained were expressed as mean±standard error of mean. The data were analysed using the Statistical Package for Social Sciences (SPSS) version 17.0 software, and a p-value of <0.05 was considered statistically significant.
The results of this study are presented in Tables 1–4. Table 1 shows the mean body weights (initial and final) of the experimental groups at 3 and 5 weeks. There was no statistically significant difference (p>0.05) in the means of initial body weights of groups A and B (184.0±4.5g and 188.0±5.7g) at 3 weeks, and 182.0±5.5g and 185.0 ±4.8g at 5 weeks respectively while the means of the final body weights of groups A and B (198.0±4.2g and 172.0±4.7g) at 3 weeks, and 207.0±5.4g and 153.0±4.0g at 5 weeks respectively showed a statistically significant difference (p<0.05) There was a significant increase in the body weights of the control group while the diabetic group showed a significant decrease in their body weights. In Table 2, the mean serum GGT concentration of the diabetic group at 3 and 5 weeks (4.0±0.2iu/l and 4.4±0.2iu/l respectively) were significantly increased (p<0.001) when compared to the control group 0.8±0.2iu/l and 0.8±0.1iu/l at 3 and 5 weeks respectively while the mean serum TAC of the diabetic group at 3 and 5 weeks (0.8±0.1mmol/l and 0.6±0.1mmol/l) respectively were significantly decreased (p<0.001) when compared to the control 1.6±0.1mmol/l and 1.7±0.1mmol/l at 3 and 5 weeks respectively. Table 3 shows the correlation coefficient between GGT and TAC at 3 and 5 weeks. There was a significant (p<0.001) negative correlation between GGT and TAC in the experimental groups, r = -0.707 and r = -0.897 at 3 and 5 weeks respectively. In Table 4, the mean Urea, Creatinine, ALT, AST, TC, LDL-C, VLDL-C, TG, FPG and HbA1c values were significantly increased (p<0.001) in the diabetic group when compared to the control group while the mean serum HDL-C value of the diabetic group decreased significantly (p<0.001) when compared to the control at 3 and 5 weeks of the study.
Group |
Initial weight (g) |
Final weight (g) |
A(3 weeks) |
184.0±4.5 |
198.0±4.2 |
B(3 weeks) |
188.0±5.7 |
172.0±4.7 |
p-value |
>0.05 |
<0.05 |
A(5 weeks) |
182.0±5.5 |
207.0±5.4 |
B(5 weeks) |
185.0±4.8 |
153.0±4.0 |
p-value |
>0.05 |
<0.05 |
Table 1 Body weights of non-diabetic and diabetic rats at 3 and 5 weeks
Group |
GGT (iu/l) |
TAC (mmol/l) |
A(3 weeks) |
0.8 ± 0.2 |
1.6 ± 0.1 |
B(3 weeks) |
4.0 ± 0.2 |
0.8 ± 0.1 |
p-value |
<0.001 |
<0.001 |
A(5 weeks) |
0.8 ± 0.1 |
1.7 ± 0.1 |
B(5 weeks) |
4.4 ± 0.2 |
0.6± 0.1 |
p-value |
<0.001 |
<0.001 |
Table 2 Serum GGT and TAC levels of non-diabetic and diabetic rats at 3 and 5 weeks
Parameters |
Correlation coefficient (r-value) |
p-value |
GGT and TAC(3 weeks) |
-0.707 |
<0.001 |
GGT and TAC(5 weeks) |
-0.897 |
<0.001 |
Table 3 Correlation coefficient between GGT and TAC of experimental groups at 3 and 5 weeks
Group |
Urea mmol/l |
Crea μmol/l |
ALT iu/l |
AST iu/l |
TC mmol/l |
HDLC mmol/l |
LDLC mmol/l |
VLDLC mmol/l |
TG mmol/l |
FPG mmol/l |
HbA1c % |
A(3 wks) |
4.4±0.5 |
96.5±1.6 |
13.3±1.0 |
18.1±1.1 |
2.3±0.1 |
1.2±0.0 |
0.6±0.1 |
0.5±0.0 |
1±0.0 |
5±0.1 |
3.8±0.1 |
B(3 wks) |
10.4±0.3 |
132.6±2.0 |
22.4±0.8 |
29.2±1.5 |
3.8±0.1 |
0.6±0.0 |
2.3±0.1 |
1±0.0 |
2.3±0.0 |
14.4±0.1 |
9.1±0.5 |
p-value |
<0.001 |
<0.001 |
<0.001 |
<0.001 |
<0.001 |
<0.001 |
<0.001 |
<0.001 |
<0.001 |
<0.001 |
<0.001 |
A(5 wks) |
4.8±0.5 |
97.4±1.4 |
13±1.1 |
17.3±1.1 |
2.4±0.1 |
1.3±0.0 |
0.7±0.0 |
0.5±0.0 |
1.1±0.0 |
5.1±0.1 |
3.9±0.1 |
B(5 wks) |
10.8±0.3 |
138±2.0 |
24.2±0.9 |
32±1.5 |
3.7±0.1 |
0.6±0.0 |
2.1±0.0 |
1.1±0.0 |
2.4±0.0 |
13.2±0.3 |
10.1±0.7 |
p-value |
<0.001 |
<0.001 |
<0.001 |
<0.001 |
<0.001 |
<0.001 |
<0.001 |
<0.001 |
<0.001 |
<0.001 |
<0.001 |
Table 4 Test for kidney function (urea & creatinine), liver function (ALT & AST), lipid profile (TC, HDLC, LDLC, VLDLC, TG) and carbohydrate metabolism (FPG & HBLC) of non- diabetic and diabetic rats at 3 and 5 weeks
The present study shows that alloxan injection caused a significant increase in plasma glucose levels in rats in comparison with the control rats. Persistent hyperglycaemia resulted in a number of biochemical and pathological changes in the diabetic rats but the control rats were normoglycaemic and showed no biochemical or pathological changes. This agrees favourably with the results of Gidado et al.,21 Gwarzo et al.,22 Enas23 who reported that intraperitoneal injection of alloxan induced diabetes. In the present study, the alloxan induced diabetic rats showed significantly higher levels of FPG and lower body weights when compared to the control. This was consistent with earlier reports of Komolafe et al.;24 Murali et al.;25 Urmila & Goyal.26 Previous histological studies also supported the present investigation as alloxan was suspected to destroy the B cell islets of Langerhaans according to the reports of Sandhu et al.,27 Szkudelski,28 Mir et al.,29 Muthulingam;30 who reported that the pancreas of alloxan or streptozotocin induced diabetic rats showed reduced islet cells and necrosis. The pancreas is especially susceptible to action of alloxan induced free radical damage leading to massive reduction of insulin release, the resultant effect which is insulin deficiency leads to increased blood glucose and a host of other metabolic alterations in the animals. The weights of the diabetic rats were significantly reduced despite the increase in food and fluid intake in these animals. The weight loss was progressive for five weeks post alloxan administration. The reduction in body weights observed in the diabetic rats compared to the non-diabetic rats may be due to dehydration and increased catabolism of fats and protein Hakim et al.31 as a result of cells inability to metabolize glucose properly (gluconeogenesis from amino acids and body protein). These metabolic derangements eventually result to muscle, tissue wasting and breakdown. This result is in agreement with the work done by Ebuehi et al.32 An increase in serum GGT was observed in diabetic rats when compared to normal controls. The results were in accordance with many prospective studies like those of Lee et al.;33 Nakanishi et al.;34 Sharma et al.35 who reported a strong relationship between GGT concentrations and incident diabetes. This relationship could be as a result of GGT acting as a marker of oxidative stress. Hiderani et al.36 reported that serum GGT activity may be regarded as a marker of oxidative stress rather than a mere indicator of excessive alcohol consumption or liver dysfunction, and that increased serum GGT may reflect a counter reaction of human bodies against increased oxidative stress. It has been shown that GGT counteracts oxidative stress by breaking down extracellular glutathione and making component amino acids of glutathione available to the cells Whitfield.37 In the present investigation, diabetic rats exhibited profound decrease in the serum TAC concentration when compared to the control. This could be due to increased ROS generation by mechanisms such as glucose auto-oxidation, polyol pathway and PKC activation. Evidences suggest that oxidative stress is increased in diabetes resulting from an overproduction of ROS, and decreased efficiency of antioxidant activity in the diabetic rats is indicative of oxidative stress.
The results of this study are in accordance with those of Datta et al.;38 Jackson et al.;39 Sait & Hattice.40 Enas.23 reported an increase in antioxidant capacity in alloxan treated rats which he attributed to over expression of antioxidant enzymes in response to glucose-induced oxidative stress. Serum GGT concentration was higher whereas TAC concentration was lower in diabetic rats compared to the normal control. This negative correlation between GGT and TAC could be attributed to oxidative stress in diabetes which depletes the antioxidant defense system resulting in a compensatory increase in GGT. Chronic hyperglycaemia and dyslipidaemia are associated with a variety of metabolic disorders in human and animal diabetes Handen et al.41 causing oxidative stress, depleting the activity of the antioxidant defense system and resulting in elevated levels of ROS Dahech & Handen et al.42,43 The inverse association between antioxidants and serum GGT has indicated the possibility that serum GGT might be associated with oxidative stress Lee et al.;44 Takigawa et al.45 In the present study, HbA1c was used as a marker of glycaemic control. The significant increase in HbA1c concentration in the diabetic rats when compared to the control may be attributed to the persistent hyperglycaemia. Persistent hyperglycaemia, uncontrolled or poorly controlled diabetes results to an increased glycosylation of a number of proteins including haemoglobin because the excess glucose in blood reacts with haemoglobin. This result supports the work done by Aruna et al.;46 Muthulingam.;47 Neeraj et al.;48 Vallejo et al.49 on higher HbA1c levels in diabetic rats. Our study also showed that alloxan-induced diabetes in rats produced alterations in the hepatic structures as well as functions while the control group showed no pathological changes. This was evident from the histological sections which showed mild and moderate periportal lymphocytic infiltrations with sinusoidal dilatations as well as serum elevation of transaminases activities (ALT and AST) which are indices of liver cell damage. These changes could be attributed to the altered architecture of the hepatocytes, and these subtle membrane changes are sufficient to allow the leakage or passage of intracellular enzymes into blood, hence their increased concentrations in serum. Moreover, cell damage increases permeability causing cytosolic isoenzymes to spill into the interstitium, and from there into the peripheral blood. The pathological changes in liver of alloxan and streptozotocin induced diabetic animals have been previously reported Herrman & Sandhu et al.50,51 Zhang et al.52 reported an increased serum levels of ALT and AST in diabetic rats. Ohaeri,53 Al-shamshi et al.;54 Fadillioglu et al.55 also reported an increased serum ALT and AST in diabetes patients than in the general population (Figures 1-4).
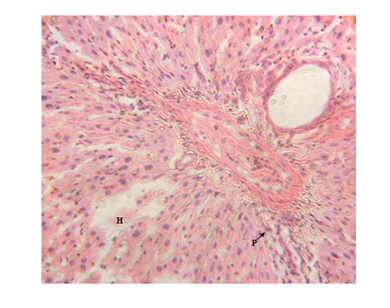
Figure 1 Liver micrograph of diabetic rat showing mild periportal lymphocytic infiltration(P) and hepatocyte disorientation (H) at 3 weeks.(H & E stain X400).
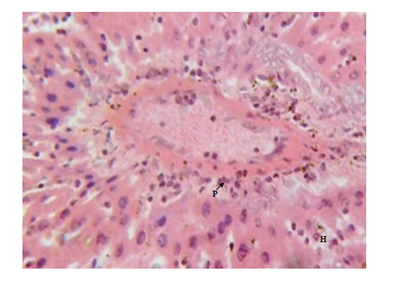
Figure 3 Liver micrograph of diabetic rat showing moderate periportal lymphocytic infiltration(P) and hepatocyte disorientation (H) at 5 weeks. (H & E stain X400).
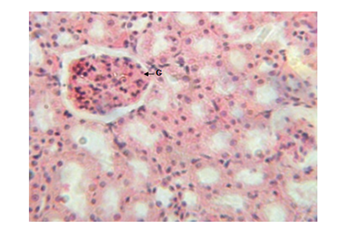
Figure 4 Kidney micrograph of control rat showing normal glomerular(G) structure at 3 and 5 weeks. (H & E stain X400).
The results of this study however disagree with the results of Jianpu et al.56 who reported that serum ALT and AST levels in diabetic rabbits were within normal ranges and Gidado et al.21 who reported insignificant changes in serum levels of ALT and AST in diabetic rats. The liver is one of the tissues that bear the brunt of chronic hyperglycaemia, since glucose is freely permeable to its cells Meyes.57 This unrestrained entry, in the presence of excess and sustained glucose in the blood is bound to cause metabolic derangements which would express themselves on the gross architecture of the tissues Atangwho et al.58 Present observations on the diabetic rat kidneys showed a progressive damage which increased with duration and severity of hyperglycemia as recorded by Muhammad et al.59 the resultant renal damage was caused by severe hyperglycemia induced by alloxan. There were septal haemorrhages, glomerular degeneration, increased capsular space with tubular epithelial damage and dysplasia as observed in kidney sections of the diabetic rats. These findings are in agreement with the findings of Kim et al.;60 Muhammad et al.;59 Renno et al.61 who showed tubular epithelial changes and enlargement of lining of cells of the tubules (Figures 5‒11).
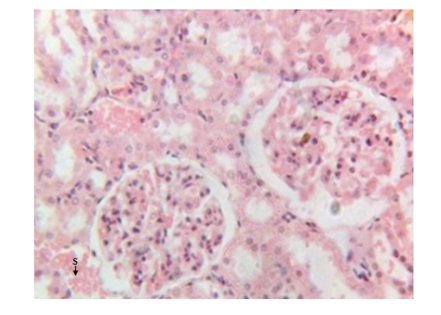
Figure 5 Kidney micrograph of diabetic rat showing septal haemorrhage(S) at 3 weeks. (H & E stain X400).
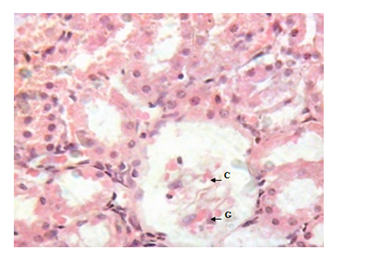
Figure 6 Kidney micrograph of diabetic rat showing glomerular degeneration(G) and increased capsular space(C) at 5 weeks. (H & E stain X400).
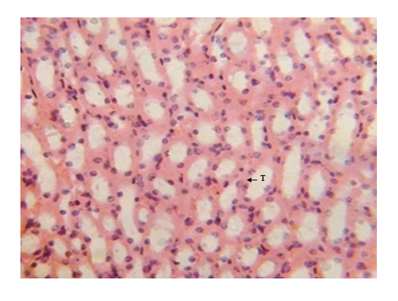
Figure 7 Kidney micrograph of control rat showing normal tubular(T) structures at 3 and 5 weeks. (H & E stain X400).
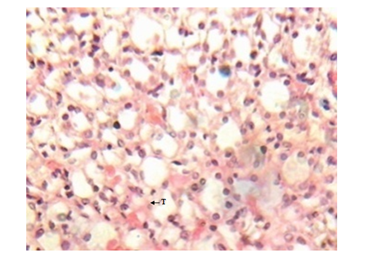
Figure 8 Kidney micrograph of diabetic rat showing mild tubular damage(T) at 3 weeks. (H & E stain X400).
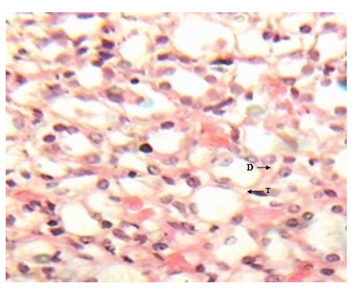
Figure 9 Kidney micrograph of diabetic rat showing moderate tubular damage(T) and dysplasia(D) at 5 weeks. (H & E stain X400).
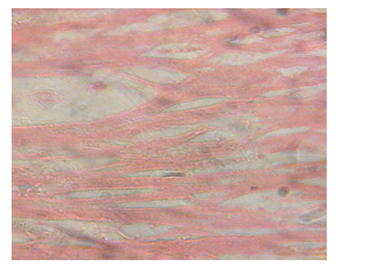
Figure 10 Heart micrograph of control rat showing normal cardiac muscle structures at 3 and 5 weeks.
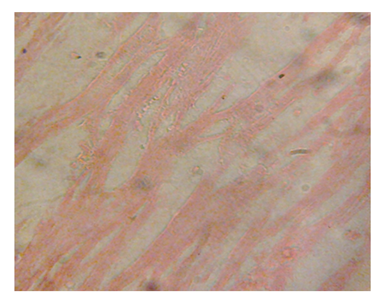
Figure 11 Heart section of diabetic rat showing no alterations of the cardiac muscle structures at 3 and 5 weeks.
The structural changes in the kidneys could be attributed to altered metabolism in diabetes Rasch,62 and subsequent effects on the increased renal threshold for hyperglycemia.29 Moreover, glucose overload damages the mesangial cells in the renal glomerulus through oxidative stress Brownlee.63 In the diabetic kidney, enhanced glucose uptake occurs in many cell populations including glomerular epithelial cells, mesangial cells and proximal tubular epithelial cells leading to the excessive production of intracellular ROS, making these cells particularly susceptible to diabetic milieu Forbes et al.;64 Eze,65 reported some degeneration of glomeruli with presence of tubular casts and signs of chronic inflammation in diabetic wistar rats. Peter et al.66 had previously reported a damaging effect of diabetes in the glomerulus, thereby affecting Glomerular Filtration Rate (GFR). Zafar et al.67 also reported that streptozotocin-induced diabetic rats showed some functional and morphological changes in the kidney. These morphological abnormalities in the kidney of diabetic rats were associated with significant elevations in serum urea and creatinine levels, indicating impaired renal function of the diabetic animals. The results are consistent with those of Shah et al.68 who reported elevated serum urea and creatinine levels as a result of renal damage in diabetic rats. The histological sections of the hearts of diabetic as well as non-diabetic rats showed normal architecture of the myocardium for the study period. This is consistent with the work done by Kita et al.69 who reported short-term metabolic disorders in diabetic rat heart with histopathological changes occurring later. The results disagree with those of Komolafe et al.24 who reported architectural alterations in myocardium and microanatomy of cardiovascular structures of diabetic animals. In the present study, serum lipid profile was used to assess the risk of development of cardiovascular disease which recorded elevated total cholesterol, LDL-C, VLDL-C and triglyceride levels whereas HDL-C levels decreased in alloxan-induced diabetic rats which is associated with cardiovascular diseases as seen in diabetes. The abnormal high levels of serum lipids in diabetes is mainly due to increased activity of hormone sensitive lipase in insulin deficiency resulting in enhanced lipolysis and mobilization of free fatty acids from the peripheral depots and adipose due to underutilization of glucose. Some of the excess fatty acid produced is then metabolized to acetyl coA which is used in the synthesis of cholesterol in the liver, thus increasing cholesterol levels in diabetes. On the other hand, glucagon, catecholamines and other hormones may also enhance lipolysis. Therefore, the uninhibited action of lipolytic hormones on the fat depots may be responsible for this increase. The lack of insulin and elevations of counter regulatory hormones lead to activation of enzyme (hormone-sensitive lipase) that stimulate lipolysis and enhance release of free fatty acids from adipose tissue. The fatty acids from adipose tissues are mobilized for energy purpose, and excess fatty acids are accumulated in the liver, which are converted to triglycerides Suryawanshi et al.70 The high levels of LDL-C may be attributed to diminished levels of LDL receptors resulting in increased circulating LDL particles Suryawanshi et al.70 The decreased serum HDL-C levels in the present study may enhance CVD risk since HDL-C function is to remove cholesterol atheromas within arteries and transport them back to the liver for excretion and re-utilization. The results support the works of21,23,24,40,68 who reported marked increase in cholesterol, triglycerides, LDL-C, VLDL-C and decreased HDL-C in diabetic rats when compared to non-diabetic rats. However, Jos et al.71 reported no correlation between diabetes mellitus and lipids in the study conducted with diabetes patients.
From our study, alloxan-induced diabetes caused an elevation of serum GGT and decreased total antioxidant levels which suggest that GGT and TAC may be used as reliable markers of oxidative stress in diabetes mellitus. The pathologic lesions and various alterations in the biochemical markers of liver and kidney functions resulting in their structural and functional abnormalities may be regarded as oxidative stress-induced diabetic complications in these organs. It may also be concluded that the effect of diabetes on the heart results in metabolic and biochemical disorders which may eventually lead to morphological changes at a later stage of the disease.
The study was sponsored by all the authors.
The authors have declared that no competing interests exist.

©2018 Obi-Ezeani, et al. This is an open access article distributed under the terms of the, which permits unrestricted use, distribution, and build upon your work non-commercially.