MOJ
eISSN: 2374-6920


Short Communication Volume 4 Issue 3
Department of Australian Proteome Analysis Facility (APAF), Macquarie University, Australia
Correspondence: Edmond J Breen, Australian Proteome Analysis Facility (APAF), Level 4, Building F7B, Research Park Drive, Macquarie University, Sydney NSW 2109 Australia
Received: October 03, 2016 | Published: October 31, 2016
Citation: Breen EJ. Sample replication effects on statistical power in multiplexed immunoassay analysis. MOJ Proteomics Bioinform. 2016;4(3):221-223. DOI: 10.15406/mojpb.2016.04.00121
It is known that by increasing replication via expanding the number of biological or technical replicates analysed, increases overall experimental precision and statistical power. The current and common immunoassay experimental practices, such as with Luminex xMap® technology, is that all samples are analysed in replicate. For most plate or array based immunoassay experiments this design of replication reduces by a half the actual numbers of biological replicates that can be analysed. Here it’s shown, in theory, that for common types of immunoassay experiments such as for screening biological samples for the concentration of analytes, that by leaving out the technical replicates doesn’t overly effect the expected value of the experiment’s assay variances, even though the number of assays have been halved. It is also shown that when the technical replicate assays are replaced by unique biological replicate assays, thereby keeping the number of assays the same, that the expected experimental variances coming from the biological replicates are decreased by 50%. Because the practice of technical replication in immunoassay analysis is current this report makes it explicit for plate and array based assay formats, that by using technical replicates over the option of biological replicates reduces overall experimental precision and efficiency of statistical analysis
Keywords: immunoassay analysis, technical replication, biological replication, standard error of the mean
Luminex xMap® bead based multiplex immunoassays1 are used in the life sciences,2,3 for high throughput measurements and clinical screening of biological serum, plasma and tissue samples for the expression levels of small proteins such as cytokines, chemokines, and growth factors that are involved in cell signalling, cellular taxis, immune system responses, development and cell death. xMap® technology utilizes dye-defined beads that are coated with a particular anti-analyte antibody. Once the analyte is added, a fluorescently labelled antibody is added to detect positive signals for analyte expression measurement.
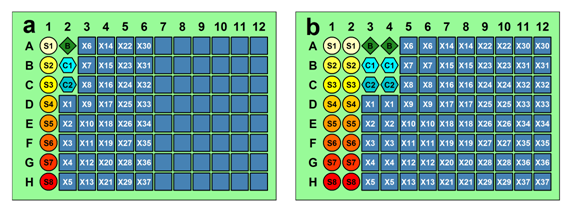
Samples from test subjects and immunoassay reference samples (standards, blanks and controls) are assayed, typically, in a 96-well plate format, 8 rows by 12 columns of reactions as seen in Figure 1a. However, the results and conclusions presented here are not restricted to any particular assay plate format or array type. Generally, each well in an assay plate contains just one test or reference sample type. The Luminex recommended protocol and the universally excepted/common practice for assigning samples to assays is to have all samples analysed in replicate,4,5 as seen in Figure 1b. This practice is also recommended and used in many other immunoassays analysis systems.6 While the use of technical replicates is highly recommend,7 it has been suggested that when the expected intra-assay %CV for duplicates are below an acceptable threshold such as 5–15% then assays can be run in singlet format.4 It is common practice for primary immunoassay screening of compounds to be run in singlet format due to time and cost concerns.7 More recently it is has been recognised that while averaging technical replicates can limit the impact of measurement error, taking additional biological samples is often preferable for improving statistical power and hence for increased experimental precision.8,9

Figure 1 Sample and assay plate layouts for replicate analysis. (a), the recommended sample plate layout for 8 standards (S), 1 blank (B), 2 controls and 37 tests samples (X). (b) Assay plate layout constructed from the sample plate layout by replicating each sample column. The reference samples are represented by circle = standard (S), diamond = blank (B), and hexagon = control (C), while the test-subject samples (X) are represented in squares.
The number within each shape, identifies, the same sample for that type.
Note, only 37 test-samples can be analysed per plate. The controls are used for measuring plate-to-plate variations and are not always included as the standards can also be used for measuring inter-plate variability if needed.2 Standards are used to quantify analyte concentrations, and each plate includes wells containing a dilution series (S1 to Sn, where n is generally 6, 7 or 8 but can be larger), of known analyte concentrations.
As each plate of assays, Figure 1b can cost upwards of several thousands of dollars, there is a need to maximize the statistical power of the experiment while reducing the number of plates used. This can be done, as shown here, by considering the number of biological and technical replicates used for any particular immunoassay experiment.
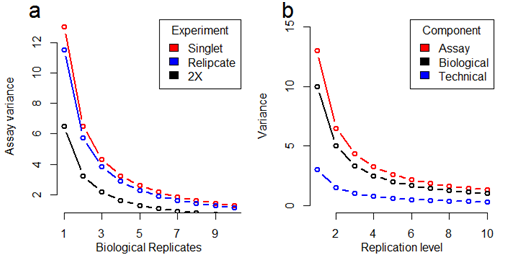
Biological replicates are parallel measurements taken from different individuals or distinct biological samples. Technical replicates are repeated measurements on the same biological sample. Given that the total variation in assay measurement is the sum of variances of each effect biological and technical, weighted by the number of times each effect has been independently sampled.10 Let the variance, in the measurement of a subject’s analyte response due to biological variance be vb and technical variance be vt. Then, the variance in response from a single assay vb+ vt is that is, the sum of the individual variances. The variance of each source is divided by the number of times that source is independently sampled. If biological replicates are assayed in replicate then, the single assay variance is vb+vt/2 and for n biological replicates analysed in replicate the assay variance becomes vb/n+vt/2n. Now by dropping the technical replicates and increasing the numbers of distinct biological replicates for analysis 2 fold (2X), the experimental assay variation becomes: vb/2n+vt/2n. The effect on the observed assay variance depending on experimental designs is shown Figure 2a.

Figure 2 Assay variance with respect to: (a) biological replicate numbers and (b) level of replication. Plots are conditional on that vb = 10 and vt = 3.
Note for the Replicate experiment, when the number of biological replicates is n there are 2n assays produced; likewise for the 2X experiment. However for the 2X experiment there are 2n distinct biological replicates used. This means the Replicate and 2X designs are across the same number of assays with respect to n.
As seen in Figure 2a the singlet experiment design, where all assays come from unique biological replicates, the expected observed assay variance is not that different from the variances expected from a fully replicated experiment when vb=10 and vt=3; that is when the technical variance is less than or equal to 30% of the biological variances. The big difference, of course, between these curves, red and blue lines Figure 2a, is that the replicated design requires twice the number of assays over that used in a singlet experiment design. Alternatively, rather than reducing the number assays, use two times (2X) the biological samples, by replacing the technical assays with assays for unique biological replicates. This 2X design results in the lowest expected assay variances per n assays produced as seen for the blue line in Figure 2a. Naturally the 2X design is just a special case of a singlet design, but is worth considering because it makes it very clear that using n assays with n biological replicates is better than using half the assays for a technical replicates and the other half with biological replicates. Figure 2b gives a decomposition of the assay variance according to the contributions from the biological and technical replicates with respect to replication levels.
As a further example; consider the case were you have 74 biological samples to analyse and cost isn’t an issue. Do you put them all on one plate or in replicate across 2 plates as recommended? For a one plate experiment the expected assay variance is vb/74+vt/74. For two plates, ignoring any variance due to plate effects, the expected assay variance is vb/74+ vt/148. If vb is greater than vt, which is expected,9 then the reduction in the observed assay variance due to the difference between vb/74 and vt/148 is expected to be negligible.
Here it was shown that experimental statistical power is altered by the ratio of the replicate types; such as biological and technical used in any multiplexed plate or array based immunoassay experiment That by removing technical replicates from an experiment won’t drastically change the overall expected assay variances even when the number of assays have been halved. The results presented her, and particularly for those for small sample number (n<10), where conditional on that the ratio of the biological to technical variances being at least 3:1. It was also shown that for any number of assays it is best to use all unique biological replicates as this, and regardless of variance ratios, will always result in the lowest expected assay variances and will provide the most precise measurements of sample means and variances for statistical analysis. Naturally, however, if you’re interested in technical questions, then you should do as many technical replicates as needed, but generally in the life sciences, it is the biology which is of our concern, therefore we should be encouraging and trying to maximise the number of biological replicates used in any immunoassay experimental experiment.
Thanks to the Australian Proteome Analysis Facility (APAF) for funding this research.
The author declares no conflict of interest.

©2016 Breen. This is an open access article distributed under the terms of the, which permits unrestricted use, distribution, and build upon your work non-commercially.