MOJ
eISSN: 2374-6920


Review Article Volume 6 Issue 3
Department of Genetics, Federal University of Rio de Janeiro, Brazil
Correspondence: Claudia AM Russo, Molecular Biodiversity Laboratory, Department of Genetics, Institute of Biology, Block A, CCS, Federal University of Rio de Janeiro, Fundo Island, Rio de Janeiro, RJ, 21941-590, Brazil, Tel 21 991042148, Fax 21 39386397
Received: March 14, 2017 | Published: November 3, 2017
Citation: Russo CAM, Aguiar B, Selvatti A. Selecting molecular markers for a specific phylogenetic problem. MOJ Proteomics Bioinform. 2017;6(3):295-301. DOI: 10.15406/mojpb.2017.06.00196
In a molecular phylogenetic analysis, different markers may yield contradictory topologies for the same diversity group. Therefore, it is important to select suitable markers for a reliable topological estimate. Issues such as length and rate of evolution will play a role in the suitability of a particular molecular marker to unfold the phylogenetic relationships for a given set of taxa. In this review, we provide guidelines that will be useful to newcomers to the field of molecular phylogenetics weighing the suitability of molecular markers for a given phylogenetic problem.
Keywords: phylogenetic trees, guideline, suitable genes, phylogenetics
Over the last three decades, the scientific field of molecular biology has experienced remarkable advancements in data gathering and extensive phylogenetic analyses. The development of new technologies and the subsequent accessibility of refined methods due to cost reduction contributed to an immeasurable expansion of molecular facilities worldwide.1 The rate of sequence submission has recently intensified for three primary reasons: the numerous and successful DNA barcoding projects,2,3 the advent of Next Generation Sequencing4 and the subsequent decrease in prices for molecular sequencing services.5
As a consequence, genetic data repositories such as GenBank have been doubling in size every 18 months,6 rising from 606 sequences in the first 1982 release to close to 200 million sequences in the 218th release in February 2017. Molecular data from more than 260 thousand nominal species is now widely accepted as a paramount source of biological information in all life sciences.7
This is an exciting time. Many long existing controversies are in the process of being resolved by an unparalleled amount of data.6,8,9 Phylogenomics, a dream just a few decades ago, is now changing the face of molecular phylogenetics. It is a revolution second only to the introduction of molecules in the field of phylogenetics in the 1960’s.
However, the availability of large number of sequences is not necessarily associated with an accurate estimation of phylogenies, due to analytical errors associated with very large sets of sequence data.10–12 Hence, the contentious matter of molecular marker sampling is inhibiting this new breakthrough. Different genes may yield strikingly contradictory topological patterns for a given diversity group.13,14 Thus, the selection of suitable markers is critical in obtaining accurate estimates, but it is not a straightforward task. In this review, we aim to provide some guidelines for newcomers weighing the suitability of particular molecular markers for a given phylogenetic problem.
In phylogenetic reconstruction, as in comparative biology studies, the single most important concern lies in the matter of homology, a concept that occupies a central position in evolutionary biology.15 Homology is a qualitative term, defined by equivalence of parts due to inherited common origin.16–18
Homology has been more recently defined as the relationship that binds all states of a single character and sets them apart from the states of other characters, supporting the logical equivalence of the notions of homology and synapomorphy (for review see).19 The comparison of homologous sequences is critical in a phylogenetic analysis, because only homologous characters may reveal the actual phylogenetic pattern.
Nevertheless, a number of authors erroneously refer to homology as a synonym for similarity. Molecular biologists are particularly prone to this error, as they assert that ‘two sequences share 70% homology’ (for reviews on this problem see).15,20 Two sequences might show 70% similarity, if 7 out of 10 aligned base pairs are identical between them.
In molecular sequences, the higher the similarity between two sequences, the more likely it is that they are homologous, because the probability of both sequences acquiring identical base pairs decreases as the sequences grow.18 For instance, two identical 30-nucleotide-long sequences have an extremely low probability of being non-homologous, meaning that they would have attained the same sequence independently.
As defined above, homology cannot be measured, and thus is not a quantifiable concept.18 Two characters are either homologous or they are not. Their homology indicates that their similar parts were already present in their common ancestor. This argument makes comparison between homologous parts a necessary component for phylogenetic inference about common ancestry recovery.21
To properly investigate phylogenetic relationships among a set of taxa, only homologous characters should be compared to reveal their common evolutionary history.15,22 When comparing molecular data, homology of the sequences is obviously essential, but it is not sufficient. This is due to two main processes that result in homologous genes: speciation and gene duplication.17 Two genes are homologous if they descend from a common ancestor. Nevertheless, if their divergence is due to a duplication event, these genes are paralogous. On the other hand, if their divergence is due to a speciation event, they are orthologous genes. In a phylogenetic context, the user must select only orthologous genes.
Figure 1 shows a single copy gene that existed at t0 in a hypothetical organism Zalrus originalis. In Z. originalis, this copy went through a duplication event that resulted in the paralogous copies α and β. Eventually, this condition (two copies) would have spread through all individuals of Z. originalis. In time, both copies would differentiate into distinct sequences, with or without functional differentiation. In this scenario, all Z. originalis individuals will present two homologous, paralogous copies of the original gene. Such paralogous copies provide no clues for phylogenetic inference, because they originated through a duplication event.
If, however, Zalrus originalis goes through a speciation event, both descendant species will carry two copies of the gene α and β. In time, Z. primus and Z. secundus will go through diversification. Eventually, Z. secundus will also speciate into Z. tercus and Z. cuartus. Notice that all six copies of the original gene are homologous at t1, but copies α1, α3 and α4 (or β1, β3 and β4) are orthologous, whereas all copies α and β are paralogous.
Orthologous genes from different species should be selected for unraveling phylogenetic relationships among organism lineages,23 because only these genes will carry speciation related information. Alternatively, paralogous copies should be used if the researcher aims to study duplication patterns in a gene family. In this case, all gene copies of that family must be used to disclose the duplication patterns in the corresponding phylogeny. It is necessary to add several species, all of which contain paralogous copies of the gene. This procedure will yield relative times of the duplication events related to the speciation events.
This approach sounds simple enough. When the researcher is concerned with phylogenetic problems, the same orthologous copy should always be chosen to build a phylogenetic hypothesis. Unfortunately, the distinction between copies α and β on a chromosome is not straightforward, because there are no labels on the chromosome.15,22 This can become a major problem when dealing with gene families or genes with multiple copies, which are very common in most genomes.23 In this sense, if we compare copy a of species X with copies b of species Y and Z, species Y and Z will be joined in the phylogeny, regardless of their phylogenetic relationship. In this case, the divergence time between species X and the remaining species will certainly be overestimated, and spurious phylogenetic relationships may be found.
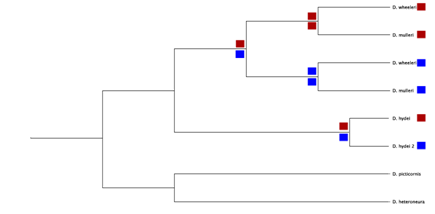
For example, in most drosophilids there are several homologous copies of the gene that encodes for the alcohol dehydrogenase enzyme.24 The phylogenetic tree in Figure 2 depicts the homologous relationships between orthologous and paralogous Adh genes in drosophilids. The relationship may be uncovered using topological analysis. Ancient duplication events such as this can be very helpful when employed as reciprocal out groups (an Adh1 sequence can be used as the out-group in an Adh2 phylogeny, and vice-versa).

Figure 2 Homologous relationships between paralogous (different colours) and orthologous (same colour) of a gene shown in a phylogenetic analysis.
One multiple copy gene that is often used is the ribosomal RNA gene. There are often hundreds of copies in vertebrate genomes, making it clear that the duplication event that resulted in these copies took place before the divergence of vertebrates. However, due to a phenomenon called concerted evolution, in many species all copies within an individual are virtually identical; thus, paralogy/orthology should not be problematic when using this gene in vertebrates. How common this phenomenon is in other taxonomic groups remains to be shown, but it is now widely accepted that gene conversion and unequal crossing over are the main causes of concerted evolution.25 Furthermore, the shorter the divergence time intervals between lineage splits, the more perfectly we have to assume concerted evolution dictates evolutionary rates, so as not to yield errors during phylogenetic reconstruction.
In regard to animal mitochondrial DNA, issues such as gene duplications and paralogy/orthology are no longer a problem, because gene content, size and function are fairly constant across all metazoans. This ensures comparisons among orthologous genes in almost all cases. Conversely, plant mitochondrial DNA have distinct gene compositions compared to those found in metazoans and fungi.26,27 Plants exhibit mitochondrial genomes 10 to 100 times as large as most metazoans, and many gene duplications have been reported.28 The symbiotic events that resulted in the origination of the eukaryotic mitochondria29,30 and chloroplast31 were unique, but due to recombinations and duplications, it would be best to use mitochondrial genomes for more restricted phylogenetic purposes.26,27,32 This is also true for chloroplast genomes that do not exhibit gene content stability among major lineages of plants.33
However, caution should be taken with mitochondrial and chloroplast gene copies that are horizontally transferred into the nucleus (paralogous copies), also known as numts.5,28 The largest problem with numts is that copies inside the nucleus are susceptible to distinct evolutionary forces driving mutations compared to the original mitochondria. Hence, the model of evolution will change, making it impossible to fit into any (single) given available model.
Furthermore, purifying selection will tend to be relaxed so, resulting in a numt that usually evolves faster and rapidly turns into a pseudogene. Pseudogenes may be easily spotted when inspecting the alignment (see next section) and removed. If the numt is not yet a pseudogene, it is most likely very similar to the original mitochondrial gene and should not disrupt phylogenetic patterns. This is a good reason to verify protein coding gene alignments by checking to ensure that all sequences translate perfectly (with no stop codons) into amino acid sequences.
Extra caution must be taken when selecting genes to warrant comparison with orthologous sequences. If the user is unsure about the orthologous nature of the sequences they should be avoided, or all homologous sequences must be used to construct a preliminary phylogeny to define in advance the homologous relationships among sequences. For instance, after inspection of phylogenetic patterns of the Adh related genes, it is clear that only the Adh1 or the Adh2 genes should be used in a phylogenetic analysis of drosophilids of the mulleri species group.
Another issue that needs attention is heteroplasmy, or the fact that the organelle genome may exist as different copies in a single individual. In the vast majority of cases, organelle genomes are inherited through maternal lineages,28,34 but cases of paternal inheritance have been reported in a handful of species, such as plants, bivalves, and mammals.35 However, these inheritance patterns do not seem to be widespread enough to cause concern.28 Furthermore, in phylogenies that sample species, genera or higher taxonomic ranks, the differences between male and female mitochondrial genomes in a single species will most likely not alter the phylogenetic pattern.
A multiple alignment makes three major assumptions. The first is that the names of all sequences represent natural groups that are clustered in the correct tree (i.e., monophyletic groups). This is an important assumption that must serve as a guide when selecting sequence names. The names will carry biological information that will lead to the unfolding of real biological meaning in the final phylogenetic tree according to the phylogenetic patterns recovered. In this sense, the name must contain the name of a species if species monophyly may be assumed; otherwise, the name must include the geographical location from which the individual was sampled.
The second assumption is that all sequences are homologous, as previously discussed. Finally, the third major assumption of any multiple alignments is that each alignment column includes homologous bases for all species sampled.18 Sequences modify over the course of evolution due to nucleotide substitutions or insertion/deletion events, including indels. For a given marker, such indels will result in sequences of different lengths when compared to orthologous copies from different species or paralogous copies within a species. Thus, the purpose of the sequence alignment procedure is to add indels for comparison of not only homologous genes but also those at a given alignment position (i.e., column) that encloses homologous base pairs between sequences.
A perfect alignment is the assurance that homologous positions are compared throughout the sequences, despite indels that have occurred during their evolution.21 As previously mentioned, in a phylogenetic analysis homology is a critical asset. As variations accumulate between sequences, homology inference becomes more difficult due to homoplasies masking the (synapomorphic) evidence of homology. In fact, the amount of variation among analyzed sequences must be sufficient to unfold their actual evolutionary history, but not so extensive that substitutions are saturated.
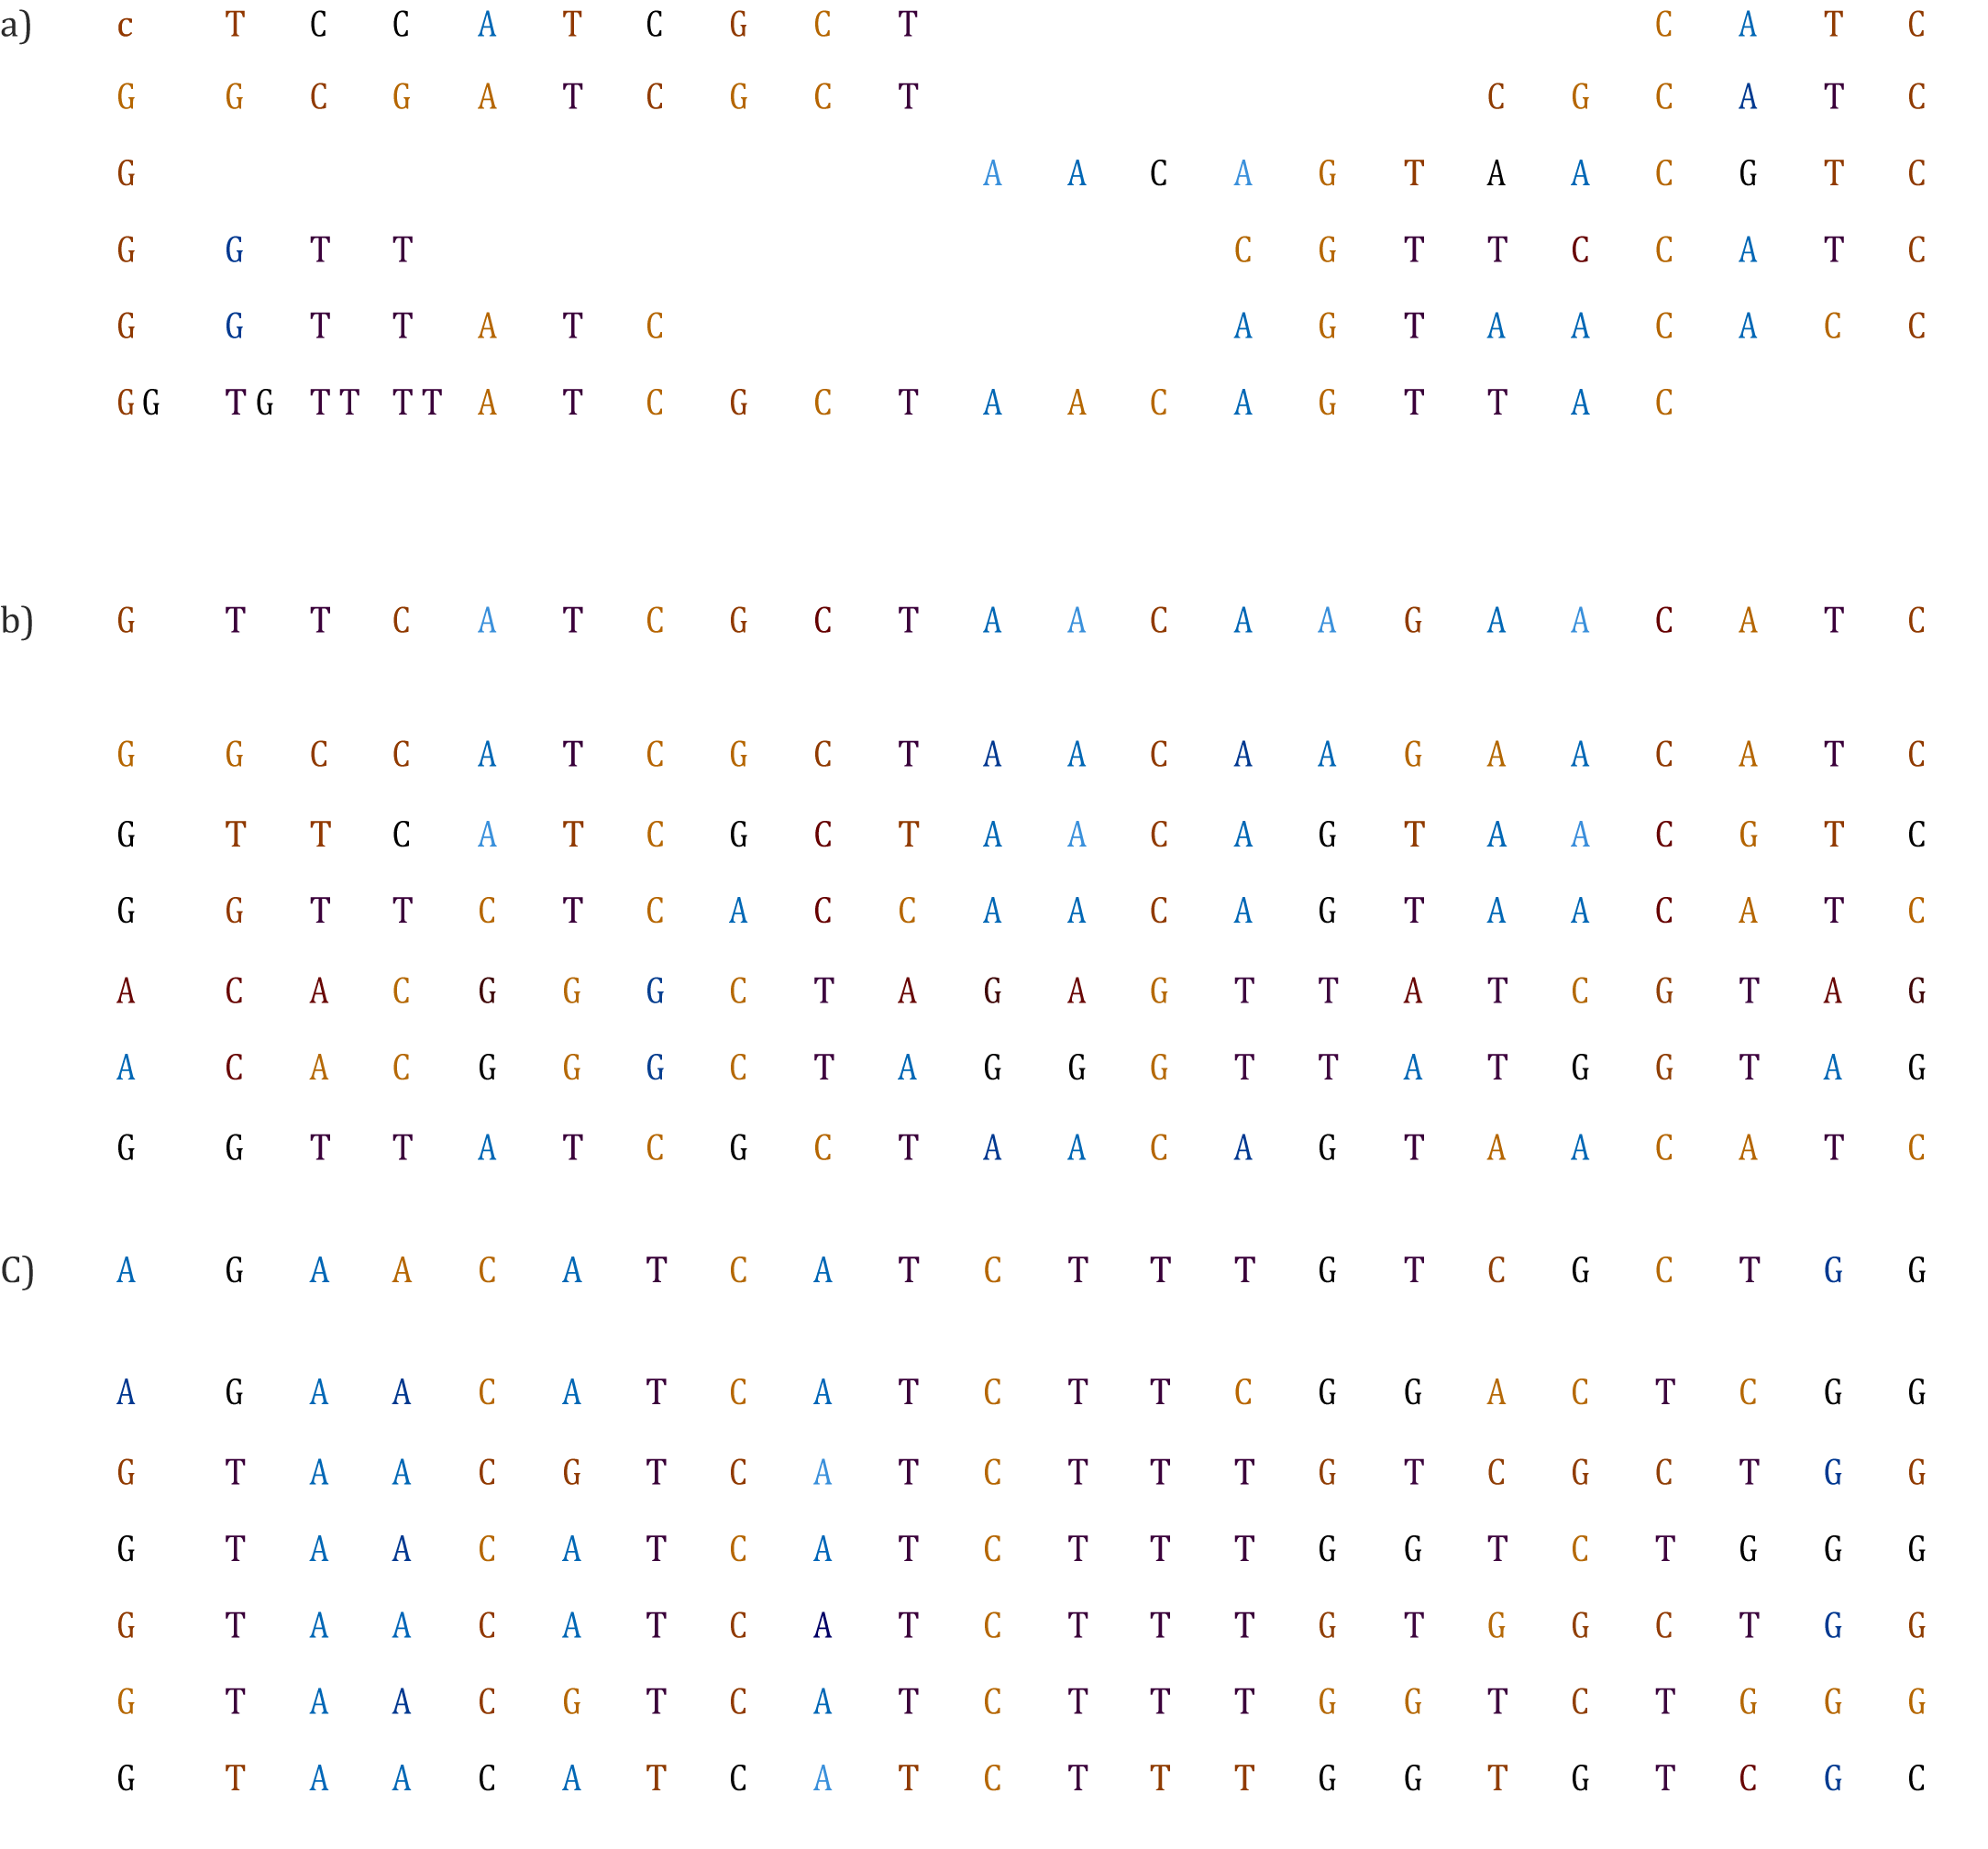
Figure 3a shows an example alignment that is full of indels, indicating that the gene examined evolved quickly in the given diversity set. In this case, the sequences contain so many substitutions that the alignment likely has more substitutions than those that can be directly observed. Hence, when encountering an alignment that resembles this example, it is highly recommended to find more conservative genes to resolve the phylogenetic question.

Figure 3 Three alignments that indicate problems (shaded) for a phylogenetic analysis. a) Too many indels will decrease confidence on homology detection. b) Two sequences are aligned with each other but not with the remaining sequences. c) A portion of the alignment is not aligned properly.
There are many computer programs used to align sequences,36–38 but some authors argue that if a computer is needed to perform an alignment, you should reconsider using those sequences to build a phylogenetic tree. Although this is often an exaggeration, it does bring attention to how crucial the alignment is when constructing phylogenies. Regardless of the alignment procedure, the computer-generated alignment should always be manually checked. However, if the number of possible alignments for a given sequence set is enormous, then the chances of generating incorrect or biased results are considerably high when over-manipulating the alignment.39
It is also possible that one or a few sequences do not fit well in the alignment (Figure 3b). In most cases, such sequences are reversed (or complementary reversed) or misidentified. In order to detect these cases, alignment must be inspected in detail. It is crucial that before proceeding with the phylogenetic analysis, they are perfectly aligned or removed.
Also, in some cases, the alignment is good enough but a portion has an unreliable alignment (Figure 3c), one must consider if there is a definite cutoff for removing that portion of the alignment. For instance, if introns show unreliable alignment, the removal criteria are straightforward and those parts should be removed before the analysis. However, if the region of bad alignment is defined by the user, difficulty arises as to how to avoid subjective analysis. If the region represents less than 10% of the alignment, maintaining the segment should not be necessary and over-manipulation of sequences can be avoided. If the region is more than 10%, the user must eliminate sequence segments in which the alignment homology cannot be guaranteed. In these cases a computer program such as T-Coffee or Gblocks are recommended to avoid subjective manipulation.40
It is important to align each marker individually to verify the reading frame of protein coding sequences or the secondary structure of ribosomal sequences before analysis. In many computer programs, this verification is coded into their algorithm.41 Additionally, flanking positions that have not been sequenced for most individuals should be removed before proceeding with the phylogenetic analysis.
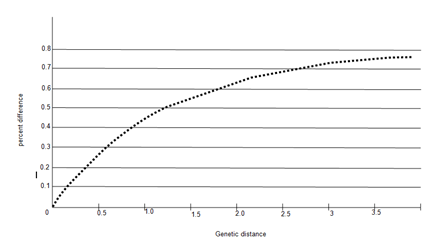
An indicator of the strength of the final alignment for a particular marker is given by calculating the proportion of different sites between sequences. Ideally, the average proportion of different sites should be between 0.1 and 0.3 for all sequence pairs, providing additional confidence that the comparisons are made through homologous positions. If the proportion of difference between sequence pairs is much lower than 0.1, the alignment most likely does not have enough variability to reveal the evolutionary relationships among lineages. In this case, tree topology will tend towards a polythomy, or a tree with no resolution.
Alternatively, if the proportion is much higher than 0.3, a higher degree of saturation and a very complex model of evolution will be required to accurately estimate phylogenetic relationships.42 A complex model has many parameters (G+C content, transition/transversion ratio, etc.), and because each parameter has to be estimated, an error is associated with each particular estimate. Simpler evolutionary models include fewer assumptions and are more robust. If the proportion is higher than 0.7, homology may not be able to be inferred, due to the amount of noise. Because there are only four nucleotide types, we expect that two random sequences by chance will have 25% identical nucleotides.
It should be noted that mitochondrial genomes evolve at a different rate than the nuclear genome. In animals, the mitochondrial genome evolves much faster than the nuclear genome. Thus, it would be best to unfold evolutionary relationships among closely related taxa. However, mitochondrial genomes in plants evolve much slower than the nuclear genome (or any other genome).26,28 Substitutions rates in the chloroplast appear to be slow, although they may vary among groups of plants.43
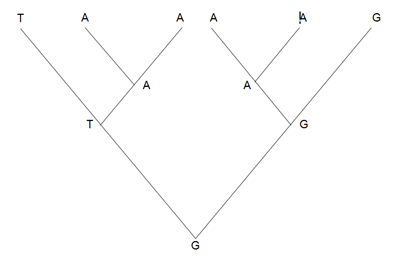
If too much variation is present, third codon positions may be eliminated to lower the noise in the alignment. Nevertheless, eliminating such positions will certainly remove most of the variability of the alignment and may result in the “not enough variation” problem. Moreover, homoplasies at one level may help resolve the tree at a different level.44 More specifically, homoplasies are also homologies at a different level (Figure 4). Hence, removing third codon positions or fast evolving sites is bound to remove positions with phylogenetic signals, diminishing the overall stability of the tree.


Figure 4 The A is both a homoplasy (as it appeared twice in the phylogenetic tree) but it is also a synapomorphy (as it appeared only once in each of the two clades). By removing the A position, both homoplasy and synapomorphies are removed.
It is important to ensure that the out group is perfectly aligned with the in group sequences. If it is too far removed and the alignment is made unreliable by the presence of numerous indels, a more closely related out group must be found. In cases where such out groups are not available, the mid-point technique should be used for rooting the tree without an out group. This method has been shown to perform quite well on empirical data.45
As genetic data banks grow larger, another common practice is the concatenation of genes into a metasequence of many thousand base pairs.46,47 Although statistically reasonable48 and widely employed to minimize sampling error, this technique is not without its shortcomings. In this section, we will go over some important points that should be addressed before selecting the fragments.
Sequence length has a great impact on phylogenetic inferences.49 Random sampling error, or stochastic error, is a statistical definition for a class of errors or uncertainties that might be present in parameter estimates from one measurement to another. These types of errors are particularly sensitive to limited data. Thus, the combined analysis of several base pairs theoretically increases the phylogenetic signal.
However, there is a second class of errors that have a grave effect on phylogenetic inference, the systematic errors. They deserve greater attention in the present-day genomic era.50 Systematic errors are generally defined as errors due to incorrect model assumptions and often result in inconsistent phylogenetic trees.10 The major concern with systematic errors is that they are very difficult to detect, because they are errors associated with the measurement itself.50 For instance, different genes may generate conflicting phylogenetic trees and still show high bootstrap values in combined analyses.10,11 Thus, it is virtually impossible to detect conflicts among individual genes by relying on a single combined analysis.51,52
The issue of missing data versus (taxon and gene) sampling has been a focus of heated debate for over a decade.7,53–55 A gene may be eliminated that has not been sampled for many species, such as genes only sampled in species with full genome sequences available. Alternatively, the entire species may be eliminated if sequences for only a few genes are available. This is the same principle as eliminating fossils from a morphology-based phylogenetic analysis that includes extant taxa. The debate arises on account of the fact that the exclusion of missing data will necessarily eliminate non-missing data as well. Most authors tend to support the inclusion of missing data for phylogenetic purposes.7,41,56
None.
The author declares no conflict of interest.

©2017 Russo, et al. This is an open access article distributed under the terms of the, which permits unrestricted use, distribution, and build upon your work non-commercially.