MOJ
eISSN: 2374-6920


Research Article Volume 4 Issue 1
1Department of Zoology, Karnataka University, India
2Department of Biotechnology, Institute of Bioinformatics and Biotechnology University of Pune, India
Correspondence: Sohan P Modak, Department of Biotechnology, Institute of Bioinformatics and Biotechnology University of Pune, Open vision, 759,75, Deccan Gymkhana, Pune 411004, India
Received: September 07, 2016 | Published: September 27, 2016
Citation: Kumar M, Modak SP. Assessing clade wise concordance between phylogenetic trees and corresponding taxonomic trees. MOJ Proteomics Bioinform. 2016;4(1):174-177. DOI: 10.15406/mojpb.2016.04.00111
Taxonomic trees are based on a large number of characters while phylogenetic trees consider single or multiple traits of a fixed set of species. We compute the clade-by-clade similarity between two trees as Taxonomic fidelity Index (F). In contrast to monogenic traits, the topology of phylogenetic trees increasingly resembles the taxonomic tree.
Keywords: taxonomic tree, phylogenetict, clade, tree topology, clustering algorithm, taxonomic, fidelity index f
Darwin,1 used morphological characters or polygenic traits to describe the hierarchy in complexity among related and distant species although he was unaware of the source of variation. Only later, after the discovery of Mendel’s laws explained that the genetic variations are generated by mutations. Speciation is based on the analysis of the extent of similarity among a wide variety of morphological, physiological, biochemical, genetic, behavioral traits2 allows establishment of evolutionary relationship among organisms that are expressed in form of phylogenetic trees that mimic taxonomic trees. However, a phylogenetic tree based on comparison of a monogenic trait such as specific gene/polypeptide sequences differs from that based on morphological and functional phenotypes/traits that are necessarily polygenic and represent consensus topology.
With the availability of nucleotide- and amino acid sequences the field of molecular systematics has emerged that complemented phylogenetic systematics that provoked the controversy between classical taxonomy and Phylogenetic cladistics.3–11 Indeed, evolution manifests in form of changes in the whole organism and not a single gene, which is subject to random mutations at variable rates and cannot alone affect the principal phenotype of the organism. Instead, one would expect that a number of gene cohorts operating in concerted manner lead to changes in the polygenic phenotype. In contrast to multicellular organism in which all cells develop from the same original founder cell with identical genetic makeup, closely related, but not identical, organisms designated as a different species, will be expected to possess a very similar genetic makeup except for those structures/functions that differ in the DNA or polypeptide script. By aligning such sequence strings, alphabet by alphabet, for the same gene or polypeptide from different organisms allows quantifying the extent of their closeness or differences. To compare multiple species, one carries out multiple sequence alignment wherein the comparison is still carried out between all possible species pairs to obtain a matrix of all-pairs distances that serves as the basis for building a dendrogram / tree.12,13
One, of course, needs benchmarks against which the topology of a given phylogenetic tree is assessed. For example, one such popular benchmark involves 16s ribosomal RNA that is a relatively conserved housekeeping molecule in cells.7 rDNA sequences available from a wide variety of organisms are compared to construct DNA phylogenetic trees and used as to supplement or even supplant classical taxonomic trees.14,15 However, multiple sequence alignment of different biophysical traits, namely, isoelectric points and immuno-cross-reactivity or monogenic traits based on nucleotide sequences of a gene, the coding region in mRNA and amino acid sequences from the same set of species reveal considerable differences in phylogenetic tree topologies leading to controversial interpretations even on the relative phylogenetic position of taxa that are considered as evolutionary links.16–22 One would think that a comparison of entire genome sequences would yield meaningful insight in the evolutionary relationships. While this has yet to happen,23 in depth analysis and visualization of genomic signatures based on the fractal structure of nucleotide sequences do reveal considerable phylogenetic differences.24,25 In any case, these need further analysis to elucidate the positional differences in the frequencies of occurrence and localization of discrete nucleotide sequence clusters in entire genomes. The issue is complex as major portion of genomes of eukaryotes with increasing complexity contain variable amounts of coding as well as noncoding sequences; the latter involve a variety of repetitive sequences that act as structural signals as well as positional and functional signals within and flanking the coding regions in order to render these retrievable. Finally, there exists the extreme case of the C-value paradox illustrated by dramatic differences in the size of haploid genome of Triturus cristatus with 7 times more DNA than Xenopus laevis, although both contain the nearly identical amount of coding sequences Rosbash et al.26
It is reasonable to assume that, unlike the phylogenetic trees based on single traits, the topology of trees based on comparison of multiple traits would offer a consensus representation approaching relationships in classical taxonomic trees. Recently, this has been attempted by concatenation, or end-to-end ligation, of aligned nucleotide sequences of multiple genes aligned amino acid sequences to generate large polyphenic strings for comparison to construct phylogenetic trees. However, this method requires a selection of known representative sequences that are aligned in a specific order before concatenation in order to avoid low computational efficiencies in comparing long strings.18,20,22 During past 13years, we have been constructing phylogenetic trees using a novel method that compares multiple sets of polygenic traits or parameters (e.g., MW, pI, Immuno-cross reactivity) as well as monogenic traits such as nucleotide- and amino acid sequences.13,16–18,27 In this method, using Euclidean geometry we determine all pairs distances for a consortium of at least three traits/parameters, such as3 mitochondrial polypeptides for a set of 74 eukaryotes with emphasis on the phylogeny of mammals and protochordates,18 to construct a phylogenetic tree that can be visualized in either 2- or 3-dimensional space. More recently, we have constructed phylogenetic trees by comparing and 15 aminoacyl tRNA synthetase sequences from 119 prokaryotes to achieve a polygenic ‘consensus’ topological representation of phylogeny that near-parallels the classical polygenic taxonomic trees.27 Indeed, comparing trees for individual tRNA synthetases, rDNA alone, a consensus tree for 15 aminoacyl-tRNA synthetase sequences and the classical taxonomic tree, we found that the consensus tree for 15 synthetases is the closest to the classical taxonomic tree while trees for individual tRNA synthetase or 16s rDNA exhibited substantial differences in the tree topologies at the level of clades of families and even genera.27 It is in this context, that we have developed a method that carries out clade-by-clade comparison of uniparamettric or multiparametric phylogenetic trees with classical taxonomic trees as benchmarks. Here, we describe the method that allows assessment of the relative closeness between a phylogenetic tree and taxonomic tree for the same species, based on a clustering algorithm for Taxonomic Fidelity (F).
Estimating taxonomic fidelity of phylogenetic trees
Phylogenetic trees constructed using different parameters differ substantially in their topologies. Therefore, it is necessary to validate the fidelity of clades (a group consisting of an organism/ancestor and all its descendants) in a phylogenetic tree against a known classification scheme such as taxonomy. Here, a Taxonomic Clade is the group of species consisting of an ancestor and its descendant/s from an established taxonomy, while a Phylogenetic Clade is the group of species from a phylogenetic tree. Taxonomic fidelity of a phylogenetic tree should reflect the extent of topological similarity with the corresponding taxonomic tree. The taxonomic fidelity is estimated using the equation
F=z/(x+y-z)
where, F-the fidelity, z-number of species common to the Taxonomic clade/s and the corresponding Phylogenetic Clade/s, x-number of species in “Taxonomic Clade” and y-number of species in “Phylogenetic Clade”. There are three possible cases one can expect when these two trees are compared.
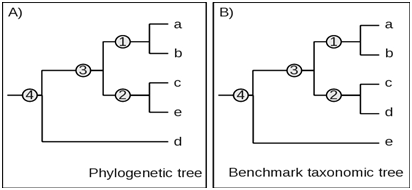
Case I-identical
When the clades and tree topology in both phylogenetic tree and the corresponding benchmark taxonomic tree are identical, obtain the representation as In Figure 1. Here, the members of mammalian clade/s, Human, Monkey, Rat and Mouse are identical in both phylogenetic tree and benchmark taxonomic tree. Therefore applying the number of species in equation 1 we get the following results for mammalian clade
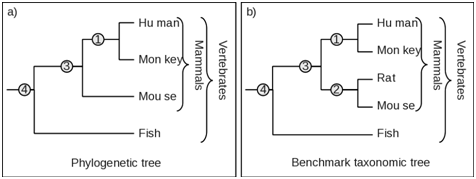
Case II–missing
One or more species from the phylogenetic tree are missing. For example, as seen in Figure 2, the rat is missing from the mammalian clade in the phylogenetic tree and has been displaced elsewhere or associated with altogether different clade. We therefore estimate the Fidelity F as follows

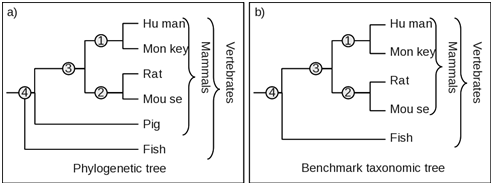
Case III–additional
One or more species have been added to a clade in the phylogenetic tree but absent in the corresponding clade in the taxonomic tree. As shown in Figure 3, the taxonomic clade number 4 contains four species, while the corresponding clade in the phylogenetic tree has the pig in addition to other four mammals. Therefore for the estimation of Fidelity F, is based on

Implementation

Thus, the maximum expected fidelity F=1 when all taxa in a given phylogenetic clade are at similar or identical position in the corresponding taxonomic clade.
The maximum score any phylogenetic tree can obtain is the same as the number of possible taxa in benchmark taxonomic tree. Therefore, greater the total taxonomic fidelity score of a phylogenetic tree, closer it is in the topology to the taxonomic tree.
None.
The author declares no conflict of interest.

©2016 Kumar, et al. This is an open access article distributed under the terms of the, which permits unrestricted use, distribution, and build upon your work non-commercially.