MOJ
eISSN: 2373-4442


Research Article Volume 4 Issue 4
1Department of Medical Laboratory Sciences, School of Allied Health Sciences, College of Health Sciences, University of Ghana, Ghana
2The Central Medical Laboratories, Korle-bu Teaching Hospital, Ghana
Correspondence: Samuel Antwi-Baffour, Department of Medical Laboratory Sciences, School of Allied Health Sciences, College of Health Sciences, University of Ghana, P. O. Box KB 143, Korle-Bu, Accra, Ghana,
Received: January 01, 1971 | Published: November 29, 2016
Citation: Antwi-Baffour S, Kyeremeh R, Adjei J, Aryeh C, Kpentey G, et al. (2016) Plasma Membrane- Derived Vesicles Shows Effects on the Induction of Differentiation of Promonocytes into Macrophages: A Possible Cancer Therapy. MOJ Immunol 4(4): 00135. DOI: 10.15406/moji.2016.04.00135
Background: Acute promyelocytic leukaemia (APL) represents 5–15% of all adult leukaemias. One of the approaches to treat APL is differentiation therapy which works by inducing differentiation of leukaemic promonocytes into mature non–replicative cell types that eventually undergo apoptosis. Plasma Membrane–derived Vesicles, (PMVs) are a heterogeneous group of small, membrane–coated vesicles with phospholipid rich particles, membrane receptors as well as other proteins inherent in their parental cells. There is evidence that PMVs are involved in differentiation in the hematopoietic environment in the bone marrow which suggests a possible involvement in leukaemia myeloid development, and possibly monocytic haematopoiesis. This work aimed to show principally whether PMVs can initiate differentiation/stop proliferation in HL–60 cells (promonocytes) and cause their differentiation into macrophages. This way, PMVs can be considered for differentiation therapy.
Methods: PMVs were induced from cells using differential centrifugation. We also employed flow cytometry, ELISA, fluorescent microscopy analysis, SDS–PAGE, western blotting, growth inhibition & differentiation assays, nitroblue tetrazolium assay and cell cycle analysis to conduct our experiments.
Results: HL–60 cells treated with PMVs showed a dose–dependent increase in adherence and increased expression of CD11b and CD14 as a sign of differentiation. Morphological changes were induced in HL–60 as well as phosphorylation of the TGF–b/Smad signaling pathway upon treatment with PMVs. Again, TGF–b1–bearing PMVs reduced the proliferation of HL–60 cells and caused them to exit the cell cycle at G0/G1. It was also shown that PMVs from HL60 or THP–1 cells but not from MCF–7 cells significantly reduce the growth rate of HL–60 cells and the reduction in proliferation was dependent on TGF–b1 delivered by the PMVs.
Conclusion: This work showed that PMVs (isolated from HL–60 and THP–1 cells) carry TGF–β1 on their membrane surface. These TGF–β1–bearing PMVs can modulate the growth rate of HL–60 promonocytes without inducing apoptosis, the cells exiting the cell cycle at G0/G1. In addition, dramatic changes in the morphology of PMV–treated cells were observed as they became increasingly irregular in shape with membrane extensions resembling pseudopodia. It might therefore be prudent to look at PMV–releasing agents, as potential alternative drugs in differentiation therapy against APL.
Keywords: promyelocytic, leukaemia; pmvs; differentiation, aml, therapy, apl, cancer, mrna, hl–60 cells
APL: Acute Promyelocytic Leukaemia; PMVs: Plasma Membrane–Derived Vesicles; AML: Acute Myelogenous Leukemia; TGF–β1: Transforming Growth Factor–β1; TB: Transfer Buffer; NBT: Nitroblue Tetrazolium
Acute promyelocytic leukaemia (APL) a subtype of the acute myelogenous leukemia (AML) from which the promonocytoid leukaemia HL–60 cell line is derived, represents 5–8% of AML in adults and 5–15% of all adult leukaemias.1 The various approaches to treat APL in which blast cells are unable to mature into adult cells include differentiation, apoptosis induction and cytotoxic agent therapy.2 Differentiation therapy, works by inducing differentiation of leukaemic promonocytes into mature non–replicative cell types that are undergoing cell cycle arrest and eventually undergo apoptosis.3 Retinoids such as all– transretinoic acid (ATRA) which are used in differentiation therapy to treat promyelocytic leukaemia (APL) specifically target neoplastic cells leaving normal mature cells unaffected.4 Other inducers of differentiation (to granulocytes as well as monocyte/macrophage) in myeloid leukaemia cells include vitamin D3, the phorbol ester, 12–Otetradecanoylphorbol–13– acetate (TPA) also commonly known as phorbol 12–myristate 13–acetate (PMA) and calcium ionophore (A23187).5
Microvesiculation is a ubiquitous cellular mechanism, which occurs as a result of exocytosis, to release exosomes (between 50–100nm) or by direct release of vesicles from the cell surface membrane, referred to, in this study as Plasma Membrane–derived Vesicles, PMVs (0.1–1μm).6,7 Various changes in cell physiology are involved in the release of cellular PMVs (reviewed elsewhere.8) but an increase in intracellular calcium and a loss of lipid asymmetry in the plasma membrane are always the initial sign of microvesiculation.8 In vitro, PMV release can be initiated by sublytic complement deposition and calcium ionophore A23187. Unlike apoptotic bodies, which are derived from damaged cells, PMVs, released from healthy viable cells are smaller in size and do not contain damaged DNA.9 Instead, PMVs carry microRNA, mRNA, numerous membrane proteins, lipids and cytoplasmic constituents, characteristic of their parental cell and being able to transmit such proteins between cells, makes it an important mediator of intercellular communication.9,10
In experiments using THP–1 cells, microRNAs have been shown to be involved in monocytic differentiation so it may be pertinent to HL–60 differentiation that PMVs carry microRNAs.9,11 In other studies involving the chronic myeloid leukaemia (CML) cell line, K–562, PMVs carrying hedgehog (Hh) proteins could induce their differentiation towards the megakaryocytic lineage.12 Most recently PMVs derived from embryonic stem cells (ESC) were found to carry Wnt–3, which is involved in hematopoietic differentiation, and such PMVs were shown to reprogramme hematopoietic progenitor cells.8 This evidence, that PMVs, albeit from ESC, are involved in differentiation in the hematopoietic environment in the bone marrow, thus suggests possible PMV involvement in leukaemia myeloid development, and possibly monocytic haematopoiesis, and needs to be investigated further.
This work aims to show principally whether PMVs can initiate differentiation/stop proliferation in HL–60 cells. From surveying the literature, such PMV–mediated differentiation would likely be a multifactorial process involving several proteins and microRNAs. Amongst the many factors PMVs harbour and numerous PMV–associated cytokines revealed by proteomics studies, is the multifunctional transforming growth factor–β1 (TGF–β1), which is found principally associated with platelet PMVs and which inhibits the proliferation of various cell types in vitro.13 Given the important role TGF–β1 plays in the regulation of cellular proliferation, and its autocrine inhibition of proliferation in the APL cell line, we asked whether any growth regulation and differentiation of promonocytic leukaemia cells could in part be influenced by PMVs bearing TGF–β1, that are released from cells by the action of known differentiation therapeutics.14 If so, this would be one of the early reports of TGF–β1 carried on the surface of a PMV that was deliverable as a functional signalling molecule.
FACS analysis (flow cytometry)
All the experiments that involved FACS analysis were done on a Guava EasyCyte flow Cytometer.
Fluorescent microscopy analysis
For fluorescent microscopy, all experimental samples were placed into plates containing cover slips by centrifugation (200g, 5min, using an A–2–DWP rotor, in a 5804R centrifuge, Eppendorf) and fixed with 4% paraformaldehyde at 37 °C for 10 min. Plates were gently washed twice with PBS and cover slips mounted on microscope slides with DAPI– VECTASHIELD medium (Vector Laboratories Inc. Burlingame, CA).
PMV induction from cells – differential centrifugation
In the experiments to induce PMV release, cells with a viability of ≥95% were used. Cells
(1x10⁶) were washed twice at 160g for 5min and resuspended in 1ml of fresh pre–warmed RPMI 1640. 2mM CaCl2 was then added to the cell suspension. The requisite amounts of the inducing agents (10% normal human serum.NHS and PMA) were then added and the cell preparation incubated at 37 °C in a water bath (with shaking) for 30 minutes. After incubation, the reaction was stopped by placing the tubes on ice. In order to remove cells, the cell suspension was centrifuged at a low speed of 160g for 5 min. The supernatant was then collected and transferred to another tube and centrifuged at a higher speed (4000g, 60 minutes) to remove any cell debris. The resultant supernatant was sonicated in a sonicating water–bath (Townson and Mercer Ltd, Croydon) for 5x1 min in order to disperse aggregated exosomes. It was then centrifuged at 25,000g for 90 min to the pellet PMVs. The supernatant was discarded and the pellet containing the PMVs resuspended in 200μl PBS for onward use.
SDS–PAGE and western blotting
Protein extracts were prepared and either analysed by SDS–PAGE or by Western blotting.
Reduced samples (with 20 or 50 mM DTT) and nonreduced samples were prepared in SDS– PAGE loading buffer. Extracts for Western analysis was conducted by homogenizing them in a Dounce homogenizer in 150μl of RIPA (1% Nonidet P–40, 0.5% sodium deoxycholate, and 0.1% SDS in PBS) in the presence of protease inhibitors. After centrifugation (14krpm for 10 min), the supernatant was respun as above. For lysates, Extracts were suspended in 0.75 ml of lysis buffer (PBS with 1% (v/v) Nonidet P–40 and 5 mM EDTA (pH 8)). After adding protease inhibitors (0.2mM PMSF, 4mM aminoethylbenzenesulfonylfluoride (Pefabloc), 1mM NaF, 5μg/ml aprotinin, 4mM benzamidine) (all Sigma–Aldrich), the extracts were mixed gently and incubated on ice for 10 min. After low–speed centrifugation (250g; 5 min), the supernatant was respun (25,000g; 25 min), and aliquoted and stored (–80 °C). Before running samples they were diluted 2:1 in sample buffer (3 ml glyereol; 1.5 ml 20% (w/v) SDS; 3 ml 2–Mercaptoethanol; 1% (w/v) bromophenol blue diluted in 0.5M Tris base, pH6.8), then boiled for 5 min to denature the proteins.
1SDS–PAGE
Having assembled the glass plates according to the manufacturer’s instructions (Bio–Rad, Mini Protean II) acrylamide solution was prepared to generate a 10% gel (10 ml acylamide/bisacrylamide.30 %/0.8 %; 7.5 ml Tris–HCl 1.5 M, pH 8.7; 12.08 ml distilled water; 0.3 ml 10% SDS). After adding APS (0.1ml of a 10 % solution) and TEMED (N, N, N’, N’–tetramethylethylenediamine) (0.02ml), the mixture was swirled vigorously and poured between the plates. This was carefully overlaid with isobutanol to prevent oxygen inhibition of polymerization. Upon polymerization, removal of isobutanol and washing, the stacking gel is prepared (1.3ml of acrylamide/bisacrylamide.30 %/0.8 %); 2.5ml Tris–HCl, 0.5 M, pH 6.8); 6.07ml distilled water; 0.1ml 10% SDS; 0.02ml 10% APS and 0.01ml TEMED. This mixture was poured onto the polymerised stacking gel together with the comb and left to polymerise. After removal of the comb, running buffer was added into the electrophoresis tank, bubbles removed from the gel and the samples (1–10mg) loaded using a long narrow tip. The gel was run with a constant voltage (up to 15V/cm) until the bromophenol blue had reached the bottom of the gel.
Western blotting
Having separated proteins by SDS–PAGE, a PVDF membrane was soaked in absolute ethanol for 1 min. In a tray of transfer buffer (TB) the following were laid: SDS–PAGE gel; 2 porous pads; 2 pieces of thick filter paper; PVDF membrane cut to the size of the gel. After 10 min, onto the cathode electrode, soaked with TB were placed the porous pad, filter paper, gel, PVDF membrane, second filter paper, second porous pad and finally the anode electrode. The sandwich was placed in the transfer tank and run for 1h at RT at 0.65 mA/cm2. The membrane was then blocked in Tris–buffered saline with 3% non–fat milk for 2h at RT. The primary antibody (10 mg/ml or 1:1000 for anti–P–Smad 2 [Cell Signalling Technology) was added for 1h at RT, the membrane washed with TBS–0.1% Tween20 (6x10 min washes). The secondary HRP antibody (anti–rabbit) was then added (1:5000 dilution) for 1h at RT. After washing, detection was by chemiluminescence using the ECL kit (Amersham) using a UVP ChemDoc–It system (UVP systems, UK). Positive expression was semi–quantified using ImageJ software to calculate the mean intensity of the antigen.
Growth inhibition assays
HL–60 cells in the exponential phase were washed twice with RPMI 1640 and resuspended in growth medium containing 5% FBS. Cells were seeded into 12–well plates at 1x10⁵ cells/well in triplicate. Different concentrations of PMVs and proliferation inhibiting agents such as PMA (except controls) and plates were incubated at 37 °C for three days. On the days indicated, nonadherent cells were removed and counted by ViaCount assay on a Guava EasyCyte flow cytometer. In some experiments, HL–60 cells were incubated with
30μg PMVs alone or in the presence of the TGF–β receptor antagonist, SB–431542 (10μM) or with 25μg/ml affinity purified, neutralising rabbit anti–TGF–β1 (Genway).
Differentiation assays
Adherence of cells was determined following treatment with 30μg of PMVs. On the day of the experiment, 1x10⁵ cells/well were seeded into 12–well culture plates in triplicate. On each of the indicated days, the non–adherent cells were transferred into new plates and incubated at 37 °C in a 5% CO2 incubator. The wells were then washed twice with serum–free RPMI 1640 and the attached cells released with trypsin/EDTA (Sigma–Aldrich). The trypsinised cells, now in suspension were collected by centrifugation (200g, 5min), stained with ViaCount reagent and counted by flow cytometry. To investigate differentiation, HL–60 cells were seeded into 12–well plates in triplicate. Cells were left untreated (control) or treated either with 30μg PMVs or with PMA (0.1μM) and incubated at 37 °C in a humidified atmosphere of 5% CO2 for three days. After this time, cells, still in suspension were removed and the plates washed three times with RPMI 1640. Cells attached to the bottom of the plates were immuno–labelled at 4 °C for 1h with the antibodies, anti–CD14–FITC, anti–CD11b– PE and anti–DC–SIGN–FITC with IgG–FITC and IgG–PE isotypes being used as controls. After three washes with PBS, cells were placed in PBS, 1% BSA and relative fluorescence determined using the FLUOstar Omega microplate reader (BMG Labtech, UK).
Nitroblue Tetrazolium (NBT) assay
Nitroblue tetrazolium (NBT) (Sigma Aldrich) was used to determine intracellular O2– as a measure of differentiation. For this assay, cells seeded at ~5x10⁵ cells/ml in 24–well plates were treated for 1h at 37 °C with 1mg/ml NBT and 4μg/ml PMA. After washing in PBS the cell pellet was dissolved in 100μl DMSO and the absorbance read at 570nm on a spectrophotometer.
Quantitation of TGF–β1 by ELISA
PMVs were isolated from HL–60 cells stimulated with 10% NHS at 37 °C for 30 min. The concentration of TGF–β1 was measured by using 30μg of protein in ELISA kits (R&D Systems) according to the manufacturer’s instructions. In some experiments, PMVs (1x10⁵/reaction), in triplicate, from HL–60, THP–1 and MCF–7 cells were lysed before measuring TGF–β1 levels.
Cell cycle analysis
HL–60 cells (1x10⁶) in cold PBS were fixed in cold 70% ethanol. After washing in PBS, cells were stained with propidium iodide (50μg/ml) for 1h at 4 °C and analysed using a FACSCalibur flow cytometer (BD Bioscience San Jose, CA, USA) according to the manufacturer’s instructions. The percentage of the population in G0/G1, S and G2/M phases of the cell cycle was determined using CellQuest software (BD Bioscience) and represented in GraphPad Prism 5.0 (San Diego CA, USA).
Fluorescence microscopy of PMV–cell interaction using R18– (octadecyl rhodamine–) labelled PMVs
HL–60 derived PMVs were labelled with octadecyl Rhodamine chloride (R18) by treating PMVs with 1.37mM of an ethanolic solution of R18 (containing a final concentration ≤ 1% v/v) for 1 h at RT in the dark. R18–labelled PMVs were separated from unincorporated R18 by ultracentrifugation at 100,000g for 1h followed by dialysis in 14 kDa dialysis tubes at 4 °C in HEPES/NaCl buffer. The ratio of R18 to PMVs was estimated measuring the fluorescence before and after removal of the unincorporated probe. HL–60 cells were incubated with R18– labelled PMVs for 10 min at 37 °C, followed by three washes in PBS. The cells were fixed in 4% paraformaldehyde in PBS for 15 min. The cells were then washed five times and mounted on slides with Vectashild mountain medium (Vector Laboratories). For fluorescence microscopy, an Olympus IX81 inverted microscope, equipped with a monochromatic camera U–CMAD3, was used. Images were subsequently coloured using the Cell^M imaging software (Olympus).
HL–60 cells treated with PMVs differentiate along the monocyte/macrophage lineage
In this experiment, NBT reduction capacity was measured as an indicator of superoxide and therefore of HL–60 cellular differentiation. From Figure 1, it can be seen that the reduction of the blue formazan salt which was measured spectrophotometrically (A560) at time 0h was almost similar whether cells had been exposed to PMVs or not. After 24h however, there was a higher increase in NBT reduction where cells had been treated with PMVs than without, and this became even more pronounced after 72h.
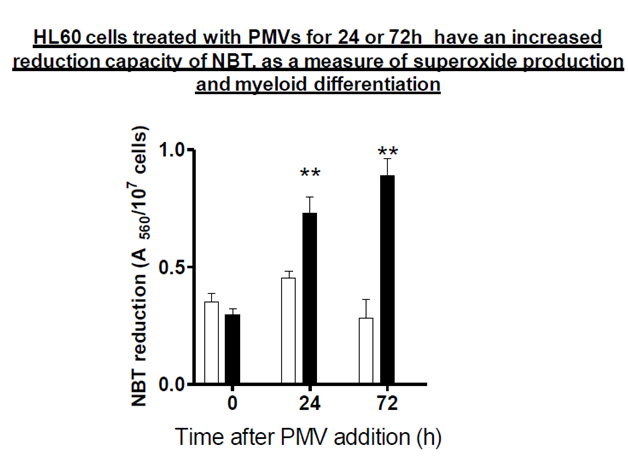
Figure 1 NBT (nitroblue tetrazonium) reduction assay to show differentiation of HL-60 cells. 1x10⁵ cells were treated with PMVs for 24 and 72h. At these time points, they were stimulated with 1µM PMA and incubated with 1 mg/ml NBT for 30 min at 37 °C. They were then dissolved in DMSO and measured spectrophotometrically (A650) for reduction of blue formozan salt. Clear bars represent untreated, control HL-60 cells and filled bars HL-60 cells treated with 30 µg PMVs.
HL60 cells treated with PMVs show a dose–dependent increase in adherence after 24h
The ability of cells to adhere to specific surfaces is vital in the process of proliferation and differentiation as it elicits a multitude of intracellular events, which occur in response to signals that originate at the surface of the cell and are then propagated by diverse biochemical pathways (Hynes R0 and Lander AD 1992). Cellular differentiation is accompanied by adherence, and to show that cells may have differentiated, it is also important to demonstrate adherence. As seen in Figure 2, PMVs were able to cause HL–60 cells to adhere to the culture plate in a dose–dependent manner with increasing amounts of PMV ranging from 5 to 30 µg. PMA which is an efficient inducer of terminal differentiation was used as a positive control and showed a doubling of adherence albeit less than that achieved using 5µg PMVs.
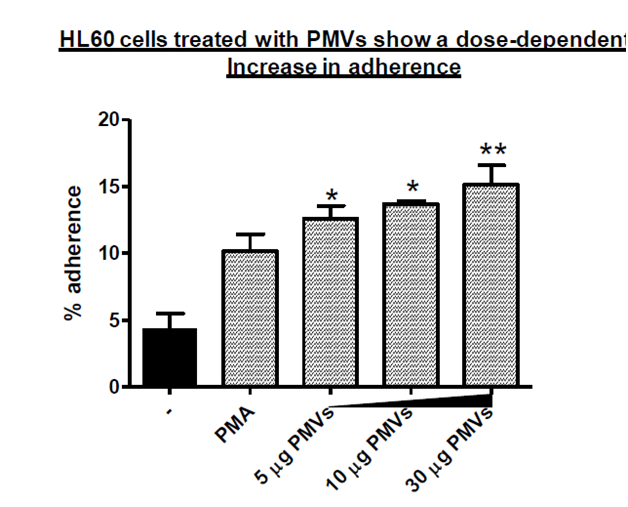
Figure 2 HL-60 cells (1x10⁵/ml) were treated with 5, 10 and 30 µg PMVs in a 24-well plate, in triplicate and after 24h the percentage adherence determined. The positive control cells were treated with PMA to induce terminal differentiation.
PMV treatment of HL–60 cells induces increased expression of CD11b and CD14
When cells are differentiated along the monocyte/macrophage lineage, they show increased surface expression of CD14 and CD11b. If differentiation is along the dendritic cell lineage, then they express DC–SIGN (CD209). HL–60 cells were induced to differentiate using 30µg of PMVs or PMA by way of positive control for monocyte/macrophage differentiation, and tested for surface expression of CD14 and CD11b by measuring Mean Fluorescence Intensity. As can be seen in Figure 3A&B, there was a significant increase in expression of CD14 and CD11b, (also shown in Figure 3D&F) compared to untreated controls. From Figure 3C, the expression of DC–SIGN (CD209), a marker of differentiation along the dendritic cell lineage was negligible in the experiments with PMVs but showed a minimal expression level upon PMA treatment.
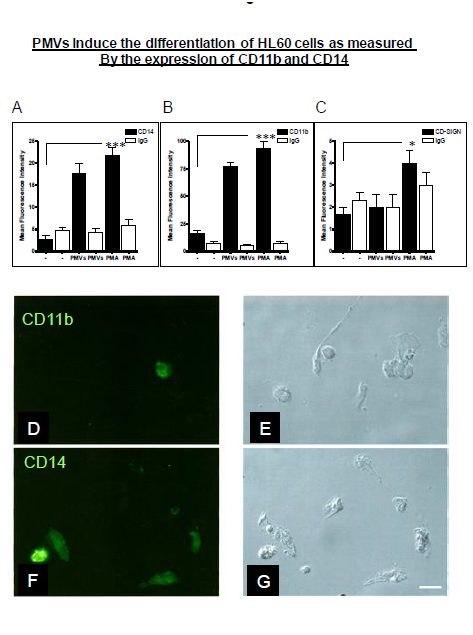
Figure 3 HL-60m cells were treated with PMVs (30 µg) or PMA. Mean Fluorescence Intensity as a measure of surface expression levels was monitored. In the case of CD14 (A) and CD11b (B), as indicators of differentiation along the monocyte/macrophage lineage, there was a significant increase in expression, compared to untreated controls. However, expression of DC-SIGN (CD209) as a measure of differentiation along the dendritic cell lineage was negligible (C). Differentiating HL-60 cells expressing CD11b and CD14 are also shown (in D- F) by Immunofluorescence microscopy, bright fields (BF) and (G). Bar, 10 µm.
Morphological changes of HL–60 cells induced upon treatment with PMVs
When cells are induced to undergo differentiation, dramatic changes in the morphology occur which can be monitored as a sign of differentiation. For example, cells can become increasingly irregular in shape with membrane extensions resembling pseudopodia. Upon treatment of HL–60 cells with PMVs or vitamin D3, rapid changes in cell morphology, could be observed within 12h, the cells showing formation of aggregates (Figure 4A&B). After 24h and 28h, the cells began to show signs of developing pseudopodia ((Figure 4F&G), respectively) as with vitamin D3 (Figure 4I&J) compared to control. By 72h there were clear signs of differentiation (Figure 26H for PMV treatment and K for vitamin D3 treatment. Controls are shown in Figure 4C,D&E.
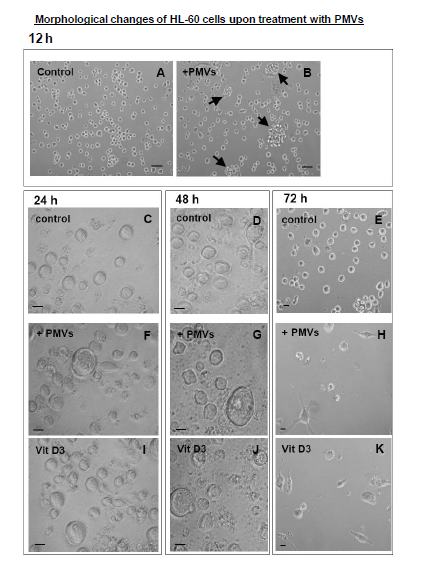
Figure 4 Treatment of HL-60 cells with PMVs or vitamin D3 resulted in rapid changes in cell morphology, within 12h the cells showing formation of aggregates (A and B). 24h after treatment with PMVs (30 µg) the cells begin to show signs of developing pseudopodia (F,G); similarly upon vitamin D3 (I,J) treatment, compare to control, By 72h there were clear signs of differentiation (H for PMV treatment and K for vitamin D3 treatment). Controls are shown in C, D, and E. Bars A, B, 20 µm. Bars C-K, 10 µm.
PMV treatment of HL–60 cells causes phosphorylation of the TGF–b/Smad signaling pathway
Depending on the stimulus, cellular differentiation is mediated through different signaling. In resting cells, Smad2 is present in its unphosphorylated form but is highly phosphorylated (P– Smad2) when induction of cellular differentiation is through the monocyte/macrophage pathway as opposed to the neutrophil or dendritic pathways. An experiment was carried out to show whether PMV–mediated differentiation of HL–60 is along the monocyte/macrophage pathway, which is accompanied by the phosphorylation of the TGF–β/Smad signalling pathway. If the differentiation was along any other pathway, then Smad2 would not be phosphorylated. As shown in Figure 5A, increased expression of P–Smad2 was detected when cellular differentiation was caused by PMVs and vitamin D3 as compared to the negative control (no addition of PMVs) or upon treatment with ATRA, which induces differentiation along the neutrophil pathway. At the same time we can see almost equal expression of the unphosphorylated form (total Smad2) in all the tests. An increased expression of P–Smad2 upon differentiation with PMVs was also visualized by immunofluorescence microscopy, Figure 5B.
To give an estimation of P–Smad2 immunoreactivity in addition to the data in Figure 5A, obtained by immunoblotting of HL–60 lysates before and after addition of PMVs, image J software was employed to semi–quantifiy the expression of P–Smad2 on cells as obtained by immunoflourescence microscopy Figure 5B. Essentially this was used to calculate the area percentage and mean intensity of P–Smad2 immunoreactivity in the nucleus, obtained in ten microscopic fields of view. The mean, taken and illustrated graphically using GraphPad Prism 5.0, in Figure 5C, implies an increase in phosphorylated Smad2 expression in HL–60 cells upon treatment with PMVs.
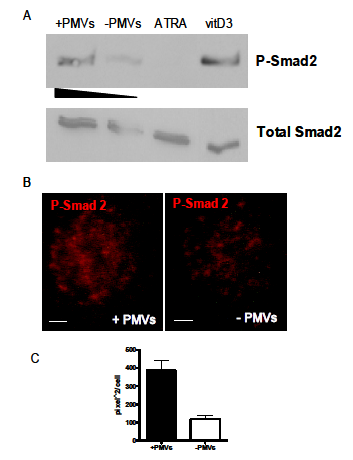
Figure 5 HL-60 cells treated with PMVs or differentiated along the monocyte/macrophage lineage by treatment with vitamin D3 have increased levels of phosphorylated Smad2. The level of expression of Smad2 (total Smad2) was used as a control for the level of phosphorylated Smad2 (P-Smad2). This compares with negligible expression (control, no PMVs) and upon ATRA treatment (differentiation to neutrophils) (A). In (B), P-Smad2 expression was also increased in HL-60 cells after treatment with PMVs, as seen by Immunofluorescence microscopy. Bar represent 2 µm. (C) shows the P-Smad2 immunoreactivity estimated by ImageJ software.
TGF–b1–bearing PMVs reduce the proliferation of HL–60 cells
PMVs from HL60 or THP–1 cells but not from MCF–7 cells significantly reduce the growth rate of HL–60 cells
In a previous experiment (data not shown) it was seen that inducers of monocyte/macrophage differentiation such as PMA stimulate the release of PMVs from HL–60 cells and that these increasing levels of released PMVs seem to result in decreased proliferation levels. It was noted that these PMVs would have been from only one cell type, HL60, so it was decided to treat HL–60 cells with PMVs isolated from different cell types, HL– 60, THP–1 or MCF–7, or else left untreated. The cells were incubated at 37 °C and quantified each day by flow cytometry. From Figure 6, PMVs from HL–60 and THP–1 cells were more effective at reducing the growth rate than MCF–7 (breast cancer cell line) PMVs which resulted in normal growth close to control levels. As a result, it was clear that it was neither the release process or the PMVs themselves, regardless of which cell they were derived from that was important in inducing differentiation, but that the protein or some other factor (such as micro RNA) content of the PMVs may be important.
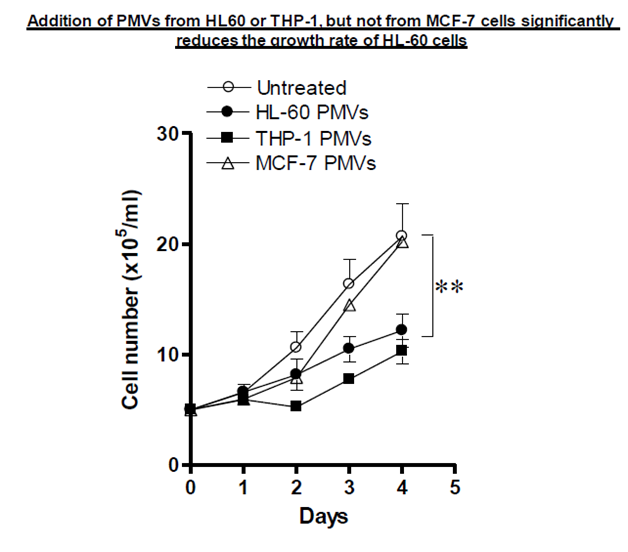
Figure 6 Application of PMVs (30 µg) from HL-60, THP-1 and MCF-7 cells to HL-60 cells (5x10⁵ cells/ml) was monitored using the Guava EasyCyte flow Cytometer for its effect on the growth of HL-60 cells over 5 days.
PMV treatment of HL–60 cells causes them to exit the cell cycle at G0/G1
For growing cells to differentiate, they need to undergo a growth arrest at some point usually the G0/G1 stage. It was observed, in section 3.6.1, that PMV–treated HL–60 cells had significantly reduced cell numbers after 3 days in culture. If therefore PMVs were causing the differentiation of HL–60 cells, they would first of all arrest the cells (at G0/G1) and then induce differentiation. To show whether this was the case, 30μg of HL–60 PMVs were added to HL–60 cells and propidium iodide (PI) staining analysed using a Guava EasyCyte flow cytometer. As Figure 7A shows in comparison to controls, more cells were calculated to be in the S stage followed by those in G0/G1 and G2/M after 12 h. However, after 48 h almost all the cells were found to be in the G0/G1 stage the time frame at which differentiation begins to occur and when proliferation begins to diminish compared to untreated controls (section 3.6.1). Figure 7B and C shows the level of PI staining after 48 h for control (B) and upon PMV addition, which are summarised in Figure 7A.
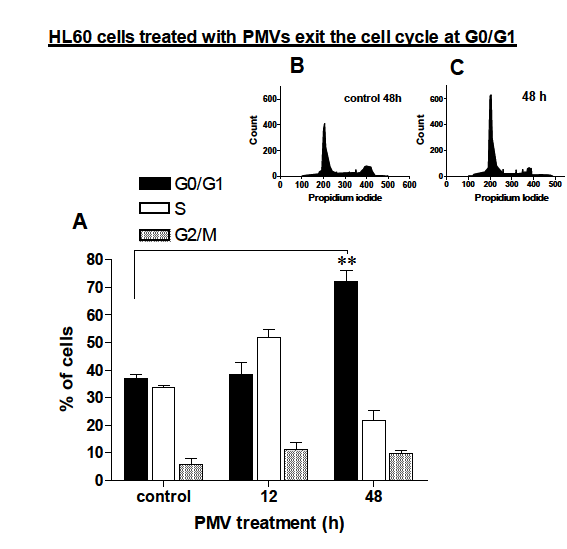
Figure 7 HL-60 cells were treated with 30 µg of HL-60 PMVs after 12 and 48h analysed for their stage in the cell cycle by measuring propidium iodide staining in a Guava EasyCyte flow Cytometer. A, shows a summary bar chart of the % of cells calculated as being in any particular stage of the cell cycle. B and C are representative plots indicating degree of propidium iodide staining 48h without prior addition of PMVs (B) of following addition of 30 µg of HL-60 PMVs.
The reduction in proliferation of HL–60 cells upon treatment with. promonocyte PMVs is dependent on TGF–b1 delivered by the PMVs.
Having suggested a role for TGF– β1 carried by PMVs in the reduction of cellular proliferation of HL–60 cells, we wanted to confirm this by using an antagonist that would abrogate this effect. Addition of SB–431542 an antagonist of TGF–bR–mediated signalling did indeed reverse the growth inhibition mediated by PMVs (Figure 8). Addition of anti–TGF–β1 to HL–60 cells but not of the control Rb IgG, also abolished the inhibitory effect of PMVs significantly and restored the growth rate of the cells to almost control levels.
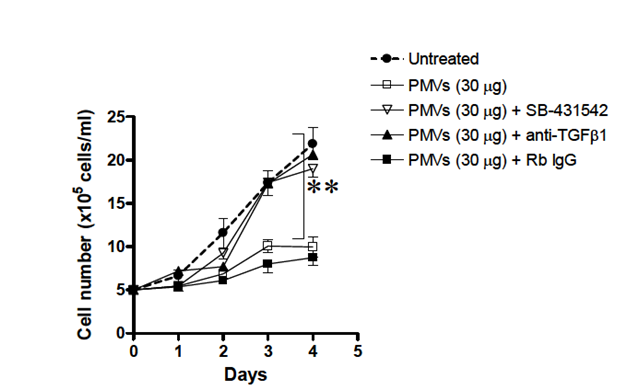
Figure 8 Application of HL-60- PMVs (30µg) to HL-60 cells 5x10⁵ cells/ml) in culture caused a marked reduction in the proliferation of HL-60 cells which could be reversed by addition of 10µg/ml anti-TGF-β1 or the TGF-βR antagonist, SB-431542.
PMVs fuse with HL–60 cells
PMVs from Octadecyl rhodamine (R18) labelled HL–60 cells bind to the surface of HL–60 cells
PMVs transferred from one cell to another are believed to attach to the surface of the recipient/host cell and to undergo fusion (del Conde I et al 2005). In an attempt to show this for HL–60 cells, HL–60 PMVs were first labelled with octadecyl rhodamine (R18) (Figure 9A). This label was apparently then transferred upon surface attachment to unlabelled HL–60 cells as shown in Figure 9B. This suggests contact although not necessarily membrane fusion (lipid mixing). In Figure 9C, we see control, unlabelled HL–60 cells that show no fluorescence. R18–labelled HL–60 cells, on the other hand, have uniform, strong surface labelling with R18 (Figure 9D).
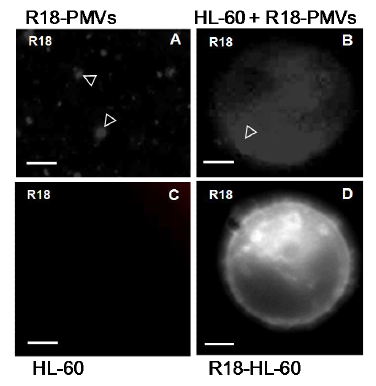
Figure 9 Addition of octadecyl rhodamine- (R18-) labelled PMVs, highlighted with arrowhead in (A) to HL-60 cells results in a transfer (arrowhead and surrounding diffuse labelling of R18) to recipient unlabelled HL-60 cells (B). Controlled unlabelled HL-60 cells show no fluorescence(C). Control, R18-labelled HL-60 cells have a uniform, strong surface labelling with R18 (D). Bar, 2 µm.
PMVs release by various cells has been implicated in a wide range of biological activities both from in vitro and in vivo studies with the most highlighted function being that of intercellular communication (signal transduction).8,10,15 This work has shown that PMVs (isolated from HL–60 and THP–1 cells) carry TGF–β1 on their membrane surface. These TGF–β1–bearing PMVs can modulate the growth rate of HL–60 promonocytes in vitro, without inducing apoptosis, the cells exiting the cell cycle at G0/G1. In addition, dramatic changes in the morphology of PMV–treated cells were observed as they became increasingly irregular in shape with membrane extensions resembling pseudopodia.
When HL–60 cells and monocytes were treated with 5% NHS for 30 min at 37 °C and released PMVs quantified, it was found that the promonocytic HL–60 cells released more PMVs than primary peripheral monocytes. Also, inducers of monocyte–to–macrophage differentiation such as histamine (10mM), ATRA (1mM) and PMA (0.1mM) caused reduced proliferation of HL–60 cells whilst inducing differentiation. The agent that caused most differentiation such as PMA also caused the greatest number of cells to die. This trend was followed by histamine and then ATRA. Further experiments also showed an apparent inverse correlation between cell number and PMVs/ml released after treating HL–60 cells with ATRA (1mM), PMA (0.1mM) and histamine (10mM).
HL60 cells treated with HL–60 PMVs for 24 or 72h showed an increased capacity to reduce NBT, as a measure of superoxide production and myeloid differentiation, meaning that the PMVs were able to cause significant differentiation of the HL–60 cells. Similarly experiments measuring Smad2 expression showed increased levels of phosphorylated Smad2 in comparison with negligible expression for control (no PMVs) showing that the signalling pathway being stimulated is likely to be TGFβ1. Also HL60 cells treated with PMVs showed a dose–dependent increase in adherence to the culture plate when percentage adherence was determined after 24 hours.
HL–60 and THP–1 cells were shown to carry higher levels of TGF–ß1 than MCF–7 from ELISA measurements of TGF–β1 isolated from HL–60, THP–1 and MCF–7 cells and so when those PMVs were added to HL60 cells, they significantly reduced the growth rate as compared to PMVs from MCF–7 cells which carry negligible TGF–ß1. In effect the HL–60 cells were induced to undergo differentiation and by so doing caused cell cycle arrest, so reducing cell number. This reduction of cellular proliferation of the HL–60 cells by the TGF–ß1 containing PMVs was however, able to be reversed by the addition of TGF–ßR signalling antagonist SB 431542 or anti–TGF–ß1.
The concept that surface TGF–β1 can stimulate TGF–β–mediated signalling on cell–to–cell contact or by implication in this study by PMV–cell contact is not new and has been described in T cells.16 Regulatory T cells (CD4+CD25+) express active TGF–β1, which interacts with TGF–β receptor on effector cells, thereby mediating immunosuppression.17 Similarly, surface–bound, albeit latent TGF–β, on the surface of colorectal cancer (CRC) cells has also been implicated in immunosuppression following cell–cell contact.18 Although activation may occur through various mechanisms, upon cell contact, latent TGF–β may be activated by alpha V integrins, and then mediating Smad signalling through the TGFβRI and TGFβRII receptors; MAPK and PI3K/Akt pathways may also be modulated.
Several inhibitors of TGF–β1 signalling have been reported as potential therapeutics in cancer immunotherapy. Amongst these is the TGF–β receptor type I (TβRI) antagonist, SB– 431542, a selective inhibitor of endogenous activin, of TGF–β1 signalling, and of resulting phosphorylation of Smads.19 The tumor suppressor functions of TGFβ1 have also been reversed using SB–431542, in studies using the colon cancer–derived FET cells (and the antagonist has been shown to inhibit the ligand–dependent growth of HT–29 colon cancer cells.20
We have demonstrated TGF–β1–mediated involvement in this study by showing that SB– 431542 almost completely abrogated the growth inhibition due to PMV–treatment of cells. That TGF–β1, on the surface of PMVs, could mediate such a change was confirmed by also reversing growth inhibition in the presence of anti–TGFβ1. To ascertain the relative importance of PMV release after stimulation with ATRA, PMA or histamine, in terms of limiting proliferation, it would be interesting to treat promonocytic cell lines with these agents following pretreatment with calpeptin, which specifically blocks calpain–mediated PMV release.
In another experiment, the transfer of octadecyl rhodamine (R18) from R18–labelled HL–60 PMVs to recipient unlabelled HL–60 cells suggested contact although not necessarily membrane fusion (lipid mixing). By contrast control R18–labelled HL–60 cells had uniform, strong surface labelling with R18. In Lipid mixing experiments, upon addition of R18–labeled PMVs to HL–60 promonoyctes, lipid is indicated by rapid dequenching as determined spectrophotometrically. This was probably mediated through PS interactions as preincubation of HL–60 cells with AnV abrogated the fusion.
Besides inducing cell cycle arrest, PMVs also induced the differentiation of HL60 cells as measured by the expression of CD11b and CD14. HL–60 cells were treated with PMVs (30µg) or PMA and mean fluorescence intensity as a measure of surface expression levels monitored. In the case of CD11b and CD14, as indicators of differentiation along the monocyte/macrophage lineage there was a significant increase in expression, compared to untreated controls. However expression of DC–SIGN (CD209) as a measure of differentiation along the dendritic cell lineage was negligible. Differentiating HL–60 cells expressing CD11b and CD14 were also shown by immunoflourescence microscopy. Morphological changes of HL–60 cells upon treatment with PMVs or vitamin D3 resulted in rapid changes in cell morphology. Within 12 hours, the cells showed formation of aggregates and after 24 hours they began to show signs of developing pseudopodia compared to control. By 72 hours there were clear signs of differentiation
TGF–β1 is unlikely to be the only factor that PMVs may convey to induce differentiation and so other factors carried by PMVs with the potential to induce differentiation, should now also be looked at, including Gal–3 and monocyte microRNAs, such as miRNA–155, shown to be involved in myeloid differentiation.11 In view of the need to expand the limited range of therapies in myeloid leukaemias, it might be prudent to look at other PMV–releasing agents, as potential alternative drugs in differentiation therapy against APL. There is every confidence that with more work over time, all questions regarding the role of PMVs on promonocyte/monocyte–macrophage differentiation and its use as an alternative treatment for promonocytic leukaemia would be answered.
None.
None.
None.

©2016 Antwi-Baffour, et al. This is an open access article distributed under the terms of the, which permits unrestricted use, distribution, and build upon your work non-commercially.