MOJ
eISSN: 2373-4442


Research Article Volume 4 Issue 1
1Department of Biochemistry, All India Institute of Medical Sciences (AIIMS), India
2Divisions of Virology, Defense Research & Development Establishment (DRDE), India
Correspondence: Rao DN, Ex Professor & Head, Department of Biochemistry, All India Institute of Medical Sciences, Ansari Nagar, New Delhi-110029, India, Tel 0124-3955039, Fax 91-9868592706
Received: September 03, 2016 | Published: October 5, 2016
Citation: Nagar PK, Pradhan S, Verma P, Joshi G, Singh A, Rao DN (2016) Mapping and Immunological Response of Immunodominant B and T cell Epitopes of E2 Glycoprotein of Chikungunya Virus. MOJ Immunol 4(1): 00117. DOI: 10.15406/moji.2016.04.00117
Chikungunya virus (CHIKV) is a mosquito-borne Alphavirus and belongs to family Togaviridae. Debilitating arthralgia and myalgia are common symptoms of Chikungunya disease. This virus is sometimes fatal to humans, however there is no effective therapy available till now. In many studies envelope E2 protein of CHIKV has been exploited for diagnosis and vaccine therapy. Here we studied the immunodominancy of collinearly synthesized epitopes of E2 protein. Out of seventeen peptides, ten (E2P3, E2P5, E2P7, E2P8, E2P9, E2P10, E2P11, E2P13, E2P16 and E2P17) were proved to be major epitopes of E2 protein based on B and T cell response. When these peptides were immunized through intramuscular route encapsulated in PLGA microspheres with CpG ODN as an adjuvant, some sequences showed peak antibody levels ranging 1, 80,000 to 2, 20,000 in outbred and inbred (H-2d) strains of mice with memory response and they showed IgG2a and IgG2b subclass distribution. Depending upon their nature E2P1, E2P8, E2P10, E2P17 peptides showed high stimulation index during in vitro T cell proliferation assay. Plaque reduction neutralization test (PRNT90) assay proved immunodominance of few epitopes showing strong neutralization of Chikungunya virus. Thus ten peptides were considered as B cell epitopes. On the basis of cell mediated immune response and cytokine profile four peptides were considered as T cell epitopes. Three peptides E2P8, E2P10, E2P17showed common properties of B and T cells. These B and T cell epitopes can be assembled together in multiple antigenic peptides (MAPs) for developing effective immunogen for CHIKV.
Keywords: E2 protein, peptides, B & T cell epitopes, chikungunya
CHIKV, chikungunya virus; TFA, trifluroacetic acid; FCA, freund’s complete adjuvant; BCA, bicinchoninic acid; MAPs, multiple antigenic peptides
Chikungunya virus (CHIKV) belongs to a group of mosquito borne Alphaviruses.1 This virus is transmitted to humans by Aedes mosquitoes. Chikungunya disease was reported for the first time in East Africa in 19522,3 and distributed to many geographical areas. It was due to adaption of CHIKV to a widely distributed novel vector Aedes albopictus.4–6 CHIKV infection is generally associated with fever, headache, photophobia, myalgia and arthralgia.7,8 The acute phase of CHIKV infection typically lasts from days to weeks however joint pain and chronic fatigue can persist upto months to years.9–11 CHIKV have positive-sense RNA genome, encodes four non-structural (nsp1-4) and five structural (Nucleocapsid, E1, E2, E3, 6K) proteins. The E1 glycoprotein participates in cell fusion12 while the E2 glycoprotein binds to cellular receptor13 and initiate endocytosis.14 We focused our attention on E2 glycoprotein because of its involvement in host-cell receptor interaction and exposed on viral surface15 which can be the target of virus neutralization. We selected and synthesized seventeen peptides of E2 protein (S27 CHIKV strain) to map the B and T cell epitopes. Ten peptides showed B cell response during competitive immunoassay, direct binding assay, high antibody titer with memory response and four peptides showed T cell response during lymphoproliferative assay and cytokine profile. Three peptides have overlapping B and T cell response. Neutralization assay of peptide specific antibodies proved substantial number of neutralizing epitopes on E2 protein. This study may help to design an immunogen for CHIKV.
Selection and chemically synthesis of peptides of E2 protein
Peptides were selected using DNASTAR (on the basis of hydrophilicity, hydrophobicity, secondary structure, antigenicity index, amphipathicity) and TEPITOPE software (binding time(T1/2) of peptides to MHC molecules), 17 peptide sequences spanning entire E2 protein (CHIKV S-27 strain) were selected (Table 1) and synthesized by solid phase synthesis using Fmoc chemistry. Peptides were cleaved using trifluroacetic acid (TFA) containg scavengers as anisole and thioanisole. Purification of peptides was done initially by Gel filtration and later by HPLC using C18 column. After purification, peptides were authenticated by physicochemical method like amino acid analysis and sequencing. On the basis of chemical nature all the peptides were dissolved in a proper solvent. Acidic peptides were dissolved in PBS solution (pH 7.0 to 7.4), Basic peptides were dissolved in PBS with optimum amount of trifluoroacetic acid and neutral peptides were dissolved in DMSO with PBS.
Peptides |
Sequences |
Sequence No. |
E2P1 |
HCPDCGEGHSCHSPV |
2817-2831 |
E2P2 |
RIRNEATDGTLKI |
2835-2847 |
E2P3 |
IGTDDSHDWTKLRY |
2855-2868 |
E2P4 |
VNGRTVRYKCNCGGSNEG |
2991-3008 |
E2P5 |
SMGEEPNYQEEWVTHK |
3098-3113 |
E2P6 |
KLRYMDNHIPADAGRA |
2865-2880 |
E2P7 |
GFTDSRKISHSCTHPFHHD |
2913-2931 |
E2P8 |
PVIGREKFHSRPQHGGKELP |
2933-2952 |
E2P9 |
TYVQSNAATAEEIEVHMPP |
2954-2972 |
E2P10 |
DTPDRTLLSQQSGNVKIT |
2973-2989 |
E2P11 |
DKVINNCKVDQCHAAVTNHK |
3013-3032 |
E2P12 |
VPTEGLEVTWGNNEPY |
3120-3234 |
E2P13 |
LSANGTAHGHPHE |
3141-3153 |
E2P14 |
GLFVRTSAPCTITGTM |
2881-2896 |
E2P15 |
NSPLVPRNAELGDRKGKI |
3037-3054 |
E2P16 |
MVPKARNPTVTYGKNQ |
3066-3081 |
E2P17 |
STKDNFNVYKATRPYLAHCPD |
2800-2820 |
Table 1 Peptide sequences selected on the basis of DNASTAR and TEPITOPE software
Mice
Six to eight weeks old outbred mice were procured from Experimental Animal Facility, AIIMS, New Delhi, India. BALB/c (H-2d) mice were procured from National Institute of Nutrition, Hyderabad, India. Each experimental group consisted of six to eight mice. All the animals were provided food and water in pathogen free condition. All experiments were conducted in accordance with the guidelines of AIIMS ethics as well as CPCSEA, Ministry of Social Justice, Government of India.
Microspheres preparation, size and morphology
Microspheres with entrapped peptides were prepared using poly (DL-lactide-co-glycolide; 50:50) (sigma) by double solvent evaporation method (water-in-oil-in-water).16 The percentage entrapment (58-65%) for peptides was calculated by bicinchoninic acid (BCA) method. The size distribution (2-8µm) of the microspheres was determined by laser diffraction (Malvern Instrument, UK). Microspheres morphology was studied by scanning electron microscopy (Phillips, CM 10) and found to be spherical in nature.
Immunization and sera collection
Mice were immunized through Intramuscular route using, PLGA microspheres containing 40µg of peptide equivalent was suspended in 40 µl of PBS with 5µg of CpG ODN 1826 (TCCATGACGTTCCTGACGTT) (Coley Pharmaceuticals, USA) and injected on the thigh region on day 0. Booster dose of 20µg of peptide with 5µg of CpG was given on days 23 and 42. In case of E2 protein, primary dose of 30µg in Freund’s complete adjuvant (FCA) was used on day 0 followed by booster dose of 15µg in incomplete Freund’s adjuvant (IFA) was given on day 23 and 42. Bleeds were collected from retro-orbital plexus on the day 0, 28, 42, 60, 90, 120. Pre immune sera were collected. Antisera was separated and stored at -20°C till use.
Competitive immunoassay
Briefly, varying amounts of peptides (0.125-256µg) were incubated with appropriate dilution of E2 protein antisera (Outbred mice antisera1: 16,000 dilutions, absorbance 1.0) for 2 h at 37°C (Full-length E2 protein was provided by Dr. M.M.Parida, DRDE, Gwalior, INDIA). This Ag-Ab complex was transferred onto the ELISA plate previously coated with E2 protein (100ng/well) and blocked with 5% milk powder in PBS. After washing with 0.05% PBS Tween-20, goat anti mouse IgG-HRPO conjugate (1:1000 dilution) was added and incubated for 1 h at 37°C. The color was developed using o-phenylene diamine (OPD) as a chromogen and H2O2 as a substrate and absorbance was recorded at 492nm. The amount of peptide required for 50% inhibition with E2 protein was calculated. The results were expressed as the percentage of antibody binding in presence of competitor as compared to the control value (without competitor).
Humoral response (Antibody peak titer) of the peptides by ELISA
The peptide specific antibody levels were estimated in terms of peak antibody titer using standard ELISA protocol. Briefly microtiter plates (Immulon IIHB, Dynatech) were coated with 200 ng/well of each peptide (l00 µl/well) in coating buffer and kept overnight at 4° C. After blocking, serial two-fold dilution of mice antisera from different groups were added and incubated at 37° C for 2 h, color was developed as described above and absorbance was taken at 492 nm. Empty microspheres and CpG antisera were used as negative control. The titers were expressed as the highest serum dilution giving an absorbance higher than that of empty microspheres (EM) + CpG.
Direct binding assay
Immunoreactivity of E2 protein antisera with different peptides were studied by direct binding assay. The ELISA plates were coated with different peptides (200ng/well). Conversely reactivity of each peptides antisera with E2 protein was also performed while plates were coated with E2 protein (100ng/well) and incubated with individual peptide. After blocking the plates, E2 antisera/peptide antisera was added at 1: 200 dilutions and incubated at 37° C for 2 h. Color was developed as described above.
Estimation of IgG subclasses
IgG subclass (IgG1, IgG2a and IgG2b) estimation was done as per manufacturer’s instructions using isotyping kit ISO-2 (Sigma, USA).
Evaluation of B cell memory response
Mice were immunized with 20µg of native E2 protein with 5µg of CpG ODN on day 120 and bleeds were collected on day 135 and IgG antibody titers were performed as described above.
T cell proliferation assay
Outbred and inbred H-2d micewere immunized with 40µg of peptide in microspheres on day 0 containing 5µg of CpG ODN. Booster dose of 20µg was given on day 10. In case of E2 protein, primary dose of 30µg was given on day 0 followed by booster dose of 15µg on day 10. Mice were sacrificed on day 21. Single cell suspension of pooled splenocytes (devoid of B cells by panning with anti-mouse immunoglobulin) were cultured in triplicate wells and plated at 2×10⁵ cells/well in RPMI 1640 medium (300µl/well) supplemented with gentamycin, streptomycin (50 µg/ml) and 10% fetal calf serum (FCS). Splenocytes were stimulated in vitro with different variables as described below.
PHA (2 µg/well) was used as positive control. 200µl/well of culture supernatant was collected after 72hrs and stored at -70° C for cytokine estimation. The cultures were pulsed with [3H] thymidine (specific activity 6.4 mmol-1, BARC, India) at 0.5µCi/well. The cells were harvestedafter 18hrs and thymidine incorporation was measured by β scintillation counter. Stimulation index was calculated by count per minutes (CPM) with stimulus divided by CPM without stimulus. The data were presented as a mean SI±SD of triplicate wells.
Cytokine level measurement
The levels of IL2, IL-4, IL-10, IL-17 IFN- γ cytokines were measured in the culture supernatant of duplicate wells by sandwich ELISA as per manufacturer’s instructions (e-Biosciences, USA).
Neutralization assays
90% plaque reduction neutralization test (PRNT90) was used for measuring neutralization by antibodies. Two-fold Serial dilutions of peptide specific antisera were incubated with 200 PFU of CHIKV (DRDE-06) for 90 min at 37°C. Antisera and virus complexes (200µl/well) were transferred onto 24 well culture plates (Corning NY) containing monolayer of Vero cells. Plate was incubated for 1 h at 37°C and rocked for every 20 min. Each well was overlaid with a 0.4% gene pure LE agarose/DMEM medium layer. The agarose layer was removed after 48hrs then fixative/staining solution (40% methanol and 0.25 % crystal violet) were added for five minutes and rinsed with DDW. The neutralizing antibody titer was expressed as a reciprocal of dilution of antisera, which caused 90% reduction of plaque formation compared to the plaque number in control. Preimmune sera were used as a control.
Statistical analysis
The data on peptide specific IgG, IgG subclass, T cell proliferation and cytokine levels were compared by non-parametric Kruskal-Wallis one-way analysis of variance by ranks. The levels of significance (pvalue) were compared between different bleeds, IgG subtypes, Stimulation index and cytokine levels for peptides.
Competition immunoassay of E2 protein antisera with peptides
For competitive ELISA, the dilution of E2 protein antisera, that gave an absorbance of 1.0 was used and incubated with increasing amounts of different peptides. Among the individual peptides competed with E2 antisera, peptides E2P3, E2P5, E2P7, E2P8, E2P9, E2P10, E2P11, E2P13, E2P16 and E2P17 showed competition in a dose dependent manner(8µg-40µg) (Figure 1). Other peptides did not show competition even at higher concentration of competitor (Figure 1A&B). However, under similar experimental conditions, 2.5 µg of E2 showed 50% inhibition with its own anti-sera. Thus E2P3, E2P5, E2P7, E2P8, E2P9, E2P10, E2P11, E2P13, E2P16 and E2P17 appear to be potential B cell epitopes of E2 protein.
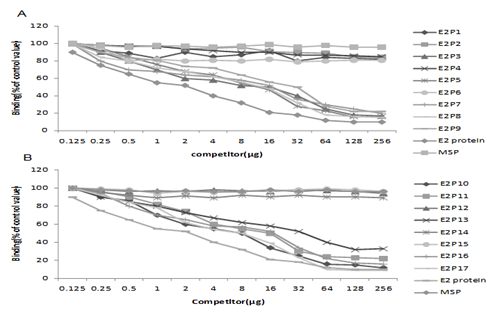
Figure 1 Competitive immunoassay of different peptides with E2 antisera raised in outbred mice. Increasing amount of peptides was incubated at fixed dilution (1:16000) of antisera. Results were expressed as the percentage of the antibody binding in presence of competitor as compared to the control value (without competitor). Peptide of MSP (merozoite surface protein) was used as an unrelated peptide control.
Immunoreactivity of E2 protein antisera with peptides
Different peptide reactivity with E2 antisera was done by direct binding assay. Peptides E2P3, E2P5, E2P7, E2P8, E2P9, E2P10, E2P11, E2P13, E2P16 and E2P17 showed maximal immunoreactivity with E2 antisera at a fixed dilution (Figure 2A). However other peptides did not show significant reactivity with antisera indicating that E2 protein induced polyclonal antibodies for specific epitopes only (data not shown). The reactivity was highest with sera collected on day 60. In conclusion those peptides that showed competition immunoassay also showed direct binding with E2 antisera.
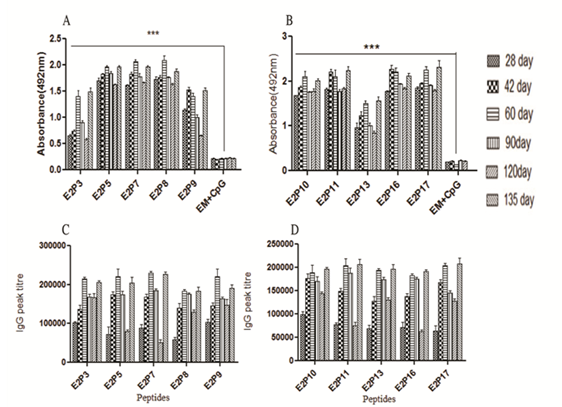
Figure 2 (A) Direct binding assay of peptides with E2 protein antisera, 200ng/100µl peptides were coated onto ELISA plates and E2 protein antisera were added at 1:200 dilutions, color was developed and absorbance was taken at 492 nm. Preimmune sera (PIS) was used as negative control (B): Direct binding assay of peptides antisera with E2 protein raised in outbred mice, 100ng/100µl of E2 protein was coated on ELISA plates and individual peptides antisera were added at 1:200 dilutions. Reactivity was checked by using ELISA protocol. Empty microspheres (EM) + CpG ODN were taken as negative control. Data of two independent experiments expressed as Mean ± SD. ***- P< 0.001. (C): Peptides specific IgG peak titer of different intervals in outbred mice, after intramuscular immunization of peptides entrapped in PLGA microspheres with CpG ODN was used as adjuvant. 200ng/100µl per well of peptides ,was coated on ELISA plates and peptides antisera were added with two fold serial dilutions following goat-antimouse-IgG -HRPO (1:1000) dilution was added and finally color was measured at 492 nm. EM + CpG ODN were used as negative control. The titers were expressed as the highest serum dilution giving an absorbance higher than that of negative control. Data of two independent experiments expressed as Mean ± SD.
Epitope-identification using peptide-based ELISA
Individual peptide immunogenicity was tested in outbred and inbred mice. Peptides E2P3, E2P5, E2P7, E2P8, E2P9, E2P10, E2P11, E2P13, E2P16 and E2P17 showed high peptide specific IgG levels in all the bleeds. These peptides showed significantly high (p<0.001) anti-body titers ranging from 1,80,000 to 2,20,000 in outbred strain on day 60 (Figure 2C). Antibody peak titers gradually increased from day 28 to 60 and later declined on day 120. Interestingly 135 day sera also showed booster effect with peak titers equal to 60 day sera after immunization with E2 protein. Immunogenicity of peptides was also verified in H-2d mice and showed slightly higher antibody titer as compared to outbred mice (Figure S1(C&D). Rest seven peptides showed low antibody titers in both strains of mice. Peak titer of E2P1 and E2P6 peptides has shown in Figure 2C while other peptides data not shown.
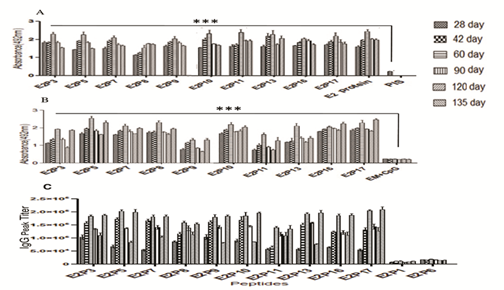
Figure S1 (A & B): Direct binding assay of peptides antisera with E2 protein raised in H-2d mice Reactivity was checked by using ELISA protocol. Empty microsphere (MS) + CpG ODN was taken as negative control. Data of two independent experiments expressed as mean ±SD. ***-P< 0.001.
(C & D): Peptide specific IgG peak titer in H-2d mice after intramuscular immunization of peptides entrapped in PLGA microspheres with CpG ODN was used as adjuvants. 200ng/100µl of peptides was coated on ELISA plate and peptides antisera were added with two fold serial dilutions, following goat-antimouse-IgG -HRPO (1:1000 dilution) was added and finally color was measured at 492 nm. Empty microspheres (MS) + CpG ODN were used as negative control. Data of two independent experiments expressed as mean ± SD.
Immunoreactivity of peptides anti-sera with native E2 protein
Peptide anti-sera raised in outbred and inbred H-2d mice was evaluated for its reactivity with E2 protein. The sera raised for each of the peptides E2P3, E2P5, E2P7, E2P8, E2P9, E2P10, E2P11, E2P12, E2P16 and E2P17 had show differential immunoreactivity with E2 protein in both strains of mice (Figure 2B & S1(A&B). Peptide’s anti-sera collected at day 135 also showed significant reactivity (P<0.001) with E2 protein. Immunoreactivity of peptides antisera with native E2 proved the presence of epitopes on surface of E2 protein.
B-cell Memory response
Memory response on day 135 through generation of high antibody levels were observed with all ten peptides in outbred and inbred mice Figure 2C & S1 (C&D). It indicates that ten peptides had the potential to induce the secondary immune response after challenge with E2 protein.
IgG subclass estimation
Isotyping of all ten peptides antisera revealed some interesting results. In case of outbred mice, IgG2a/IgG2b antibody levels were significantly higher (P<0.005) for E2P3, E2P11, E2P16 followed by E2P7, E2P13 (p<0.05) peptides (Figure 3). Rest of the peptides E2P5, E2P8, E2P9, E2P10, and E2P17 showed equal distribution of IgG1 and IgG2a/IgG2b subtypes indicating mixed Th1 & Th2 biased immune response. Comparable results were obtained with inbred strain (Figure S2) indicating isotyping antibody level is not strain restricted.
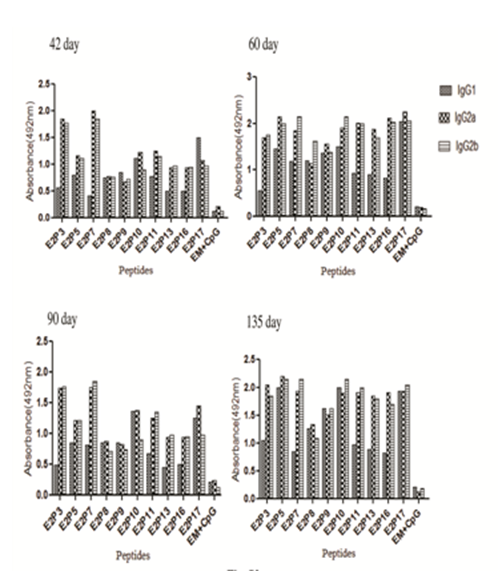
Figure 3 Estimation of Peptide specific IgG isotype antibodies (IgG1, IgG2a and IgG2b) in outbred mice on days 42, 60, 90 and 135.ELISA plates were coated with peptides and peptides antisera were added at fixed 1:200 dilutions. HRP- conjugated goat antimouse IgG1, IgG2a and IgG2b were used. Experiments were done twice and data was represented as mean absorbance of pooled antisera.
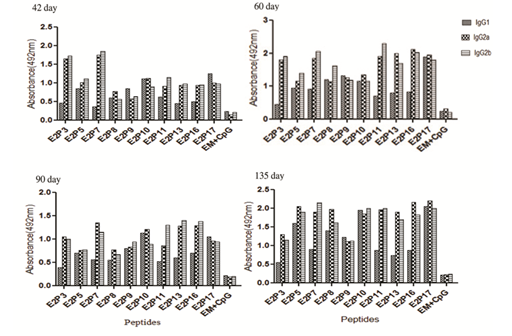
Figure S2 Estimation of Peptide specific IgG isotypic antibodies (IgG1, IgG2a and IgG2b) in H-2d mice on days 42, 60, 90 and 135. Experiments were done twice and data are represented as mean absorbance of pooled sera.
T cell proliferation assay
After stimulation of E2 protein primed splenocytes with individual peptides or E2, of seventeen peptides only four peptides E2P1, E2P8, E2P10 and E2P17 showed significantly high(P<0.001) stimulation index(SI) as compared to other peptides. Peptides E2P1, E2P8, E2P10 showed stimulation index 36±4.89 to 40±5.12 at 25µg/well while E2P17 showed 22±3.45 at 50µg/well. Stimulation with E2 protein showed similar SI value at 5µg/well (Figure 4A). Peptide primed splenocytes after stimulation with cognate peptides or E2 protein again E2P1, E2P8, E2P10, E21P17showed the highest SI value (Figure 4B). These results proved that four dominant T cell epitopes are presents on E2 protein. Same peptides consistently showed high SI value in inbred mice too (Figure S3).
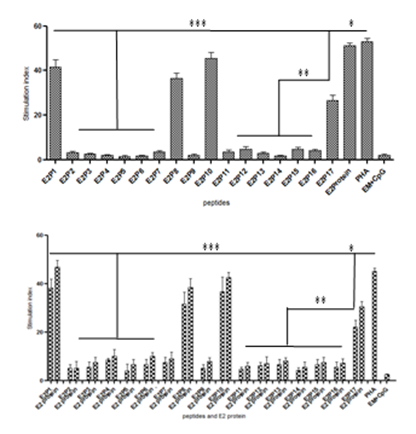
Figure 4 T cell epitope mapping using H3-thymidine incorporation assay showing stimulation index (SI). (A)-Outbred mice were immunized with E2 protein and splenocytes in vitro stimulated with E2 protein and individual peptides. (B)-Outbred mice were immunized with individual peptides and splenocytes stimulated with E2 protein and cognate peptides. Spleen (SP) cells were cultured in 96 well plates. Phytohaemagglutinin (PHA) was used as a positive control. Empty microspheres (EM) stimulated cells were taken as negative control. Stimulation index was calculated by count per minutes (CPM) with stimulus divided by CPM without stimulus. Results of two idependent experiments were expressed as Mean SI value ± SD. ***- P< 0.001; **- P< 0.005; ***- P< 0.05.
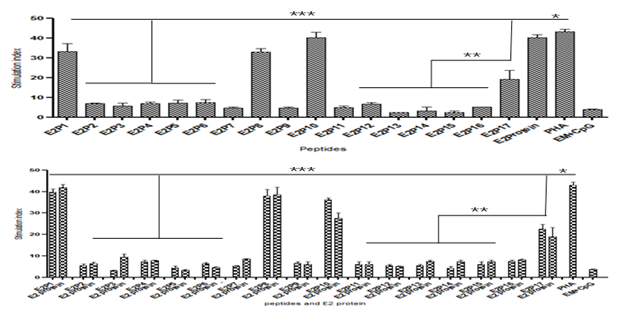
Figure S3 T cell epitope mapping by 3H-thymidine incorporation assay showing stimulation index (SI).
(A) H-2d mice were immunized with E2 protein and stimulated splenocytes in vitro with E2 protein and individual peptides.
(B) H-2d mice were immunized with individual peptides and splenocytes stimulated in vitro with E2 protein and individual peptides. Phytohaemagglutinin (PHA) was used as a positive control; spleen (SP) cells were cultured in 96 well plates and harvested after 72 h. Radioactivity was measured using scintillation counter. Results of two independent experiments were expressed as mean SI value ± SD. Empty microsphere (EM) + CpG stimulated cells were taken as negative control. ***- P< 0.001; **- P< 0.005; *- P< 0.05.
Estimation of Th1, Th2 and Th17 cytokines level
Cytokine levels were measured in the culture supernatant of
E2 protein primed splenocytes of outbred mice stimulated with peptides showed the following results. E2P1, E2P8, E2P10 and E2P17 peptides produced significantly high IFN-γ (1207-1560pg/ml, p<0.005) as compared to rest of the peptides (220-546 pg/ml). Of interest IL-2 level was significantly higher (180-240pg/ml, P<0.001) with peptides E2P1, E2P8, E2P10 and E2P17 as compared to other peptides (28-98pg/ml). IL-4 level was insignificant for all the peptides. Interestingly only E2 protein and its E2P5 peptide produced IL-10 ranging 145-185 pg/ml and its levels were insignificant for rest of the peptides (32-59 pg/ml). Significantly high level of IL-17 (302-380 pg/ml, P<0.001) was observed after stimulation with E2P1, E2P8, E2P10, E2P17 peptides (Table 2).
Peptides |
IL-2 |
IL-4 |
IL-10 |
IL-17 |
IFN-γ A |
E2P1 |
240 ± 6.16 |
68 ± 5.67 |
42 ± 0.12 |
380 ± 6.04 |
1489 ± 4.02 |
E2P2 |
40 ± 2.12 |
54 ± 3.29 |
48 ± 7.35 |
92 ± 5.98 |
234 ± 5.12 |
E2P3 |
81 ± 4.16 |
62 ± 6.24 |
28 ± 9.27 |
56 ± 6.45 |
200 ± 0.32 |
E2P4 |
39 ± 5.13 |
50 ± 5.25 |
32 ± 12.63 |
71 ± 7.24 |
212 ± 7.16 |
E2P5 |
102 ± 3.05 |
77 ± 0.63 |
145 ± 3.30 |
125 ± 9.56 |
400 ± 6.45 |
E2P6 |
25 ± 2.89 |
56 ± 5.28 |
38 ± 9.39 |
65 ± 7.65 |
123 ± 5.43 |
E2P7 |
79 ± 4.35 |
59 ± 4.18 |
45 ± 6.02 |
56 ± 0.09 |
202 ± 4.12 |
E2P8 |
190 ± 5.64 |
69 ± 6.39 |
38 ± 4.35 |
308 ± 8.87 |
1207 ± 14.2 |
E2P9 |
56 ± 8.00 |
79 ± 3.28 |
42 ± 12.73 |
87 ± 9.54 |
123 ± 5.02 |
E2P10 |
202 ± 4.45 |
72 ± 3.26 |
39 ± 2.63 |
325 ± 6.65 |
1560 ± 6.14 |
E2P11 |
78 ± 7.08 |
56 ± 4.16 |
26 ± 3.56 |
104 ± 7.73 |
367 ± 4.29 |
E2P12 |
76 ± 9.21 |
58 ± 5.27 |
69 ± 6.30 |
101 ± 5.89 |
145 ± 7.24 |
E2P13 |
67 ± 5.12 |
52 ± 0.46 |
38 ± 6.56 |
124 ± 507 |
345 ± 5.20 |
E2P14 |
26 ± 0.21 |
56 ± 6.23 |
30 ± 7.92 |
116 ± 6.54 |
234 ± 7.12 |
E2P15 |
38 ± 6.38 |
55 ± 8.35 |
47 ± 0.63 |
101 ± 4.63 |
415 ± 6.25 |
E2P16 |
98 ± 7.42 |
70 ± 6.26 |
29 ± 5.02 |
97 ± 6.42 |
406 ± 8.16 |
E2P17 |
180 ± 21.45 |
40 ± 5.25 |
79 ± 6.08 |
302 ± 0.39 |
1408 ± 9.34 |
E2protein |
222 ± 9.67 |
139 ± 6.24 |
185 ± 9.48 |
396 ± 6.26 |
1589 ±12.14 |
Peptides |
IL-2 |
IL-4 |
IL-10 |
IL-17 |
IFN-γ B |
E2P1 |
231 ± 8.32 |
68 ± 5 .26 |
32 ± 6.87 |
360 ± 6.83 |
1729 ± 8.54 |
E2P2 |
36 ± 3.12 |
56 ± 0.39 |
38 ± 4 .47 |
80 ± 3.75 |
136 ± 5.78 |
E2P3 |
110 ± 5.23 |
59 ± 4 .78 |
22 ± 5.66 |
76 ± 6.92 |
123 ± 5.94 |
E2P4 |
20 ± 7.45 |
56 ± 3.96 |
36 ± 2.75 |
51 ± 4.52 |
118 ± 6.57 |
E2P5 |
90 ± 4.28 |
67 ± 9.65 |
176 ± 4 .97 |
136 ± 6.41 |
223 ± 8.03 |
E2P6 |
25 ± 6.23 |
55 ± 7.56 |
41 ± 4.56 |
55 ± 5.42 |
177 ± 8.93 |
E2P7 |
80 ± 4.54 |
59 ± 6.47 |
52 ± 4.45 |
67 ± 6.31 |
208 ± 6.59 |
E2P8 |
200 ± 4.36 |
78 ± 4.74 |
32 ± 3.63 |
325 ± 8.61 |
1594 ± 16.40 |
E2P9 |
69 ± 4.48 |
76 ± 5.29 |
49 ± 2.72 |
76 ± 6.54 |
184 ± 8.62 |
E2P10 |
220 ± 6.83 |
66 ± 5.51 |
43 ± 6.64 |
305 ± 13.92 |
1590 ± 14.38 |
E2P11 |
99 ± 0.09 |
56 ± 0.38 |
30 ± 0.52 |
104 ± 5.48 |
301 ± 5.62 |
E2P12 |
39 ± 6.31 |
52 ± 2.89 |
66 ± 0.29 |
91 ± 6.51 |
155 ± 9.42 |
E2P13 |
59 ± 4.63 |
58 ± 3.64 |
34 ± 3.22 |
62 ± 4 .47 |
322 ± 7.82 |
E2P14 |
26 ± 7.52 |
54 ± 6 .04 |
41± 6.10 |
92 ± 8.72 |
226 ± 8.68 |
E2P15 |
28 ± 5.97 |
53 ± 3.35. |
52 ± 2.26 |
36 ± 5.64 |
356 ± 16.94 |
E2P16 |
70 ± 0.84 |
58 ± 4.49 |
32 ± 6 .42 |
74 ± 4 .52 |
402 ± 9.74 |
E2P17 |
199 ± 3.53 |
56 ± 0.74 |
59 ± 4.69 |
364 ± 6.41 |
1518 ± 12.69 |
1EM |
86 ± 4.84 |
44 ± 4.34 |
43 ± 0.45 |
46 ± 0.31 |
182 ± 10.29 |
Table 2 Cytokine level (pg/ml) in culture supernatant of splenocytes of Outbred mice
AE2 protein primed splenocytes stimulated with E2 protein and individual peptides, BIndividual peptide primed splenocytes stimulated with individual peptides, 1EM–Empty microspheres. Data are representative of two independent experiments are shown as Mean ± SD.
In another formulation peptides primed splenocytes when in vitro stimulated with cognate peptides again E2P1, E2P8, E2P10, E2P17 peptides showed IFN-γ level in the range 1518-1729 pg/ml compared to other peptides (200-400pg/ml). Rest cytokine levels were in same pattern as of E2 protein primed splenocytes shown in Table 2. Similar cytokine profiles were observed in case of inbred mice as shown in supplementary data Table S1 &S2. Finally results conclude that peptides E2P1, E2P8, E2P10 and E2P17 produced significant levels of IL-2, IL-17, IFN-γ cytokines.
Peptides. |
IL-2 |
IL-4 |
IL-10 |
IL-17 |
IFN-γ |
E2P1 |
231±5.26 |
62±1.37 |
28±4.23 |
349±7.19 |
1582±8.13 |
E2P2 |
50±7.40 |
54±4.13 |
49±6.56 |
84±6.45 |
234±6.27 |
E2P3 |
82±6.19 |
41±5.35 |
32±8.96 |
56±9.09 |
212±8.56 |
E2P4 |
59±6.23 |
55±6.68 |
45±10.04 |
48±8.87 |
245±9.89 |
E2P5 |
100±8.42 |
61±8.09 |
176±6.9 |
108±9.65 |
456±5.46 |
E2P6 |
35±2.38 |
42±7.76 |
49±5.63 |
108±6.46 |
101±6.12 |
E2P7 |
79±3.67 |
49±6.98 |
38±6.49 |
76±0.97 |
322±5.07 |
E2P8 |
200±7.19 |
69±7.76 |
28±5.36 |
321±6.54 |
1325±12.54 |
E2P9 |
82±8.08 |
82±5.50 |
34±9.96 |
78±5.09 |
136±6.52 |
E2P10 |
191±9.34 |
43±6.85 |
48±6.54 |
343±7.24. |
1567±7.84 |
E2P11 |
80±12.46 |
49±6.96 |
49±0.45 |
92±10.56 |
381±5.95 |
E2P12 |
28±2.4 |
45±0.85 |
88±7.69 |
46±6.84 |
166±7.84 |
E2P13 |
77±6.23 |
48±7.49 |
44±5.34 |
106±8.93 |
345±7.76 |
E2P14 |
21±10.56 |
56±6.63 |
40±7.25 |
42±6.75 |
283±6.91 |
E2P15 |
32±4.06 |
39±6.97 |
51±6.52 |
49±7.08 |
445±9.32 |
E2P16 |
70±6.34 |
50±9.48 |
52±1.53 |
112±8.84 |
448±5.64 |
E2P17 |
165±8.45 |
45±10.07 |
61±4.50 |
340±9.05 |
1480±7.62 |
E2 protein |
202±0.98 |
142±8.45 |
214±2.00 |
382±6.81 |
1622±6.54 |
1EM |
34±4.05 |
48±4.47 |
38±5.45 |
42±7.42 |
189±6.89 |
Table S1 Cytokine level (pg/ml) in culture supernatant of E2 protein primed splenocytes of inbred mice and in vitro stimulated with E2 protein and peptides
Data are representative of two independent experiments and are shown as Mean ± SD.
1. EM – Empty microspheres.
Peptides |
IL-2 |
IL-4 |
IL-10 |
IL-17 |
IFN-γ |
E2P1 |
218±6.32 |
74±6.36 |
50±6.45 |
360±6.45 |
1749±8.64 |
E2P2 |
38±0.39 |
52±7.20 |
43±4.10 |
40±3.46 |
136±5.45 |
E2P3 |
94±6.13 |
42±6.59 |
34±5.29 |
46±6.48 |
123±5.34 |
E2P4 |
23±6.32 |
57±6.69 |
44±2.20 |
51±4.65 |
118±6.45 |
E2P5 |
98±5.45 |
64±10.43 |
176±4.19 |
75±6.87 |
223±8.34 |
E2P6 |
27±8.75 |
39±9.30 |
34±4.30 |
45±5.09 |
177±8.87 |
E2P7 |
63±5.68 |
42±8.47 |
38±4.27 |
66±6.52 |
208±6.56 |
E2P8 |
210±5.45 |
82±6.39 |
45±3.91 |
325±8.42 |
1204±16.86 |
E2P9 |
56±6.00 |
62±6.92 |
46±2 .16 |
76±6.92 |
184±0.23 |
E2P10 |
199±0.21 |
35±6.46 |
43±6.20 |
305±13.75 |
1590±14.10 |
E2P11 |
72±3.30 |
42±5.81 |
36±3.16 |
84±5.65 |
301±5.93 |
E2P12 |
31±4.29 |
52±4.36 |
54±9.19 |
41±0.28 |
155±9.00 |
E2P13 |
82±7.53 |
64±6.00 |
28±3.20 |
62±4.98 |
322±7.80 |
E2P14 |
41±8.82 |
34±7.03 |
41±6.48 |
72±8.38 |
226±8 .32 |
E2P15 |
37±7.32 |
41±6.89 |
35±0.18 |
40±5.37 |
356±16.45 |
E2P16 |
98±6.48 |
46±6.67 |
42±6.45 |
74±4.56 |
402±9.68 |
E2P17 |
193±6.08 |
151±6.35 |
41±0.27 |
364±0.34 |
1508±12.45 |
1EM |
40±6.30 |
35±6.24 |
33±4.19 |
51±4.24 |
168±10.01 |
Table S2 Cytokine level (pg/ml) in culture supernatant of individual peptide primed splenocytes of inbred mice and in vitro stimulated with individual peptides
Data are representative of two independent experiments and are shown as Mean ± SD.
1. EM – Empty microspheres.
In vitro neutralization assay
Peptides E2P3, E2P5, E2P7, E2P8, E2P9, E2P10, E2P11, E2P13,E2P16 and E2P17 antisera of day 60 was used for in vitro neutralization (PRNT90) assay. Antisera of E2P10 at 1:3200 dil,E2P3, E2P5, E2P17 at 1:800 dil, E2P7, E2P8, E2P13 at 1:200 dil and E2P16 at 1:100 dilution showed 90% plaque number reduction (Figure 5). However, E2P9 and E2P11 peptide antisera not showed significant neutralization for CHIKV.
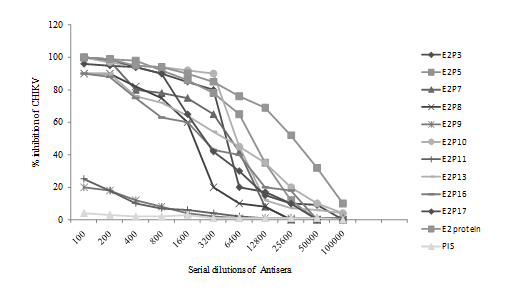
Figure 5 In vitro neutralization of CHIKV by peptide specific antisera using vero cells. Serial dilutions of antisera were incubated with 200 PFU of CHIKV (DRDE 06). Plaques were counted and titers were expressed as the reciprocal of antisera. Preimmune sera (PIS) was used as negative control and E2 antisera was used as positive control.
This study describes the mapping of Immunodominant B- and T- cell epitopes on envelope E2 protein of chikungunya virus. This study also describes the humoral and cellular responses of these synthetic epitopes entrapped in PLGA microsphere when immunized through intramuscular routes in murine model. Earlier reports indicate that formalin inactivated, attenuated, VLP based vaccine showed protection after CHIKV challenge in mice and macaques model through generation of neutralizing antibodies.17–20 These studies though showed encouraging results but none of these have entered as commercial vaccine. In the case of CHIKV, B cell response is essential because monoclonal antibody against the specific epitope of E2 protein protected mice or inhibit virus effect on cell lines after CHIKV challenging21–23 All these studies mainly focused on antibody response but in our study we identified T cell epitopes of E2 protein that are involve in the effecter functions of the immune response. In the present study determinants of E2 protein were identified by competitive immunoassay and direct binding assay. In Competitive immunoassay ten out of seventeen competed with E2 protein antibodies. Again reactivity of same peptides with E2 protein antisera clearly indicates that E2 antisera have polyclonal antibodies against different linear epitopes of E2 protein. E2P3, E2P5, E2P7, E2P8, E2P9, E2P10, E2P11, E2P13, E2P16, E2P17 peptides showed high antibody levels in outbred as well as H-2d strain and sustained over longer duration. Interestingly all the above peptides showed strong memory response after challenge with native E2 protein which is a prerequisite for any immunogen to act as a potential vaccine.
These results highlight the identification of immunodominant B cell epitopes on E2 protein. In our previous study reactivity of different peptides with human convalescent CHIKV sera showed overlapping sequences with our murine data.24 Nine peptides viz. E2P3, E2P5, E2P7, E2P8, E2P9, E2P10, E2P11, E2P16 and E2P17 were found to be common epitopes in mice and human. Cross reactivity of mice epitope with human epitope indicate the conservation of immunogenic sequence across the species. Protection against infectious diseases frequently depends on the stimulation of an appropriate antibody isotypes. In our study IgG2a/IgG2b isotypes antibodies were found to be dominant for E2P3, E2P7, E2P11, E2P13, E2P16 peptides. A mixed Th1/Th2 response was observed for other peptides E2P5, E2P8, E2P9, E2P10, E2P17, suggesting a differential activation of helper T cell subsets. When E2 primed splenocytes were in vitrostimulated with individual peptides, peptides E2P1, E2P8, E2P10, E2P17 showed maximum lymphocyte proliferation. Whenpeptide primed splenocytes were stimulated in vitro with cognate peptide or E2 protein again same four peptides E2P1, E2P8, E2P10, E2P17 consistently showed maximum T cell stimulation in outbred as well asinbred strains of mice. However we selected all peptides on the basis of hydrophilicity, hydrophobicity, secondary structure, antigenicity index, amphipathicity and TEPITOPE software (binding time (T1/2) of peptides to MHC molecules) but only few of them showed immunodominancy. Because naturally occurring immune response do not recognize all possible epitopes it depends on binding of epitope with appropriate MHC molecules, existence of a T-cell repertoire capable of recognizing the epitope MHC complexes and efficiency with which the prospective epitopes are generated by cellular processing and presented on the surface of the relevant cells. CpG oligo act via TLR9 as polyclonal activator, activate B-cells proliferation, differentiation and enhance the antigen specific T cells.25,26 In our study CpG ODN was capable of enhancing B and T cell response. Immune response basically depends on the cytokine profile at the time of infection. To understand the cytokine response to these peptides, different cytokines were estimate.
The role of IFN-γ in case of chikungunya is not fully understood but mice lack IFN signaling, represent complex symptoms of the disease.27 The level of IL-4 cytokine was significant only for E2 as compared to rest of the peptides thus all the lympho proliferative peptides showed Th1 type response. Only E2 protein and E2P5 showed high level of IL-10 as compared to other peptides. Because IL-10 is considered to be immunosuppressive and cause termination of inflammatory response.28 Interestingly E2P5 did not show B or T cell response but IL-10 production was higher thus it may be an immunosuppressive sequence of E2 protein. Another important cytokine IL-17 play protective roles in host defense against certain pathogens at epithelial and mucosal barriers and promote the up regulation of other inflammatory cytokines and chemokines.29 In our study IL-17 level was significantly higher for T cell proliferating peptides and E2 protein, thus it can activate different cell lineages of immune system to clear CHIKV infection. Most important feature for antibody is in vitro neutralization of CHIKV. When CHIKV infects the host in the presence of the neutralizing antibodies, the viral clearance was very easy.23,30–33 Here antisera of eight peptides E2P3, E2P5, E2P7, E2P8, E2P10, E2P13, E2P16 and E2P17 showed in vitro neutralization of CHIKV in vero cell line. Peptides which showed high antibody peak titer also showed in vitro neutralization for CHIKV. It is a potent criteria for developing a subunit vaccine.
The authors are thankful to Defense Research and Development Organization (DRDO) & Department of Science and Technology (DST), New Delhi, India for financial support and Mr. Pradeep Kumar Nagar is thankful to Department of Biotechnology (DBT) for fellowship.
The authors declare there is no conflict of interests.
None.

©2016 Nagar, et al. This is an open access article distributed under the terms of the, which permits unrestricted use, distribution, and build upon your work non-commercially.