MOJ
eISSN: 2373-4442


Research Article Volume 5 Issue 4
1Department of Biological Sciences, Faculty of Science, King Abdulaziz University, Jeddah, Saudi Arabia
2School of Biotechnology, Eternal University, Baru Sahib-0, HP India
Correspondence: Waqas Iqbal, King Abdulaziz University, Jeddah, Saudi Arabia,, Tel 966-555-880-173, Fax 966-264-007-56
Received: January 01, 1971 | Published: May 4, 2017
Citation: Iqbal W, Alkarim S, Mohammed Ali HSH, Saini KS (2017) CEACAM Gene Family: A Circuitous Journey towards Metastasis in Breast Cancer. MOJ Immunol 5(4): 00164. DOI: 10.15406/moji.2017.05.00164
The ubiquitous up–regulation of CEACAM6 in colon, pancreatic, breast and lung cancer is well established. This protein is known for its invasive and metastatic properties in pancreatic adenocarcinoma as well as in breast cancer. We propose that the over–expression of CEACAM5 and CEACAM6 are a pre–requisite for invasive and metastatic behavior of breast cancer. We have conducted bioinformatics studies to compare the expression profiles of CEA gene family members in sets of RNA–seq data for MCF10A (non–tumorigenic epithelial cell line) and MCF7 (human breast cancer cell line) obtained from European Nucleotide Archives. RNA–seq data was mapped using HISAT2 followed by alignment and abundance analysis using Stringtie and visualized using ballgown package in R software environment. Specifically, we observed a 4.5–fold up–regulation in CEACAM5 expression while 7–fold increase was recorded for CEACAM6 expression. We propose that the up–regulation of both these proteins in MCF7 cell line compared to MCF10A implicates their inconspicuous role in tumorigenesis, enhanced invasiveness and thus, leading to increased propensity towards breast cancer metastasis. Further studies are required in breast cancer cell lines and appropriate animal models to validate these in silico observations.
Keywords: ceacam5, ceacam6, metastasis, bioinformatics, breast cancer, tumor biomarkers
CEA: Carcinoembryonic Antigens; Ig: Immunoglobulin; CRC: Colorectal Cancer; CEACAMs: Carcinoembryonic Antigen related Cell Adhesion Molecules; CSCs: Cancer Stem Cells; PSGs: Pregnancy–Specific Glycoproteins; ENA: European Nucleotide Archive
CEA gene family (CEA) belonging to immunoglobulin (Ig) supergene family was identified more than 50 years ago, comprises of 35 genes/pseudo genes (21 are protein coding) located on chromosome 19 (between q13.1–13.3), with wide range of patho–physiological functions.1,2 Despite the over–expression of various CEA genes in very diverse cancers (breast, colon, prostate, pancreas, stomach, ovary, lung & medullary), its primary application as a serum biomarker is confined to the diagnosis & prognosis of colorectal cancers (CRC), and in the detection of liver metastasis. CEA gene family has two groups, CEACAMs (carcinoembryonic antigen related cell adhesion molecules) and PSGs (pregnancy–specific glycoproteins). The 12 CEACAMs subgroup encoded proteins exhibit one variable domain known as the N domain, with the only exception of CEACAM16 that consists of two N domains. The N domain is either followed by none or C2–like Ig domains, referred to as A or B. These extracellular domains usually act as intercellular adhesion molecules in epithelial, endothelial, dendritic and leukocytes.3,4 CEACAM5 (CEA) comprises of one N domain followed by six C2–like domains (A1, B1, A2, B2, A3 and B3).5–8, whereas CEACAM6 has only two C2–like domains, termed as A and B.1,9
CEA gene family members are involved in diverse pathophysiological functions.4,10, including as receptors for microbial pathogens.11 They play a significant role in carcinogenesis, particularly in cancer detection, progression and metastasis.12,13 Gold and Freedman.14, were the first to discover CEACAM5 in the blood of colon cancer patients and further research established that its Overexpression in numerous malignancies is usually correlated with poor prognosis, and increased mortality.8,14,15 In prostate and in colorectal cancers, CEACAM 5 over–expression was documented as an excellent tumor biomarker.16,17, although it may not be useful as a standalone early screening tool for CRC.18 Additional evidence about the Overexpression of CEACAM6 in CRC is also associated with increased invasiveness and liver metastasis.19 CEACAM6 Overexpression has been reported in a number of different malignancies, such as–breast, pancreatic, ovarian, lung and gastric adenocarcinomas.20 Individually and sometimes together, CEACAM5 and CEACAM6.21 are also associated with adhesion, invasion and metastasis in pancreatic, colon and breast cancers. In this regard, another study validated the effects of three monoclonal antibodies specifically targeting and blocking two domains (NH2–terminal, A1B1 domains) of CEACAM5/CEACAM6 and A3B3 domain present solely on CEACAM5.22 The inhibition of these specific domains affects invasiveness, extravasation and metastases in vitro as well as in vivo.21,22
Analysis of differential gene expression data obtained by high–throughput sequencing requires fast, reliable and accurate software tools to have meaningful clinical applications. This has led to the development of numerous open–source software tools as well as proprietary technologies. In this study, we procured, stored and mined data, from the newly developed pipeline for raw RNA–seq data analysis from open–source tools. From analyzing raw reads to visualization, HISAT2, Stringtie and Ballgown pipeline has been regarded as the best “New Tuxedo package” superseding the original tuxedo package (TopHat2–Cufflinks).23 We carried out bioinformatics analysis to evaluate the up–regulation of CEACAM5 and CEACAM6 in MCF7–metastatic cell line, as compared to MCF10A–normal epithelial cell line, using these new datasets. Our data corroborates and validate these earlier “wet lab” studies, that these two proteins are not just great tumor biomarkers, but also actively involved in metastatic cells’ initiation, invasion and colonies propagation at secondary malignant tissue sites.
Cell line samples
Our datasets contained two breast cell lines with three replicates each. MCF10A is a, non–tumorigenic, normal epithelial cell line, and MCF7 is a metastatic breast cancer cell line.
RNA–seq data analysis
Fastq files were downloaded from ENA (European nucleotide archive).24 Using HISAT2.25, the fastq files were mapped to human reference genome. The SAM file obtained were sorted and converted into BAM files using Samtools.26 BAM files thus obtained were aligned using a reference file, annotated, merged, and the estimation for abundance was calculated using Stringtie.27, followed by differential gene expression analysis using ballgown package in R open source programming language.23,28,29
Raw reads obtained from ENA (Table 1) were aligned using HISAT2 with pre–built human genome index downloaded from their website. The output SAM files containing the transcripts analyzed using Stringtie and Ballgown package in R programming software showed a substantial differential expression of CEACAM5 (upregulated 4.5 fold) and CEACAM6 (upregulated ~7 fold) genes in MCF7 cell line compared to MCF10A, normal epithelial cell line (Table 2).
|
Differential Gene Expression between MCF10A and MCF7 cells |
|||
|
GEO Series |
GEO Sample |
Run Accession |
Cell Line |
|
GSE71862 |
GSM1847015 |
SRR2149928 |
MCF10 |
|
GSM1847016 |
SRR2149929 |
MCF10 |
|
|
GSM1847017 |
SRR2149930 |
MCF10 |
|
|
GSM1847018 |
SRR2149931 |
MCF7 |
|
|
GSM1847019 |
SRR2149932 |
MCF7 |
|
|
GSM1847020 |
SRR2149933 |
MCF7 |
|
Table 1 GEO series and SRA raw read files. GEA series represents series accession number. GEO sample denotes sample accession number whereas run accession is the unique number given to each sample. Raw data for each sample was downloaded from ENA and analyzed.
|
Gene_name |
UCSC_id |
Fc |
pval |
qval |
de |
Regulation in MCF7 |
|
CEACAM5 |
uc002orj.1 |
4.50585722 |
0.004114438 |
0.061435608 |
2.171801599 |
Up-regulated |
|
CEACAM6 |
uc002orm.2 |
7.010235172 |
0.000864163 |
0.032530362 |
2.809462843 |
Up-regulated |
Table 2 Ballgown output file in tabular format. Fastq files were analyzed using HISAT2, Stringtie and Ballgown pipeline. CEACAM5 & CEACAM6 expression data after comparative analyses between MCF10A & MCF7 cell lines are reported. Both CEACAM5 and CEACAM6 were upregulated in MCF7 cell line. Data obtained was considered significant at p value < 0.05. Table summarizes gene names, Fc is fold change observed and denotes differential expression for both the transcripts as log2.
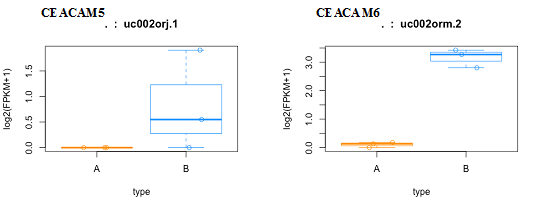
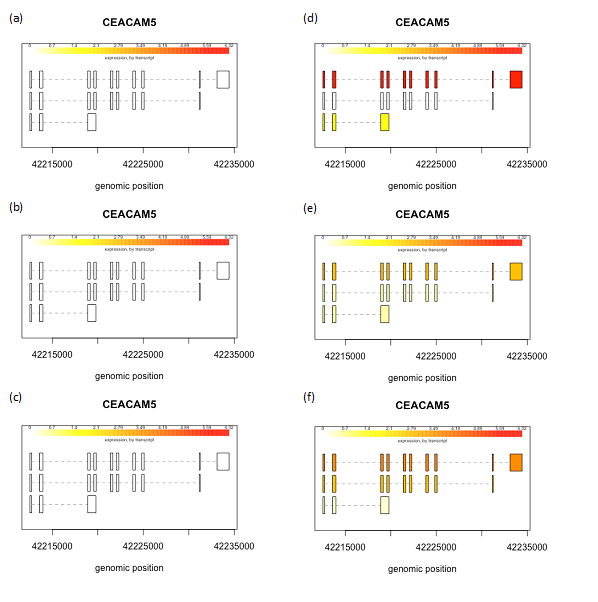
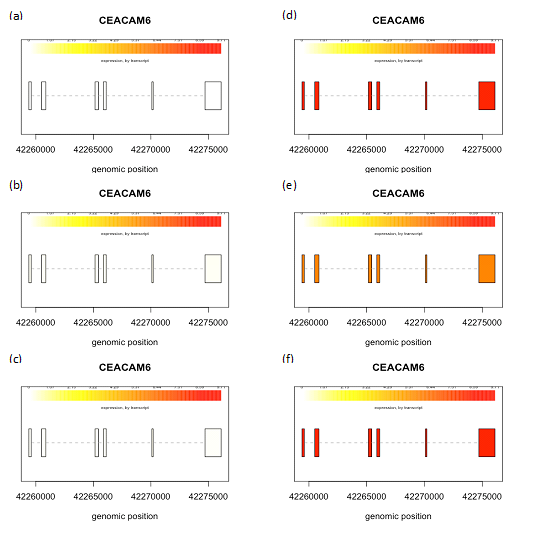
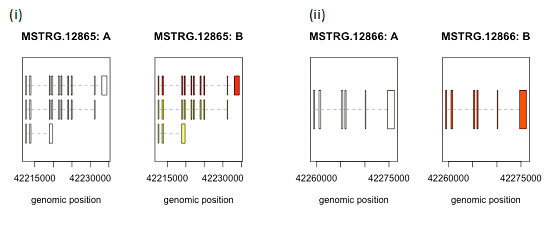
We created box plots for these two genes to observe the distribution of gene expression data for each sample in our data set. CEACAM5 had a higher expression in two of the biological replicates of MCF7 cell line whereas all the biological replicates had higher CEACAM6 expression pattern in MCF7 cell line, as compared to MCF10A (Figure 1). Next we collated and analyzed the expression of each individual transcript isoform for CEACAM5 and CEACAM6, identified in our study, to delineate the expression pattern of each isoform in all the six samples in our data set. The three isoforms identified for CEACAM5 were upregulated in MCF7 cell line as compared to MCF10A. However, we were able to obtain only one transcript for CEACAM6 gene that too was upregulated in MCF7 cell line (Figure 2,3). We finally plotted the mean expression patterns of transcript isoforms for both CEACAM5 and CEACAM6 from our datasets to depict the relative expression of each isoform in both groups (Figure 4).

Figure 1 Distribution of FPKM values. Box plots depicts the distribution of FPKM (Fragments Per Kilobase of transcripts per Million mapped reads) values in both MCF10A and MCF7 samples for transcripts uc002orj.1 and uc002orm.2 from CEACAM5 and CEACAM6 genes respectively. Here type represents MCF10A (A) & MCF7 (B).

Figure 2 Expression levels of isoforms. CEACAM5 transcripts in MCF10A (a-c) and MCF7 (d-f). The structure and levels of expression of three isoforms of CEACAM5 gene in all six samples are shown individually. Color intensities depict expression levels where lighter shade represents lower expression while darker shade denotes higher expression. Highest expression was observed for the first isoform in MCF7 cell line, indicated by darker shade (d).

Figure 3 Expression levels of isoforms. CEACAM6 transcripts in MCF10A (a-c) and MCF7 (d-f). Structure and expression levels of one isoform of CEACAM6 gene in all the six samples are shown. Color intensities depict expression levels, where lighter shade represents lower expression while darker shade denotes higher expression. Highest expression was observed in sample d and f in MCF7 cell line, indicated by darker shade.

Figure 4 Plots depicting mean expression patterns. CEACAM5 & CEACAM6 expression for all the transcripts between the two groups.
(i) MSTRG.12865:A and MSTRG.12865:B represents CEACAM5 in MCF10A and MCF7 respectively while
(ii) MSTRG.12866:A and MSTRG.12866:B represents CEACAM6 in MCF10A and MCF7 respectively.
Color intensities depict expression levels where lighter shade represents lower expression while darker shade denotes higher expression. Highest expression was observed in the first isoform of CEACAM5 and CEACAM6 in MCF7 cell line as indicated by darker shades.
During the initiation of liver metastasis, CEACAM5 (CEA) exerts its action by binding to its receptor (CEAr)–a protein related to the hnRNP M family of RNA binding proteins. CEA–CEAr interactions lead to the activation and production of pro– and anti–inflammatory cytokines, primarily IL–1, IL–6, IL–10 and TNF–α.30 Taken together, these cytokines modify the micro–environment of hepatocytes & Kupffer cells, and their cell–cell interactions with the hepatic sinusoids. These interactions not only affect the tumor cells, or other liver cells, but also seem to promote the survival of CSCs and other circulating tumor cells in the blood stream. As proposed by Thomas, et al.30, down–regulating these cytokines, particularly IL–6 and IL–10, in hepatic sinusoids prior to curative surgery for colorectal cancers has added benefit of causing reduced relapse in certain patients?
Among the CEA gene family members, CEACAM5 & CEACAM6 are overexpressed in many cancers, and have been found to be unique mediators during tumor cell adhesion and metastasis.3,4,22 In this study where we evaluated the expression pattern of CEACAM5 and CEACAM6 in metastatic breast cancer cell line in comparison to a normal epithelial cell line, both these genes were upregulated in MCF7 breast cancer cell line, as observed by others.20,31 We further assessed the expression at the transcript level, observing the up–regulation of different isoforms identified in this study. All the three isoforms for CEACAM5 and one–isoform for CEACAM6 were over–expressed in MCF7 cell line. Moreover the transcript level expression of CECAM6 gene was higher than that of CEACAM5 as reported by Blumenthal, et al.20 Increased expression of CEAs in various malignancies implicates their role in epithelial malignancies. Nevertheless higher expression of CEACAM5 and CEACAM6 distorts normal tissue architecture.32,33 and might lead to alterations in epithelial–mesenchymal–transition, thereby setting up the stage for the initiation of metastasis. Other possible explanation could be that increased expression of these 2 CEACAMs might exacerbate metastasis is due to the fact that CEA inhibits immune cells’ response against colon cancer cells.34 Taken together, therapeutic approaches aimed at down–regulating CEACAM5/CEACAM6 will help us restrain the metastatic process.
Reverse–transcriptase PCR (RT–PCR) assays has been developed to detect CEA from circulating tumor cells in blood and detailed application of this technology on CSCs and metastatic cancer stem cells is imminent. Single–cell sequencing, next–generation sequencing and stage–specific gene expression analyses for both RNA–miRNA–transcriptomes, could lead to a better understanding of contextual genetic cues promoting interactions of various tissue cell types, e.g., liver cell types (hepatocytes, Kupffer cells, sinusoids, endothelial cells, etc) with the metastatic tumor cells and metastatic CSCs. Similarly, the role of CEA gene family, particularly CEACAM–5&6, during the initiation, progression and invasiveness at secondary tissue sites emanating from the spread of breast cancer metastasis require additional molecular analyses using appropriate transgenic mouse models. A better understanding of these two CEACAMs will undoubtedly will give us better therapeutic and monitoring tools for the management of metastatic process, which remains a challenging “black box” for the cancer researchers and oncologists.
Computational analyses using HISAT2 and Stringtie software were performed with “Aziz Supercomputer” at King Abdulaziz University (KAU) High Performance Computing Center (http://hpc.kau.edu.sa). We are grateful to the Dr. Rashid Mehmood–Prof. of Big Data Systems, Deanship of Scientific Research (DSR) and Dean Graduate Studies (DGS) at KAU for their support of this project.

©2017 Iqbal, et al. This is an open access article distributed under the terms of the, which permits unrestricted use, distribution, and build upon your work non-commercially.