MOJ
eISSN: 2573-2919


Research Article Volume 2 Issue 2
1Departamento de Ingenieria Ambiental Universidad Tecnol?gica, Universidad Tecnol?gica de Leon, Mexico
2Plataforma Solar de Almeria-CIEMAT, Spain
3Departamento de Ingenieria Qu
4Departamento de Qu
Correspondence: Juan M Peralta-Hernÿndez, Universidad de Guanajuato, DCNE, Departamento de Qumica, Cerro de la Venada S/N, Pueblito de Rocha, Guanajuato, Gto. CP. 36040, Mexico
Received: February 08, 2017 | Published: April 6, 2017
Citation: Páramo-Vargas J, Maldonado-Rubio MI, Gómez-Castro FI, et al. Modeling the Fenton depuration of the effluent from a slaughterhouse based on design of experiments. MOJ Eco Environ Sci. 2017;2(2):52-55. DOI: 10.15406/mojes.2017.02.00018
In an effort to improve the quality of treated water, the implementation of a new technology referred to as Advanced Oxidation Processes (AOP) is being examined, either alone or in combination with other processes. When working with real conditions there are sometimes changes which involve adjustments of the process, and it is easier to perform such adjustments when it has a reliable mathematical model. The studied scaled design referred to as Fenton treatment, involving the use of a central-composite design (quadratic model) which was tested on the effluent discharge of a slaughterhouse. As a result of our treatability study, we experienced removal efficiencies based on chemical oxygen demand (COD) greater than 85%, while ascertaining that removal process was the result of chemical oxidation and coagulation.
Keywords: central composite design, coagulation, chemical oxidation, fenton reaction, model, slaughterhouse effluent
The meat processing industry generates large quantities of waste water with high content of organic matter, which must be removed prior to being discharged.1,2 In order to improve water quality and ensure regulatory compliance, Advanced Oxidation Processes (AOP) may be used in combination with other processes as pre or post treatment. It has been reported that Fenton process have removal efficiencies of chemical oxygen demand (COD) greater than 85%.3,4 In this work, we have used AOPs based on Fenton process in the depuration of the effluent of a slaughterhouse; in order to improve its quality. Fenton process is based on the oxidative action of free hydroxyl radicals, with a redox potential of 2.8 V5 produced by Fenton reaction in acid medium. This reaction must not be analyzed alone, because there are others occurring simultaneously, with different reaction constants, so Eq. 1 to 7 are the principal ones.6,7
|
|
K1 = 70 M-1 s-1 |
(1) |
|
|
K2 |
(2) |
|
K3 = 3.3x10⁷ M-1 s-1 |
(3) |
|
|
|
K4 =0.01 M-1 s-1 |
(4) |
|
|
K5 = 1.2x10⁶ M-1 s-1 |
(5) |
|
K6 = 1.3x10⁶ M-1 s-1 |
(6) |
|
|
K7 = 3.2x10⁸ M-1 s-1 |
(7) |
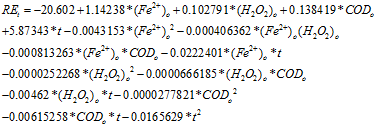
When applying this treatment with real wastewaters, sometimes there are changes in its quality and is convenient to have a mathematical model which allows to predict which adjustments are necessary.6,8 There are models based on chemical analysis and experimental determination of some parameters,6 but it was decided to work on the development of a statistical model using the software Statgraphics; due to the quantity of substances present in our sampled real effluent and the high number of experimental data available. Taking this in consideration we developed a model for the Fenton treatment of the effluent of a slaughterhouse, with inclusion of the following factors: initial ferrous ion concentration (Fe2+)0, initial hydrogen peroxide concentration (H2O2)0, initial chemical oxygen demand (COD)0 and time (t). Based on our analysis, we conducted a kinetic study as a complement.
Materials
As it has been commented the water quality was a variable throughout this study; this quality is represented by COD, so periodically samples of the effluent were taken at different times at the distal end of the actual wastewater treatment facility (plant), in order to obtain working samples with unique qualities, storing them at 4°C. Some of the working samples were prepared by dilution. For the objective of the study we focused on the COD parameter, of which highest value was 577 mg L-1, and flow with an average value of 350 m3 d-1. In this analysis, we employed ferrous sulphate (FeSO4.7H2O, provided by KEM), titanium oxysulphate (O5STi.xH2SO4, provided by FLUKA Analytical), H2O2 (provided by KEM), sulfuric acid, orthophenanthroline and ferrous ammonium sulphate, all chemicals used is analytical grade and purchased from Karal and KEM. In preparing solutions pure water (it is better if we mention type of water like type-II or type-III) was used (conductivity < 1 μS cm-1) from a Millipore equipment model Elix 5.
Equipment
During tests conductivity, pH and temperature were monitored using a HACH Sension156 portable multiparameter. For chemical oxygen demand determination, a reactor HI839800 from Hanna Instruments was used and finally, colorimetric measurements were conducted using an UV spectrophotometer Evolution 300 UV-Vis (Thermo Scientific). The tests were carried out using a batch reactor of 1 L, with agitation of 350 rpm at 23°C, this set up has been reported elsewhere.9 In experiment conductivity, pH and temperature were monitored using HACH Sension156 portable multiparameter. Chemical oxygen demand (COD) were analyzed on HI839800 COD reactor (Hanna instrument)
Analytical Methods
As it has been mentioned, COD was established as the principal monitoring parameter, with two kinds of COD; the total chemical oxygen demand (CODt) and the dissolved chemical oxygen demand (CODd). Taking this into account, each sample was divided into two parts, one taken from the mixed sample, for CODt and another by filtering through a fiberglass filter Whatman A, for CODd. COD measurements were in accordance with the Standard Methods.10 Monitoring of Fe2+ was implemented using the phenanthroline method,10 measuring the absorbance of its orange-red complex with phenanthroline at a wavelength (λ) of 508 nm. The measurement of Fet involved reduction of Fe3+ to Fe2+ by using ascorbic acid before the UV-spectrophotometry, and at the end Fe3+ was the difference between it and Fe2+. On the other hand, the measurement of the H2O2 was also completed by UV-spectrophotometry at a λ of 406 nm.11
Design of Experiments
Basically, we were focused on the development of a viable model. Target response was established as the removal efficiency of COD (RE), which was calculated through Eq. 8.
(8)
The effects of principal factors: (Fe2+)0, (H2O2)0, CODt and time, were studied using a Central Composite Design (CCD) 24, with response surface methodology (RSM), involving a total of 52 tests; 16 factorial points, 8 axial points and 2 central points; each one with two replicates and whose design information is presented in Table 1. Once obtained the model, was validated by applying to a couple of real samples.
Factor |
Factor Levels |
||||
|---|---|---|---|---|---|
-α |
-1 |
0 |
1 |
+α |
|
(Fe2+)0 (mg L-1) |
13.9 |
27.9 |
41.9 |
55.8 |
69.8 |
(H2O2)0 (mg L-1) |
100 |
200 |
300 |
400 |
500 |
CODt (mg L-1) |
265.1 |
355 |
435.5 |
503 |
583.8 |
time (min) |
2.5 |
5 |
7.5 |
10 |
12.5 |
Table 1 Each one with two replicates and whose design information
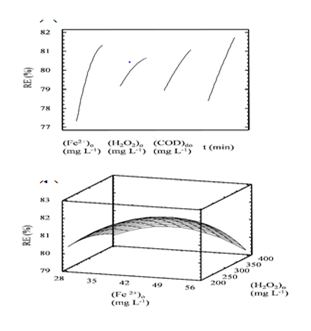
Applying the ANOVA analysis, it was found for the quadratic model, the statistic R2 of 80.5059 and R2adjusted of 73.1298, and that the four factors studied were significant. Figure 1(A) depicts the behavior of principal factors, showing that by increasing each one, RE increases, having different levels of influence in the following order of magnitude: (Fe2+)0 > time > CODt > (H2O2)0. On the other hand Figure 1(B) depicts the response surface for the optimal removal condition of COD for one of the effluents studied (COD0 of 503 mg L-1) at 10 min, corresponding to a true sample, not a dilution.


Figure 1A depicts the behavior of principal factors, showing that by increasing each one, RE increases, having different levels of influence in the following order of magnitude: (Fe2+)0 > time > CODt > (H2O2)0.
Figure 1B depicts the response surface for the optimal removal condition of COD for one of the effluents studied (COD0 of 503 mg L-1) at 10 min, corresponding to a true sample, not a dilution.
The data in Table 2 show that the model developed describes properly the Fenton treatment. In the cases which were studied, the variation between CODd values obtained and estimated is approximately 6 %. These two final result, lead us to conclude that the model obtained is viable for depuration treatment of the effluent studied, by permitting us to manipulate principal variables of the process in function of the water quality represented by COD.
Type of Sample |
DQO0 (mg L-1) |
Fenton Treatment |
|
|---|---|---|---|
CODd estimated by model (mg L-1) |
CODd rea (mg L-1) |
||
Effluent from local facility |
503 |
89.2 |
83.7 |
Effluentfrom local facility |
581 |
108.4 |
115.9 |
Table 2 Describes properly the Fenton treatment
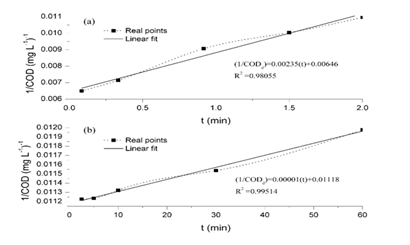
Further analysis of equation (9) was performed in order to establish the maximum removal efficiency to be reached by the Fenton treatment. Equation (9) was codified in the optimization software GAMS, using as lower and upper values for [Fe2+]0 and [H2O2]0 those presented as –α and + α in Table 1. First of all, it has been found that the objective function is non-convex, since the characteristics values of its Hessian are -0.0473, -0.0009, 0.000 and 0.0063. Thus, as the time increases, the removal efficiency will also be increased, but the value of [Fe2+]0 required will change, as can be observed in Table 3. It can also be observed that as the initial chemical oxygen demand increases, the required [Fe2+]0 decreases. It is worth to notice that the required concentration of peroxide to maximize the removal efficiency is always on its minimum value. The removal process, involves chemical oxidation and coagulation, the last one because ferric hydroxocomplexes are formed.12-16 This observation is confirmed throughout different points of the process: a) the presence of flocs which at the end are measured as settled solids (approximately 30 mL L-1), b) the difference between CODd and CODt in each test, having a relation CODd/CODt between 0.20 to 0.40, c) the large and rapid decline concentrations of Fe2+, Fet and Fe3+ indicates that iron is removed from the solution.17 In order to confirm these points, a kinetic study was conducted at (Fe2+)0 of 55.8 mg L-1, (H2O2)0 of 200 mg L-1, pH of 3 and for a total of 60 minutes. The process occurred too quickly and it was divided in two parts for explaining it, procedure referred in other investigations,18,19 as is presented in Figure 2. Figure 2(A) depicts the kinetic in the first two minutes and Figure 2(B) depicts the kinetic from 2.5 to 60 min. In both cases a kinetic model of second order was used, having high correlations, with R2 of 0.9806 and 0.9951 respectively. We experienced a relation CODd/CODt, which decreased throughout the process from 0.45 to 0.27(Figure 3).
COD0 (mg L-1) |
REt max |
(Fe2+)0(mg L-1) |
(H2O2)0 (mg L-1) |
t(min) |
265.1 |
98.756 |
64.022 |
100 |
15 |
355 |
98.473 |
42.666 |
100 |
20 |
435.5 |
98.838 |
27.35 |
100 |
23 |
503 |
98.465 |
13.259 |
100 |
26 |
583.8 |
98.537 |
13 |
100 |
38 |
Table 3 Describes properly the Fenton treatment

Figure 2A Depicts the kinetic in the first two minutes.
Figure 2B Depicts the kinetic from 2.5 to 60 min. In both cases a kinetic model of second order was used, having high correlations, with R2 of 0.9806 and 0.9951 respectively. We experienced a relation CODd/CODt, which decreased throughout the process from 0.45 to 0.27.
The model developed for the depuration treatment of the effluents from the slaughterhouse is viable for use under real conditions as a method for adjusting of the process when changes the water quality. By using this model is becomes possible to acquire design and operation information, ensuring water with high and stable quality. The removal efficiencies of COD obtained greater than 85%, are based on chemical oxidation and coagulation process, showing that it is viable for use in depuration of this effluent and others of similar origin.
Financial support from PRODEP-UGTO-PTC-472 and UGTO under the Project 007/2015, and 778/2016, is acknowledged.
The author declares no conflict of interest.

©2017 Páramo-Vargas, et al. This is an open access article distributed under the terms of the, which permits unrestricted use, distribution, and build upon your work non-commercially.