MOJ
eISSN: 2573-2919


Research Article Volume 2 Issue 8
Faculty of Maritime Engineering, Biological, Oceanic and Natural Resources Sciences FIMCBOR, Higher Polytechnic School of the Litoral, Ecuador
Correspondence: Franklin Isaac Ormaza-Gonzalez , ESPOL, Faculty of Maritime Engineering, Biological, Oceanic and Natural Resources Sciences FIMCBOR, Higher Polytechnic School of the Litoral ESPOL, Campus Gustavo Galindo Km 30.5 Va Perimetral, P.O. Box 09-01-5863, Guayaquil, Ecuador
Received: October 09, 2017 | Published: December 15, 2017
Citation: Ormaza-González FI, Cedeño J (2017) Coastal El Niño 2017 or Simply: The Carnival Coastal Warming Event?. MOJ Eco Environ Sci 2(8): 00054. DOI: 10.15406/mojes.2017.02.00054
During February, strong north-easterly trade winds from the Caribbean Sea blew through the Panama isthmus and pushed surface waters (SST up to 29.8°C) southward. This condition, together with the abrupt weakening of south-easterly trade winds, produced a rapid-short lived but intense warming of the surface waters of Niño 1+2 region from February to March 2017. The sudden warming provoked anomalies up to +2.6°C (15 marches): i.e. over 29.1°C; at the same time in 3.4, the anomaly was -0.1°C. The ZCIT moved quickly southward from 4-5°N to 8°S in a few days and remained there for 4-6 weeks. The average rain (Jan-Apr; 1980-2010) on Ecuador coast (6 stations) was 4391.5 mm, whilst in 2017, it was 4312.3 mm. The SOI was on average +0.22 (Jan-May 2017) and 0.9 in March. The thermo cline did not deepen below 30 m; during El Niño, it is deeper than 100 m. Sea level anomalies were static around 5 cm, but during El Niño 1997-98, they were over 40 cm. Fisheries were not evidently affected, in fact the Peruvian fishing sector grew >82% in the first semester, mainly due to the anchovy (Engraulis ringens) captures. The Ecuadorian fleet catches of skip jack (Katsuwonus pelamis), yellow fin (Thunnus albacares) and big eye (Thunnus obesus) were 17.5, 8.3 and 50.6 % higher than at the same period in 2016. By mid-May 2017, anomalies in 1+2 fell to 0.4°C and there was a quick cooling down process. Calling this event as “El Niño Costero” is incorrect and brings erroneous and confusing response from society. Hereafter, analogously to the term “El Niño”, it is proposed to call this phenomenon “Carnival Coastal Warming” or simply “El Carnaval”, as the carnival festivities are in February-March; or even simpler: Rapid Coastal Warming event.
Keywords: El Niño; El Niño Costero; Niño 1+2, ZCIT; Panamá Bay; Anchovy; Tuna; El Carnaval
The sole two words “El Niño” could rise strong fears and worries to Ecuadorian and Peruvian societies due to the impact on social, economic, environmental, industrial-transport infrastructure, health systems, etc. that this natural event has brought in the past: specially during el Niño 1997-1998.1,2 Environmental impact is huge in terms of diluvial rain episodes,3 release of gases to the atmosphere as their solubility decreases because the sea surface temperature (SST) increases nutrient depletion4 and reduction of photosynthesis.5 The whole marine trophic chain is negatively affected: this include important fish stocks as small and big pelagic fish.6,7 El Niño8,9 is a relatively low frequency (inter-annual) and non-cycled oceanographic-atmospheric coupled process whose definition is referred to the area Niño 3.4 (Figure 1). The NOAA-CPC defines el Niño event when the Oceanic El Niño Index (ONI), which is measured in terms the SST anomalies in 3.4, is >0.5°C over three consecutive months, and coupled to atmospheric conditions: among them the Southern Oscillation Index.10 The oceanic variability from 3.4 is then progressively transferred to the Eastern Pacific through internal Kelvin waves,11 particularly to Niño 1+2: Ecuadorian and Peruvian coasts.2 The contrary event is the so-called La Niña. During 2015, there was a declared El Niño event, but the transfer of energy was not registered at the expected levels; rain average was under average in Ecuador for example. Early 2016, Ormaza-González12 suggested the end of El Niño 2015, and the possible La Niña; the SST anomalies in Niño 3.4 went under -0.5C by mid-2016. In September, La Niña was declared by CPC-NOAA, therefore negative SST anomalies were also expected in 1+2, but it did not happen. Unexpectedly in 1+2, the SST increased rapidly, the ZCIT went to 5-8°S latitude and heavy rain episodes produced important floods with the destruction of infrastructure and even dozens of deaths. The media started mentioning El Niño was present, and alarms and actions took place in Ecuador and Perú; also, some scientist started calling this event as El Niño Costero.13 This work attempts to clarify this event from the already accepted concepts and parameters of El Niño, ascertain it there was a Niña Modoki,14 propose not to use the term El Niño due the social impact it has in Ecuador (e.g. P1, P2 and P3), Perú (P4, P5, P6) and the world; and therefore, suggest a name for it.
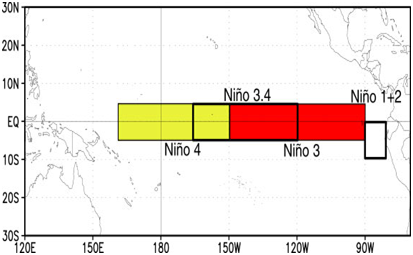
Figure 1 The four El Niño regions.
Source: CPC-NOAA.22
The El Niño indexes (based on SST and their anomalies in the equatorial Pacific, Huang et al., 2017) are available from CPC-NOAA at http://www.cpc.ncep.noaa.gov/products/analysis_monitoring/ensostuff/ensoyears.shtml The Southern Oscillation Index (SOI) was taken from https://www.ncdc.noaa.gov/teleconnections/enso/indicators/soi/
The sea level anomalies data correspond to Duacs-2014 satellite altimetry product. Duacs-2014 is produced by Aviso Ssalto/Duacs Team, and distributed by Copernicus Marine Environment Monitoring Service at: ftp://ftp.sltac.cls.fr/Core/ SEALEVEL_GLO_PHY_L4_NRT_OBSERVATIONS_008_046/dataset-duacs-nrt-global-merged-allsat-phy-l4-v3/ This information was complemented with monthly data of SST and surface winds of MUR (Multiple Ultra-High Resolution) and FNMOC (Fleet Numerical Meteorology and Oceanography Center) products, respectively, obtained from ERDDAP-NOAA repository (https://coastwatch.pfeg.noaa.gov/erddap/index.html).
The Sea Surface Temperature (SST) Anomaly and Wind Vector are shown in the Figure 2. It is bizarre the influence of the winds over the Eastern Tropical Pacific, particularly on Panama Bay. The sudden surface warming in 1+2 started by the end of January 2017, when North Atlantic strong trade winds crossed the Panama isthmus at speeds higher than 10 ms-1, and started pushing southward the typically warm surface waters of Panama Bay, which can register temperatures between 26-28C, and as high as 29.8C.15 The Figure 2 shows how the wind speed (8 to>9 ms-1) increased remarkably from January to March when the peak of the warm event was ostensible, but in April substantially dropped to around 6 m s-1, whilst the south Pacific trade winds were around 4 and then ≥6 m s-1, respectively. These trade winds in turn, blew down the ZCIT from 5-8 N to around 8S as generally occurs,14 but very rapidly. The SST anomalies of Panama Bay started to decrease, thus in January the positive anomalies around +1.0C passed to around -1.5C in 2-3 weeks, whereas SST anomalies in some parts of 1+2 changed from -2C to +3C. By the beginning of February, the upwelling was very strong at Panama Bay,15 the SST anomalies were as low as -3C; on the contrary, in 1+2, positive anomalies spread very quickly reaching to +4C. During March, the Bay of Panama SST were returning to neutral, whilst in 1+2 the SST anomalies reached to +5C in some places and spreading westward; the average anomaly was +2.6C (15 march); i.e., SST over 29.1C, while in 3.4 the anomaly was -0.1C. However, during the first fortnight of April anomalies tended to decrease dramatically, even moved from positive to negative in the southern and coastal area of 1+2 in matters of days, and the westward spreading substantially declined. By the last two weeks of April, negative anomalies predominate in 1+2 and west region 3. The Figure 3 shows how the anomalies in the four El Niño regions developed in time; thus, during Jan-Apr negative anomalies were in region 4, and in 3.4 they persisted through March. In 1+2 SST anomalies were positive (<0.5 C) or close to neutral values practically throughout 2016; although, they were negative in 4, 3.4 and 3. When el Niño occurs, the 4 regions presents positive anomalies, and higher positive anomalies come from west to east: i.e. Niño 4, 3.4 and 3 to 1+2, not in other way. The thermocline during El Niño deepens along the equatorial Pacific, in 1+2 records have registered over 120 m, when normally it is 30-50 m. During the warm event, it did not extend below 50 m (CPC-NOAA reports: http://www.cpc.ncep.noaa.gov/products/precip/CWlink/MJO/enso.shtml) The SOI, was on average +0.22 (January-May) and specifically+0.9 at the peak of the coastal warm event. Part of El Niño definition is that SOI must be coupled to the ONI.16 To have a full fledge El Niño, the SOI should be negative and averaging 0.7 for several months in harmony to positive ONI (>+0.5C). This was not the case in Jan-Apr 2017.
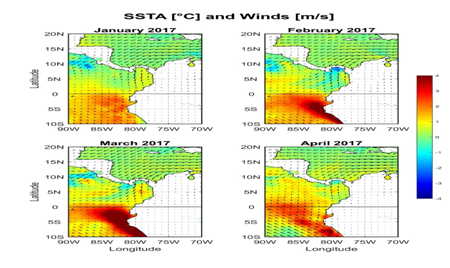
Figure 2 Sea Surface Temperature Anomaly and Surface Winds over the Eastern Tropical Pacific and inner part of the Caribbean, during January-April of 2017. Data: MUR SSTA and FNMOC winds through ERDDAP-NOAA.
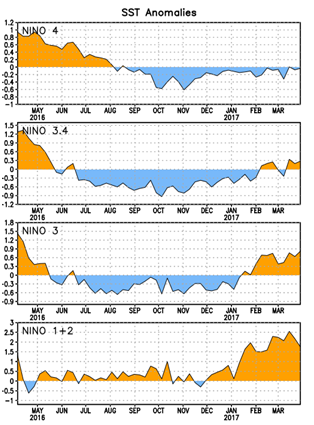
Figure 3 SST anomalies in time, in regions 4, 3.4, 3, and 1+2.
Source: CPC-NOAA.22
Higher SST raises the Sea Level Anomaly (SLA) in the equatorial eastern Pacific as the water column expands. The Figure 4 displays the fluctuation of sea level on the Ecuadorian coast during the extraordinary El Niño 1997-98, El Niño 2009-10 and during the 2016-2017 years. The first two El Niño registered SLAs up to 42 and 18 cm above, whilst in the first quarter of 2017, the SLA averaged 5 cm and by the April even the surface depressed to -1 cm. Typically, it is recognized three main phases of the El Niño:17 onset, peak and decaying. In 1997-1998 event, these phases are reflected as an elevation of sea level (due to the propagation of equatorial Kelvin waves) around May-1997 (onset); there was a maximum elevation 42 cm in December-1997 (peak), then progressively started to diminish (decaying) as the SLA decreases along the Equatorial Pacific. This pattern was also observed in El Niño 2009-10 (in a smaller scale), but not during the 2017 event. Previously, in 2016 the sea level was characterized by values around +5 cm (with no relevant intra-seasonal variations), which was maintained during the first quarter of 2017. Heavy and prolonged rain is the worst and most dreadful consequence of El Niño (see press notes P1-P6) particularly in the coastal area of 1+2. Floods apart from doing important material damage can cause deaths.1,2 The Figure 5 illustrates rain records in Esmeraldas and Guayaquil: cities of Ecuador that are badly affected during El Niño; the cumulative rain was <500 mm in 2017, whilst in the Niño 1997-1998 was close to 2500 mm in Esmeraldas, and around 1500 and >4000 mm respectively in Guayaquil. The average rain (Jan-Apr; 1980-2010) on Ecuador coast (6 stations) is 4391.5 mm, whilst in 2017 was 4312.3 mm. Rain records in 2017 did not get even closer to those in El Niño 1997-1998 or 1982-1983. Ecuadorian tuna fisheries are importantly affected by El Niño events5 as well as the Peruvian anchovy and other coastal fisheries;18 the captures are affected throughout the year of El Niño occurrence; however during the first semester of 2017, according to the Sociedad Nacional de Pesquerías (SNP) the Peruvian fishing sector grew >82% (P7), mainly due to the anchovy (Engraulis ringens). On the other hand, the Inter American Tuna Tropical Commission (IATTC) reported that the Ecuadorian tuna fleet catches of skip jack (Katsuwunnus pelamis), Yellow fin (Thunnus albacares) and big eye (Thunnus obesus) were 17.5, 8.3 and 50.6 % higher than at the same period in 2016. Thus, fisheries did not show any impact during Jan-Apr 2017.
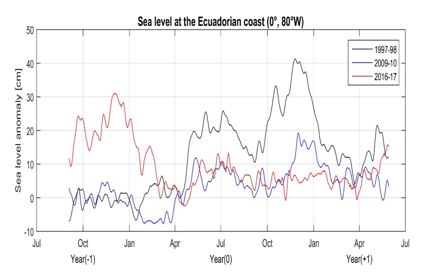
Figure 4 Sea Level Anomaly (SLA) at the Ecuadorian coast during El Niño events of 1997-98, 2009-10, and during the years 2016-17. Following Larkin and Harrison,17 the central year of the event (i.e. 1997) is designated as year “0”. Data from Aviso altimetry through Copernicus Service.
It is found that the main oceanographic and atmospheric conditions associated to El Niño, such as: SST anomalies in 3.4, SOI, rain, wind pattern (direction and speed), thermocline deep, SLA and fisheries in 1+2, as they are defined did not match with the warm surface event of Jan-Apr 2017; although, the SST and its anomalies were high and corresponding to the development of El Niño like the 1997-1998 or 1982-1983. It was ascertained from the linear regression relationships (Figure 6) between SSTs anomalies (1950-2017) in the El Niño regions,19 that the SST anomalies in 1+2 are only 47 % related to those in 3.4; this would be encompassed to the criteria of La Niña / El Niño Modoki occurrences;14 nearly half of El Niño and La Niña events ended in Niño o Niña Modoki but this time, there is not uniform criteria if there was a La Niña Modoki;13 however, this work finds that this coastal warming could be categorized partially as La Niña Modoki.13 It is proposed not to use the terms “El Niño Costero”, because the term “El Niño” must only be used as it is defined and accepted. The use of it in a lax mode could bring erroneous and serious confusing response from society. Hereafter, analogously to the term “El Niño”, it is proposed to call this phenomenon “Carnival Coastal Warming” or simply “El Carnaval”, as carnival festivities are in February-March, or even simpler: Rapid Coastal Warming (RCW) event.20–23
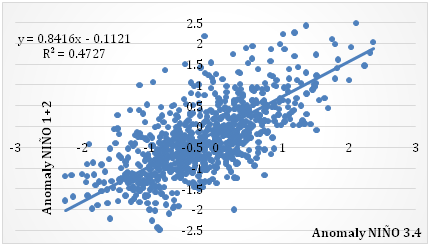
Figure 6 Linear regression of SST anomalies (1950-2017) in region 3.4 and 1+1. From Ormaza-González and Muñoz.19
The authors recognized the support from the Faculty FIMCBOR authorities. Daphne Vera for her kind language review.
We declared there is not conflict of interest.
None.

©2017 Ormaza-González, et al. This is an open access article distributed under the terms of the, which permits unrestricted use, distribution, and build upon your work non-commercially.