MOJ
eISSN: 2573-2919


Review Article Volume 7 Issue 2
Department of Environmental science, COMSATS University Islamabad Abbotabad Campus KP-Pakistan
Correspondence: Anyiam Ngozi Donald, Department of Environmental science, COMSATS University Islamabad Abbotabad Campus KP-Pakistan, Tel +923165556328, +2348034694176
Received: March 07, 2022 | Published: March 18, 2022
Citation: Donald AN, Asif M, Felicien S, et al. A review on the centralised municipal sewage and wastewater treatment unit processes. MOJ Eco Environ Sci. 2022;7(2):31-38. DOI: 10.15406/mojes.2022.07.00244
Wastewater release into water bodies from industries, residential areas and institutions poses a great challenge to public health in many countries of the world, especially in the developing ones like Nigeria and Pakistan. The way and manner by which wastewater is treated (physico-chemically or biologically) has a significant impact on the health of humans and the receiving ecosystem. Wastewater treatment is important and its main objective is to reduce the concentrations of its pollutants to limits set by regulatory bodies before discharge to receiving waters or further treated for other purposes such as recreation, irrigation and drinking water production. Among the major parameters that are usually being treated are the dissolved oxygen (DO), pH, Turbidity, Total Suspended Solids (TSS), Total Dissolved Solids (TDS), Nitrogen (NO3-N, NH4-N), Phosphorus, Biological Oxygen Demand (BOD), Chemical Oxygen Demand (COD), microbes etc. Several treatment methods have been in use, however, this paper presents a comprehensive overview of the conventional approach that employs some physical, chemical and biological processes at the preliminary, primary, secondary and tertiary stages in the treatment of water and wastewater from different sources.
Keywords: wastewater, sewage, bar screen, activated sludge, clarifier, microbes
Water, arguably, the most important of all natural resources is required for the existence of all life on Earth. It is critical for the implementation of development programmes in both rural and urban areas. Despite its significance, many rural and urban residents in Nigeria, Pakistan and other developing nations lack access to safe, portable drinking water. To buttress this point, the World Health Organization (WHO) report reveals that “80% of all human diseases in developing nations are water-borne”.1 And, wells, ponds, and surface waters such as streams and rivers are their primary sources of daily water.2 Despite the fact that these sources are frequently polluted by modern activities, indigenous peoples continue to consume them. Agrochemical run-off from farms, such as fertilisers, pesticides, waste dumpsites, home, industrial, and municipal sewage, are all major sources of surface water contamination. These wastes contain pollutants that place a high demand on oxygen in surface water bodies and have the potential to contaminate subsurface water, particularly near the waste dumpsite. A large number of surface water bodies used by rural populations are vulnerable to biological and chemical damage caused by animal waste, sewage tanks, and rainwater run-off. When water becomes contaminated, it offers a significant public health risk and can lead to diseases including cholera, diarrhea, typhoid, and others.3
Uses of water
Water is an essential item used for a variety of purposes, without which life for living organisms in their immediate environment would be impossible and its significance cannot be overstated. Water quality affects how much water is used in any environment. A given quality of water may be great for irrigation of agricultural crops but not for human consumption, and whatever purpose a type of water is intended to serve, it is recommended that it meets regulatory criteria. Agriculture consumes more water than any other human activity on the planet, without a doubt. According to a United Nations FAO data from 2002, "up to 270 million hectares of agricultural land were irrigated worldwide, accounting for 18% of total arable area." "Irrigation accounts for around forty percent of total agricultural produce," the report continued. Water is essential in agriculture for a variety of important activities, to put it simply. With the presence of water in the form of moisture in the soil, it maintains the temperature balance and biochemical activities of plants/crops, and minerals and salts are leached away from plant roots. Water is used for activities such as washing, cleaning, bathing, cooking and beverage preparation in both rural and urban regions. Water is also utilised to cool motors, generate power, breed aquatic life, treat landfills, transport people, and participate in recreational activities. Although some of these water services do not directly help man, they do greatly improve the ecosystem's potential to provide some commodities and services that make man's existence easier.4
Water pollution and its quality requirements
According to Balasuriya.,5 “water pollution is any direct or indirect alteration of the physical, thermal, chemical, biological, or radioactive properties of any part of the environment caused by the discharge, emission, or deposit of wastes in such a way that it adversely affects any beneficial use or creates a condition that is hazardous to public health, safety, or welfare of animals, birds, wildlife, aquatic life, or plants of all kinds. Water pollution, which is a global issue, is simply the introduction of foreign bodies into water resources, altering their quality and rendering them unsuited for natural ecosystem usage." The indiscriminate garbage disposal on land and in surface water causes water pollution, a major ecosystem concerns that countries, particularly the industrialised ones, are currently facing.6 It can be found in both urban and rural areas. Surface waterways are a well-known supply of drinking water for rural residents, but due to anthropogenic activities such as agricultural and industrial operations, these natural water sources become contaminated at the same time, altering their ecological condition and posing public health risks.7,8 Many sources of water contamination have been discovered since the industrial revolution. As a result, several environmental systems such as soil, water, and air may get contaminated. The rising number of cases of water-borne infections is a sign of escalating water contamination, needing immediate action by all stakeholders. Aside from pollution from airborne particles, industrial effluents play a significant role in the level of trace metals in natural waters.9
The numbers of classes of contaminants detected in groundwater are increasing rapidly, but they can be broadly classified into three major types: (i) chemical (ii) biological, and (iii) radioactive contaminants. These contaminants can come from natural and anthropogenic sources.10 The natural sources of groundwater contamination include seawater, brackish water, surface waters with poor quality, and mineral deposits. These natural sources may become serious sources of contamination if human activities upset the natural environmental balance, such as depletion of aquifers leading to saltwater intrusion, acid mine drainage as a result of exploitation of mineral resources, and leaching of hazardous chemicals as a result of excessive irrigation.11 It is worthy to note that all surface waters, including lakes, streams, reservoirs, wetlands, and estuaries, interact with groundwater in one way or the other. When water is withdrawn from rivers or streams, this results in a decrease in the amount of groundwater. Syphoning groundwater out from an aquifer, on the other hand, can reduce its availability in surface water (rivers, lakes, streams etc.). Agricultural, industrial, and domestic activities pollute groundwater and surface water sources, releasing contaminants such as oil spills, dyes, agrochemicals, Polychlorinated Biphenyls (PCBs), heavy metals, and toxic compounds. As a result of these factors, contaminated surface water can degrade groundwater and vice versa.12 Hence, water accessibility, quality, and aquatic ecosystem services are all influenced by these interactions. Surface water and groundwater are both crucial for appropriate water quality management and should be protected from pollution stresses at all times.
In aquatic environments, water quality refers to the concentrations of inorganic and organic compounds, as well as the composition and status of the biota.13 On the basis of biological, chemical, and physical features, water can be divided into three categories in terms of quality. These quality parameters are evaluated in terms of their origins, affects, effects, definitions, and measurement methodologies, depending on the source.14–16 More specifically, Shah17 believes that "water quality is the state of water in respect to the needs of biotic species/or a specific human goal." These water quality metrics are shown in Table 1 for easier comprehension. Furthermore, due to the constant contamination of groundwater and surface water by the aforementioned sources, regular examination of both is required. The allowed limits proposed by various environmental and drinking water protection agencies at local and international levels, as shown in Table 1, are a result of the amount of water quality impairment. Regulatory authorities propose these water quality requirements to guarantee that a waterbody's intended use is not harmed. As a result, regulatory organisations regularly check water agencies to verify that they follow the established requirements and that a water source is fit for its intended use.
|
S/N |
Physical parameters |
Chemical parameters |
Biological parameters |
|
1 |
Turbidity |
pH |
Bacteria |
|
2 |
Temperature |
Acidity |
Algae |
|
3 |
Color |
Alkalinity |
Viruses |
|
4 |
Taste and odor |
Chloride |
Protozoa |
|
5 |
Solids |
Chlorine residual |
|
|
6 |
Electrical conductivity (EC) |
Sulfate |
|
|
7 |
Nitrogen |
||
|
8 |
Fluoride |
||
|
9 |
Iron and manganese |
||
|
10 |
Copper and zinc |
||
|
11 |
Hardness |
||
|
12 |
Dissolved oxygen |
||
|
13 |
Biochemical oxygen demand (BOD) |
||
|
14 |
Chemical oxygen demand (COD) |
||
|
15 |
Toxic inorganic substances |
||
|
16 |
Toxic organic substances |
||
|
17 |
|
Radioactive substances |
|
Table 1 Water quality parameters
Source: Omer, 201914
Water pollution is a global issue, and in Nigeria, water sources such as streams, lakes, rivers, and ponds are vulnerable to contamination from industrial and domestic pollutants. Poor enforcement of water pollution rules and regulations, is the primary cause of Nigerian rivers' continual contamination.9 This problem with water quality is similar to that which exists in other parts of the world. To address this problem, the Nigerian government, like the governments of many other nations, has implemented water quality standards proposed by local authorities and international regulatory groups. Table 2 and Table 3 indicate these criteria and those of several developed countries, respectively.
|
S/N |
Parameters |
NAFDAC |
SON |
FEPA |
NSDWQ |
|
1 |
Turbidity (NTU) mg/L |
NA |
5 |
25 |
5 |
|
2 |
Total Hardness (mg/L) |
100 |
100 |
NA |
100 |
|
3 |
DO (mg/L) |
- |
- |
≥ 4 |
≥ 6 |
|
4 |
Colour |
NA |
NA |
75 |
NA |
|
5 |
Taste |
NA |
NA |
NA |
NA |
|
6 |
Odour |
NA |
NA |
NA |
NA |
|
7 |
BOD (mg/L) |
4 |
NA |
NA |
NA |
|
8 |
TSS (mg/L) |
NA |
NA |
NA |
500 |
|
9 |
TDS (mg/L) |
500 |
500 |
500 |
500 |
|
10 |
TS (mg/L) |
NA |
NA |
NA |
500 |
|
11 |
SO42- (mg/L) |
100 |
100 |
250 |
100 |
|
12 |
NO3- (mg/L) |
10 |
10 |
20 |
50 |
|
13 |
PO43- (mg/L) |
0.5 |
NA |
0.01-0.03 |
NA |
|
14 |
Cl- (mg/L) |
100 |
100 |
2.5 |
250 |
|
15 |
F- (mg/L) |
1.5 |
NA |
1.5 |
|
|
16 |
pH |
6.5-8.5 |
6.0-9.0 |
6.5-8.5 |
6.5-9.5 |
|
17 |
E Cond. (µs/cm) |
1000 |
1000 |
70 |
1000 |
|
18 |
Temp (oC) |
NA |
NA |
26 |
NA |
|
19 |
Pb (mg/L) |
0.01 |
NA |
NA |
0.01 |
|
20 |
Zn (mg/L) |
5 |
3 |
5 |
3 |
|
21 |
Cd (mg/L) |
0.03 |
0.003 |
0.01 |
0.03 |
|
22 |
As (mg/L) |
0.01 |
0.01 |
0.05 |
0.01 |
|
23 |
Mn (mg/L) |
0.05 |
0.2 |
>0.05 |
0.2 |
|
24 |
Fe (mg/L) |
1 |
NA |
0.3 |
|
|
25 |
Cu (mg/L) |
NA |
NA |
1 |
1 |
|
26 |
Hg (mg/L) |
NA |
0.001 |
NA |
0.001 |
|
27 |
Mg (mg/L) |
NA |
NA |
NA |
NA |
|
28 |
Cyanide |
NA |
NA |
NA |
NA |
|
29 |
Cr (mg/L) |
0.05 |
0.05 |
0.05 |
0.05 |
|
30 |
Se (mg/L) |
NA |
NA |
0.01 |
NA |
|
31 |
Al (mg/L) |
NA |
NA |
NA |
NA |
|
32 |
Ba (mg/L) |
NA |
0.7 |
NA |
0.7 |
|
33 |
H2S (mg/L) |
NA |
0.05 |
NA |
0.05 |
|
34 |
Ni(mg/L) |
NA |
NA |
NA |
0.02 |
|
35 |
Na (mg/L) |
NA |
200 |
NA |
200 |
|
36 |
Detergents (mg/L) |
NA |
0.01 |
NA |
0.01 |
|
37 |
Mineral oil (mg/L) |
NA |
0.003 |
NA |
0.003 |
|
38 |
Pesticides (mg/L) |
NA |
0.01 |
NA |
0.01 |
|
39 |
Phenols (mg/L) |
NA |
0.001 |
NA |
0.001 |
|
40 |
PAHs (mg/L) |
NA |
0.007 |
NA |
0.007 |
|
41 |
TOC (mg/L) |
NA |
5 |
NA |
5 |
|
42 |
Radionuclide Bq/L |
NA |
0.1 |
NA |
0.1 |
|
43 |
Faecal Streptococcus Cfu/100mL |
NA |
0 |
NA |
0 |
|
44 |
Clostridium Perfringens spore Cfu/100mL |
NA |
0 |
NA |
0 |
|
45 |
Total Coliform |
NA |
10 |
NA |
10 |
|
Cfu/100mL |
|||||
|
46 |
E. Coli Cfu/100mL |
NA |
0 |
NA |
0 |
Table 2 Some water quality standards in Nigeria
Sources: Onozeyi,18; Oketola et al.,9; Chinedu et al.,19; Adejuwon & Adelakun,3; Imasuen & Egai,20; Javed & Usmani,21; Joseph et al.,22; Adogo et al.,23; Dahunsi et al.,24
NAFDAC-National Agency for Food, Drugs, Administration and Control, SON-Standard Organization of Nigeria, FEPA-Federal Environmental Protection Agency, NSDWQ-Nigerian Standard for Drinking Water Quality
|
S/N |
Parameters |
WHO |
USEPA |
Pakistan |
China |
|
1 |
Turbidity (NTU) mg/L |
<5 |
NA |
<5 |
|
|
2 |
Total Hardness (mg/L) |
100-500 |
NA |
<500 |
450 |
|
3 |
DO (mg/L) |
NA |
NA |
NA |
NA |
|
4 |
Colour (TCU) |
≤ 15 |
NA |
≤ 15 |
NA |
|
5 |
Taste |
NA |
NA |
NA |
NA |
|
6 |
Odour |
NA |
NA |
NA |
NA |
|
7 |
BOD (mg/L) |
10 |
NA |
NA |
NA |
|
8 |
TSS (mg/L) |
50 |
NA |
NA |
NA |
|
9 |
TDS (mg/L) |
500 |
500 |
<1000 |
1000 |
|
10 |
TS (mg/L) |
1500 |
NA |
NA |
NA |
|
11 |
SO42- (mg/L) |
400 |
NA |
NA |
NA |
|
12 |
NO3- (mg/L) |
50 |
10 |
≤ 50 |
10 |
|
13 |
PO43- (mg/L) |
NA |
NA |
NA |
NA |
|
14 |
Cl- (mg/L) |
250 |
250 |
< 250 |
250 |
|
15 |
Residual Chlorine |
NA |
NA |
0.2-0.5 at consumer end |
NA |
|
0.5-1.5 at source |
|||||
|
16 |
F- (mg/L) |
1.5 |
NA |
≤ 1.5 |
1 |
|
17 |
pH |
6.8 |
6.5-8.5 |
6.5-8.5 |
6.5-8.5 |
|
18 |
E. Cond. (µs/cm) |
1000 |
NA |
NA |
NA |
|
19 |
Temp (oC) |
40 |
NA |
NA |
NA |
|
20 |
Pb (mg/L) |
0.01 |
0 |
≤ 0.05 |
0.01 |
|
21 |
Zn (mg/L) |
5 |
5 |
5 |
1 |
|
22 |
Cd (mg/L) |
0.003 |
0.005 |
0.01 |
0.005 |
|
23 |
As (mg/L) |
0.01 |
0.05 |
≤ 0.05 (P) |
0.01 |
|
24 |
Mn (mg/L) |
0.2 |
0.05 |
≤ 0.5 |
NA |
|
25 |
Fe (mg/L) |
0.3 |
0.3 |
0.3 |
|
|
26 |
Cu (mg/L) |
2 |
1.3 |
2 |
1 |
|
27 |
Hg (mg/L) |
0.001 |
NA |
≤ 0.001 |
0.001 |
|
28 |
Mg (mg/L) |
150 |
NA |
NA |
NA |
|
29 |
CN |
0.05 |
NA |
≤ 0.05 |
0.05 |
|
30 |
Cr (mg/L) |
0.05 |
0.01 |
≤ 0.05 |
0.05 |
|
31 |
Se (mg/L) |
0.01 |
NA |
0.01 (P) |
0.01 |
|
32 |
Al (mg/L) |
0.2 |
NA |
≤ 0.2 |
0.03 |
|
33 |
B (mg/L) |
0.3 |
NA |
0.3 |
0.5 |
|
34 |
Ba (mg/L) |
0.7 |
NA |
0.7 |
0.7 |
|
35 |
H2S (mg/L) |
NA |
NA |
- |
|
|
36 |
Ni(mg/L) |
0.02 |
NA |
≤ 0.02 |
0.02 |
|
37 |
Na (mg/L) |
NA |
NA |
NA |
NA |
|
38 |
Detergents (mg/L) |
NA |
NA |
NA |
NA |
|
39 |
Mineral oil (mg/L) |
NA |
NA |
NA |
NA |
|
40 |
Pesticides (mg/L) |
NA |
NA |
NA |
NA |
|
41 |
Phenols (mg/L) |
≤ 0.002 |
NA |
NA |
NA |
|
42 |
PAHs (g/L) |
NA |
NA |
0.01 (By GCMS) |
NA |
|
43 |
TOC (mg/L) |
NA |
NA |
NA |
NA |
|
44 |
Radionuclide Bq/L |
1 (β-particle) |
1 (β-particle) |
||
|
0.1 (α-particle) |
NA |
0.1 (α-particle) |
NA |
||
|
45 |
Faecal Streptococcus Cfu/100mL |
NA |
NA |
NA |
NA |
|
46 |
Clostridium Perfringens spore Cfu/100mL |
NA |
NA |
NA |
NA |
|
47 |
Total Coliform |
0 |
5 |
NA |
NA |
|
48 |
Cfu/100mL |
||||
|
49 |
E. Coli Cfu/100mL |
0 |
NA |
NA |
NA |
Table 3 Water quality standards in Pakistan, US, Canada and China
NA: Not Available: Cfu: Coliform unit; TOC: Total Organic Carbon; PAH: Polycyclic Aliphatic Hydrocarbon
WHO-World Health Organization; USEPA-United States Environmental Protection Agency
Sources: Onozeyi,18; Oketola et al.,9; Chinedu et al.,19; Imasuen & Egai,20; Javed & Usmani,21; Joseph et al.,22; Adogo et al.,23; Dahunsi et al.,24; Daud et al.,25; Dil et al.,25; Zhao et al.,27
Physical, chemical, and biological unit processes are used to classify wastewater treatment strategies. To reduce wastewater contaminants to acceptable levels, these unit processes use a combination of physical forces (gravity settling or sedimentation, flotation, screening, filtration, etc), biological forces (i.e. aerobic, anaerobic degradation), and chemical forces (i.e. chemical precipitation, ozonation, chlorination, ultra-violet radiation) in a treatment train.28 The unit procedures are used at several stages, including preliminary, primary, secondary, and tertiary treatment (advanced and final treatment), during which toxins in wastewater are reduced or eliminated before being discharged into the environment. Figure 1 depicts the operational steps of a typical wastewater treatment plant.
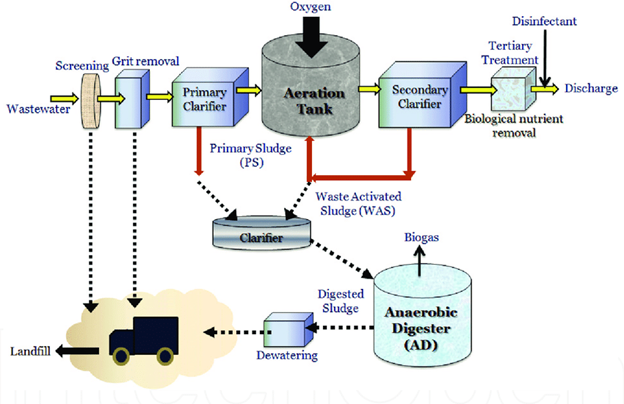
Figure 1 A typical municipal wastewater treatment process.29
Preliminary treatment
Screening and grit removal
As the waste stream enters the plant via sewage lines or channels, these are the first steps in the wastewater treatment process. Bar racks or rotating screens are used in the screening process to eliminate large solid particles such as metals, stones, woods, plastics, sticks, and other things that are larger than the intervals between the bars.4 Depending on the spacing between the bars, coarse, medium, and fine screens are available. This procedure is necessary to safeguard wastewater transport devices (pump and piping), treatment units, and the receiving environment.
The wastewater runs into the grit chamber/tank after leaving the bar screen, where sand grains, gravel, and small particles that were not collected in the screening stage are removed. Due to gravitational force, sand grains and other small debris settle at the bottom of the chamber, while less dense materials are suspended when the water enters the next treatment unit. Following that, the waste gathered in this preliminary step is disposed of in a sanitary landfill. The major goal of the grit removal process is to avoid abrasion of equipment and pipes, as well as to eliminate or reduce the likelihood of clogs in piping, tanks, orifices, and syphons.4 In summary, the primary goal of the preparatory stage is to protect subsequent treatment units and reduce operational issues caused by solid items that can damage pumps, clog pumping equipment, or clog flow channels.30 Figure 2 and Figure 3 depict the bar screen and grit chamber, respectively.
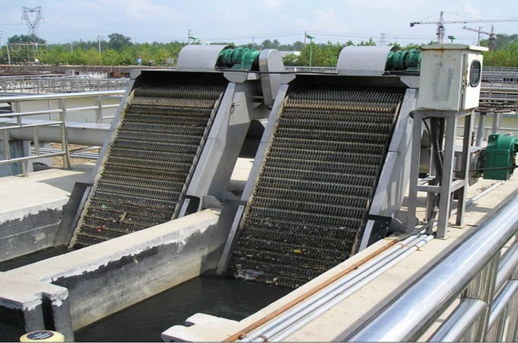
Figure 2 Silver Mechanical Bar Screen For Wastewater/Sewage Treatment Plant Domestic, Bar Rack Water Treatment.
Source: Yixing Holly Technology Co., Ltd, (2022).
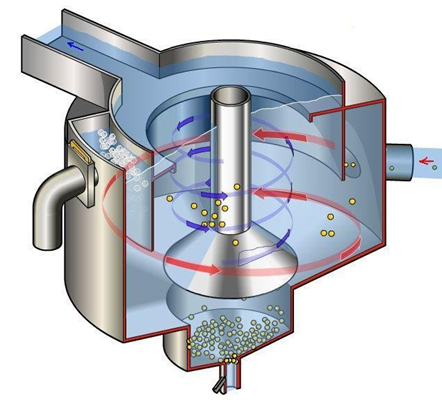
Figure 3 Forced Vortex Grit chamber.31
Primary stage
The primary clarifier, also known as the primary sedimentation tank, is where effluent wastewater flows in after exiting the grit chamber. The wastewater is maintained in a laminar flow for many hours to allow suspended solids to settle down. Chemical oxygen demand and biological oxygen demand exist, if the suspended solids are organic in nature. Furthermore, because gravitational forces do not act on dissolved solids, only those that are adsorbed on suspended solids are trapped down during settling, resulting in a higher percentage of solids being eliminated at this level. In the process, the solid particles sink to the bottom of the tank, whereas oils, fats, and grease float to the top. The sludge, or settle solids, is collected from the base of the tank for treatment in an anaerobic digester. The treatment process continues with the clarified wastewater. A primary clarifier is depicted in Figure 4.
Secondary stage
While physical forces are used exclusively in the preliminary and primary stages, biological forces are used in the secondary stage. As a result, the secondary stage is a biological treatment unit in which microbial operations are used to remove or reduce excess BOD (biological oxygen demand BOD) from partially treated wastewater from the primary clarifier. This secondary treatment stage consists of an aeration tank (or basin) and a secondary clarifier in a plant that uses the activated sludge system (suspended growth process). In the aeration tank, wastewater is combined with farmed bacteria termed "flora and fauna," and the combination is aerated and agitated to speed up the breakdown of organic contaminants. The activated sludge is a mixture of bacteria, yeast, fungus, protozoa, and higher organisms, rather than a pure culture. Microbes consume organic pollutants as a food source, resulting in the biodegradation of the contaminants. Aeration is achieved by turning or mixing the wastewater with mixers or diffused aerators, mechanical surface aerators, or horizontal brush aerators to improve oxygen dissolution and facilitate complete microbial activity. In the aeration basin, the needed dissolved oxygen (DO) is approximately 2-3 mg/L. The secondary clarifier, which is located next to the aeration basin, is where the effluent flows in and is allowed to settle. Microbes grow and flocculate in this clarifier, reaching a sufficient density to form a thick sludge layer at the bottom of the clarifier, which is removed. The separated microorganisms in the bottom of the secondary clarifier go hungry as they wait for more dissolved organic matter to be released. These bacteria are considered to be activated in this setting, hence the term activated sludge. Waste activated sludge (WAS) is removed, and a portion of the settled sludge is recycled back into the aeration basin as "returned activated sludge (RAS)" where it finds food (organics in the effluent from the primary clarifier) to keep the process running. Figure 5 depicts the configuration of the activated sludge process.
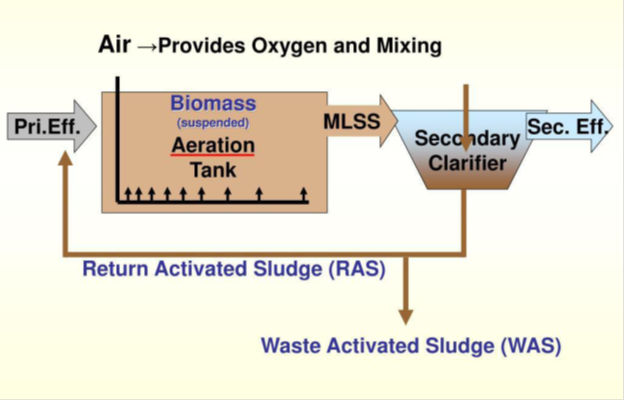
Figure 5 Activated sludge system.
Source: Michigan Department of Environmental Quality Operator Training and Certification Unit, ppt., 2019. https://www.scribd.com/presentation/426922916/Activated-Sludge-process-0-ppt.
The biochemical equation below summarises the mechanism of the activated sludge process for the removal of organic material from wastewater/sewage.
Organic matter + bacteria sufficient O2 CO2 + H2O + NH3 + energy32
The fixed film or attached growth, which includes the trickling filter, rotating biological contactor, and other components, can be used in place of the aeration basin in the secondary treatment stage. In the trickling filter process, water is trickled or sprayed through the air over a bed of coarse, rough, hard, impervious material on which a biofilm (microbes) has developed. As the waste stream drips over the bed and comes into contact with the bacteria, the organic pollutants are broken down or oxidised. Air circulation is achieved either by forcing air through the medium or, more typically, by a temperature difference between the air in the bed and the ambient temperature.33 The filter is usually 3 to 12 feet deep and has an underdrainage system to collect the filter effluent and provide ventilation.32 The rotating biological contactor, on the other hand, is made up of parallel circular discs that are mounted perpendicularly to a horizontal shaft that runs through their centres. The complete assembly is placed in a tank, with the shaft slightly above the liquid's surface and the discs about halfway submerged. Microorganisms develop on the discs' surfaces, and when the shaft rotates, they come into contact with the wastewater, allowing the organic matter to be digested. By exposing the discs to the open air, the microorganisms are able to get the oxygen they require to maintain aerobic growth.33 Although this substrate usage promotes microbial growth, the rotation of the discs in the liquid creates a constant shear stress that causes continuous sloughing of the culture, resulting in a film thickness that is more or less constant. The disk's spinning also mixes the wastewater, keeping the stripped biomass suspended and allowing it to be transported out of the reactor by the effluent.34 Figure 6 and Figure 7 show the trickling filter and RBC setups, respectively.
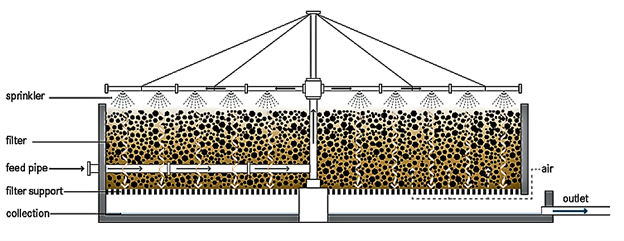
Figure 6 Trickling filter.35
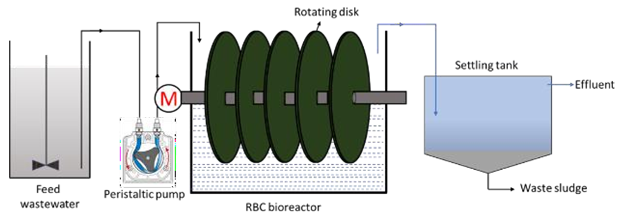
Figure 7 Schematic diagram of a conventional RBC unit.36
Tertiary stage
This is a treatment level that involves the contaminant removal via the addition of chemicals. It is known as advanced wastewater treatment that removes nutrients (Nitrogen, Phosphorus) and pathogens by applying biological and physicochemical processes such as nitrification, denitrification, precipitation, adsorption, disinfection (chlorination, ultra-violet radiation, ozonation). The removal of nitrogen and phosphorus is vital because they induce eutrophication in water bodies, which leads to the death of aquatic species. Because wastewater contains a number of human intestinal pathogens linked to a variety of waterborne diseases, the disinfection process is critical.37 This treatment step is essential when there are concerns that secondary treatment is incapable of protecting surface water bodies from pollution caused by wastewater discharge. And after this final stage, the wastewater is discharged into the environment or receiving water bodies.
The contaminant removal efficiency of each of the stages and unit processes is as shown in the Table 4 below.39
|
Parameter |
Primary |
Secondary |
Tertiary |
|
SS |
50 - 80 |
80 - 90 |
>90 |
|
BOD |
20 - 40 |
70 - 90 |
>90 |
|
P |
<10 |
30 |
>90 |
|
N |
<10 |
30 |
70 |
|
E. Coli |
1 log |
2-3 log |
3-5 (7)* logs |
Table 4 Contaminant removal efficiency38
Environmental contamination, particularly the problem of water pollution, has become a serious concern for everyone, including the general public, industries, research scientists, as well as local and international decision-makers. Reclamation of contaminated water has become a significant issue due to the continual demand for safe and clean water before discharge to surface water bodies. However, because household, municipal, and industrial wastewater all runs into sewer lines on a daily basis, this is a challenging and complex task. When these wastewaters enter water bodies, they have dire effects.
Sewage and wastewater treatment essentially improves the quality of wastewater by removing or reducing contaminants, after which the effluent is either released to the environment or further treated for specific purposes. Suspended solids, grits, BOD, Nitrates, Phosphates, and pathogens are among the removal parameters. The major reason for treatment is to ensure that wastewater is turned into permissible limits for release back into the environment as specified by regulatory agencies. For successful pollutant removal, the treatment process is demanding and necessitates a high level of skill in monitoring each treatment stage. Furthermore, the procedure is necessary and efficient. Treatment processes, when correctly designed and managed, can last for a long time.
In the reclamation process, a variety of conventional wastewater treatment methods are now being used worldwide, and they have been divided into physicochemical and biological processes. Prior to any advanced treatment technologies, these processes are critical in waste water treatment systems. Any wastewater treatment plan requires their expertise and conceptual understanding. This paper has laid bare in detail, the unit processes and operations of physicochemical and biological treatment at a conventional sewage and wastewater treatment plant, with the goal of imparting a thorough knowledge for the successful removal of pollutant from wastewater from various sources.
It is highly recommended that these factors be considered before the establishment and design of any wastewater treatment plant: wastewater source and strength, capital, long-term operating and management costs, treatment targets, skilled personnel availability, and the sensitive and nature of the receiving environment. With respect to developing countries like Nigerian and Pakistan, the centralised processes in combination with advanced treatment of wastewater is ideal owing to high loads of pollutants that are constantly released as a result of inadequate monitoring and poor management of water bodies.
None.
None.
Authors declare that there is no conflict of interest.

©2022 Donald, et al. This is an open access article distributed under the terms of the, which permits unrestricted use, distribution, and build upon your work non-commercially.