MOJ
eISSN: 2575-9094


Research Article Volume 1 Issue 3
Department of Medical Microbiology and Immunology, University of Alberta, Canada.
Correspondence: Nataraj Sekhar Pagadala, PhD, Medical Microbiology and Immunology, Li Ka Shing Institute of Virology, University of Alberta, Edmonton, AB T6G 2E1
Received: July 28, 2017 | Published: August 14, 2017
Citation: pagadala NS. Insilico studies of putative inward rectifier potassium channel AKT1 from rice (Oryza Sativa L.) MOJ Drug Des Develop Ther. 2017;1(3):66-76. DOI: 10.15406/mojddt.2017.01.00012
A homology model has been generated for the pore-forming domain of the AKT1 based on the crystal structure of the bacterial channel protein. The structure having a least modeler objective function was used as a starting point for picoseconds-duration molecular dynamics simulations in a solvated water layer. This was further assessed by ERRAT and PROCHECK, which show that the refined model is reliable. With the built model, a flexible docking study of protein-protein and protein-ligand was performed and the results indicate that Val42, Ser45, Thr66, Lys249, Glu282, Gly41 and Lys249 of subunit-1 are interacting with Thr280, Thr269, Ser40 and Ser39 of subunit-2. PKa calculations of the potassium suggest that Asp278, Glu230, Arg206, Lys199 and Lys249 are predicted to be ionized. Further more Normal mode analysis of the protein suggests that Arg69, Ser221, Ala222 and Tyr225 are important residues responsible for largest amplitude of motion. It was also found that okadaic acid is a more preferred ligand, and that Gly271 forms hydrogen bond with okadaic acid, which showed that glycine of the K+ channel selectivity filter GYG motif. This preliminary analysis of the interactions of the potassium channel with the inhibitors suggests that concerted single-file motion of K+ ions and water through the selectivity filter occurs. This suggests that a single-filling mechanism is conserved between K channel structures and may be robust to changes in simulation details. The hydrogen-bonding interactions also play an important role for the stability of the complex. These computational results provide some new insights into the possible role of glycine in the K+ and importance of AKT1 in various processes of the plant system and may lead to a better understanding of the structures, dynamics, and functions of this family of ion channels.
Keywords: AKT1, homology modeling, molecular dynamics, docking
Potassium (K+) plays a number of key roles in the cell and whole organism level such as osmoregulation, electrical neutralization, stomatal movements, and regulation of gas exchanges and transduction of various signals.1–3 Several families of K+ transport systems were identified during 1990s, and the integration of various molecular, electrophysiological and reverse genetics approaches have already revealed the functions of some of these systems, including those of K+ channels belonging to the so-called Shaker family.3 The first molecular breakthrough in the analysis of membrane K+ transport in plants came in 1992 with the identification of two Arabidopsis K+ channels, AKT14 and KAT1.5 K+ channels are structurally diverse group of proteins that facilitate the flow of K+ ions across cell membranes. They are ubiquitous, being present virtually in all cell types. K+ channels are the best understood transporter family of proteins in plants in terms of gating, second messenger regulation, transport properties, and other predicted functions in different plant cells and membranes. Plant K+ channels also play a key role in K+ uptake, translocation and osmotic regulation too.6,7 The channel-forming core is composed of two transmembrane (TM) helices, separated by a re-entrant loop made up of a short pore (P) helix plus a more extended region of polypeptide that forms the selectivity filter (F). The K+ channel signature sequence amino acids (TXXTVGYGD), conserved in K+ channels throughout the tree of life, form the selectivity filter. The glycine residue present in the inner helix hinge point in most K+ channels allow the inner helices to switch between a closed KcsA-like conformation and an opened MthK like conformation.8 All K+ channels share the same core topology and structure but differ in the number of P-loops and presence of transmembrane domains per monomer. Typical examples of these channels are shaker type 1P/6TM channels,9 the 1P/2TM channels,10 the ORK like 2P/4TM KCO channels11 and the TOK like 2P/8TM channels.12 Electrophysiological analyses have shown that various proteins e.g., kinases, phosphatases, syntaxins and G proteins are involved in the regulation of K+ channel activity.13–16 Structural information on plant K+ channels is limited. Although atomic resolution of the crystal structures of soluble proteins have been reported in an amazingly increasing number, such progress has not been made in terms of membrane transporter proteins, which have proven extremely difficult to crystallize, primarily because of their amphipathic nature and their availability at very low concentrations making over expression a prerequisite for structural analysis.17 However, X-ray structures of integral membrane proteins are known for a few bacterial channels, yet structures of plant homologs are required for analysis of channel-conductance. Homology modeling can be used to come over this deficit. In combination with molecular dynamics simulations and associated calculations, modeling provides a powerful approach in understanding structure/function relationships in plant ion channels. The P-loops of the various K+ channels have strong sequence homologies across the taxa, indicating that they share a similar architecture. This suggests that it may be possible to generate accurate homology models of plant K+ channels by using the bacterial crystal structure as a template. Such models may provide insights into functional (e.g., permeation) properties of plant K+ channels. In this study, one of the rice shaker type K+ channels, AKT1 which was recently cloned18 and functionally characterized as an inward-rectifying K+ channel19 was analyzed by us following the homology modeling, utilizing the crystal structure of 1ORQ (voltage dependent K+ channel protein) as template from Aeropyrum pernix. Effects of calyculin A and okadaic acid, two inhibitors of phosphatase 1 and 2A activities, have been analyzed in guard cells and mesophyll cells of Vicia faba. In guard cells, both okadaic acid20,21 and calyculin A21 inhibited inward K+ currents, the outward currents being either unaffected21 or inhibited.20 In the present study docking studies were carried out with phosphatase inhibitors such as okadaic acid and calyculin-A to know the accurate conformation and orientation of protein with the inhibitors.
Sequence alignment
Various web-based alignment tools performed sequence alignments. Prediction of the location of the TM helices in AKT employed a number of methods, namely, Top-Pred2;22 TMAP;23,24 DAS;25 PHDhtm;26,27 TMHMM;28 and TMPred.29
Potassium channel domain prediction
The domain involved in uptake of potassium was predicted using domain fishing.30 This server was based on the combination of the PDB, the protein family database PFAM,31 and the structural classification of proteins SCOP.32 Templates are taken from the PDB but PFAM and SCOP are then used to rationally split them and the query sequence is split into domains. The initial list of templates for each domain, extracted from PFAM plus PDB and SCOP, is then ranked according to sequence identity (%ID), coverage and resolution. If %ID is less than 30, secondary structure matching is used to filter out false templates.
Homology modeling
The initial model of AKT1 potassium channel domain from Oryza sativa was built by using homology-modeling methods and the MODELLER software; a program for comparative protein structure modeling optimally satisfying spatial restraints derived from the alignment and expressed as probability density functions (pdfs) for the features restrained. The pdfs restrain Cα-Cα distances, main-chain N-O distances, and main-chain and side-chain dihedral angles. The three-dimensional (3D) model of a protein is obtained by optimization of the molecular pdf such that the model violates the input restraints as little as possible. The molecular pdf is derived as a combination of pdfs restraining individual spatial features of the whole molecule. The optimization procedure is a variable target function method that applies the conjugate gradients algorithm to positions of all non-hydrogen atoms. The query sequence from Oryza was searched to find out the related protein structure to be used as a template by the BLAST (Basic Local Alignment Search Tool) program33,34 against PDB (Protein Databank). Sequence that showed maximum identity with high score and less e-value were aligned (Figure 1), and was used as a reference structure to built a 3D model for AKT1. The sequence of AKT1 enzyme (Accession Number: BAC24865) was obtained from NCBI.35 The co-ordinates for the structurally conserved regions (SCRs) for AKT1 were assigned from the template using multiple sequence alignment, based on the Needleman-Wunsch algorithm.36,37

Figure 1 Sequence alignment of 1ORQ vs. AKT1. Only the sequences around the modeled TM domain are given. The red colored boxes indicate the positions of the helices. The blue colored boxes indicated the conserved residues in the alignment.
Molecular dynamics simulations
The structure having the least modeller objective function, obtained from the modeller was improved by molecular dynamics and equilibration methods using NAMD 2.5 software 38 using CHARMM22 force field for lipids and proteins 39-42 along with the TIP3P model for water.43 The simulations began with a 100000-step minimization of the designed side chains and solvent to remove any bad contacts. A cut off of 12 Å (switching function starting at 10 Å) for van der Waals interactions was assumed. An integration time step of 2 fs was used, permitting a multiple time-stepping algorithm44,45 to be employed in which interactions involving covalent bonds were computed every time step. Short-range non bonded interactions were computed every two-time step, and long-range electrostatic forces were computed every four-time step. The pair list of the non bonded interaction was recalculated every ten-time step with a pair list distance of 13.5 Å. The short-range non bonded interactions were defined as van der Waals and electrostatics interactions between particles within 12 Å. A smoothing function was employed for the van der Waals interactions at a distance of 10 Å. The protein backbone, unmutated side chains, and crystallographic water were fixed for this minimization. The backbone atoms were harmonically constrained with a restraining constant of 10.0 kcal/mol/Å2, and the systems were heated to 300 K over the course of 6ps at constant volume. The simulations were equilibrated for 500ps with NPT ensemble (1atm, 300K) while the harmonic constraints were gradually turned off. With no harmonic constraints, the simulations ran for 3 ns in the NPT ensemble using Langevin dynamics at a temperature of 300 K with a damping coefficient of g =5 ps-1.46 Pressure was maintained at 1atm using the Langevin piston method with a piston period of 100fs, a damping time constant of 50fs, and a piston temperature of 300 K.47,48 Nonbonded interactions were smoothly switched off from 10 to 12 Å. The list of non bonded interactions was truncated at 14 Å. Covalent bonds involving hydrogen were held rigid using the SHAKE algorithm, allowing a 2fs time step. Periodic boundary conditions were included for the above studies. Atomic coordinates were saved every 1ps for the trajectory analysis during the last 2 ns of MD simulation. Finally, the graph was drawn by taking RMSD of structures generated during molecular dynamics study on X-axis with time in Ps on Y-axis. Structure with least RMSD difference between the structures generated was used for further studies (Figure 2). The final structure obtained was analyzed by Ramachandran’s map using PROCHECK (Programs to check the Stereo Chemical Quality of Protein Structures),49 and environment profile using ERRAT graph (Structure Evaluation server).50 This model was used for the identification of active site, which is predicted to be the pore forming domain of the potassium channel, and for docking of the inhibitors with the potassium channel.
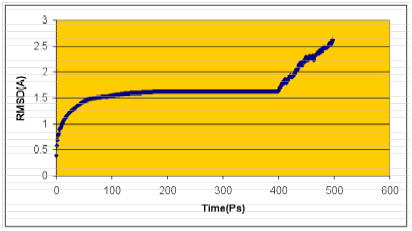
Figure 2 Calculated RMSD graphs of molecular dynamics simulations using NAMD software. Time (Ps) was taken in X-axis and RMSD in Y-axis.
pKa calculations
pKa values are a measure of the protonation of ionizable groups in proteins. Ionizable groups are involved in intra-protein, protein-solvent and protein-ligand interactions as well as solubility, protein folding and catalytic activity. The pKa shift of a group from its intrinsic value is determined by the perturbation of the residue by the environment and can be calculated from three-dimensional structural data. It is widely recognized that conformational stability and functionality of proteins are strongly related to pKa values of amino acids in their specific environment. 51 Thus, we have estimated protonation states of residues in the protein by calculating pKa values with the PROPKA program.52 In a protein, the effective pKa value of ionizable group is determined by applying an environmental perturbation, DpKa, to the intrinsic pK Model value:
(1)
In the employed approximation, pKa value is constituted by inter-molecular hydrogen bonding, desolvation effect and charge-charge interaction contributions51 when the respective residues are not buried within the protein interior. Consequently, PROPKA tend to be more accurate for surface and buried residues respectively.
Normal mode analysis
Normal mode analysis (NMA) is a fast and simple method to calculate vibrational modes and protein flexibility.53 In NMA, sometimes restrained to Ca atoms only, the atoms are modeled as point masses connected by springs, which represent the interatomic force fields. One particular type of NMA is the elastic network model. In this model, the springs connecting each node to all other neighboring nodes are of equal strength, and only the atom pairs within a cutoff distance are considered. The principal of normal mode analysis is to solve an eigen value equation of the form
(2)
Where q is a vector representing the displacements in three dimensions of the various atoms of the molecule, and F is a matrix that can be computed from the mass of the system and potential energy functions. Solutions to the above system are vectors of periodic functions (the normal modes) vibrating in unison at the characteristic frequency of the mode.
Other computational details
Structural diagrams were prepared using OPEN EYE (Open Eye Scientific Software, Santa Fe, NM) and SPDBV software.54
Docking studies
Protein-Protein Docking: The program HEX was employed to conduct the docking of the model built with it to form a dimer.55 The basic approach to the docking problem is to model each molecule using 3D parametric functions, which encode surface shape, electrostatic charge and potential distributions. The surface shape representation uses a novel 3D surface skin model of protein topology, and a novel soft molecular mechanics energy minimization procedure is used to refine the candidate docking solutions. Unlike conventional 3D fast Fourier transform (FFT) docking approaches; HEX uses spherical polar Fourier correlations to accelerate the docking between 10 and 100 times faster than FFT docking algorithm. The docking procedure proceeds in several steps. The four main steps of this algorithm are first; the ligand molecule is (optionally) oriented along the negative z-axis to face the receptor, if knowledge of the ligand-binding surface is available. Second, a low resolution (L=5) spherical harmonic surface is calculated for the receptor. The surface is discretized by projecting it onto an icosahedral tessellation of the sphere. At each triangular facet of the surface, a normal vector is calculated and a 15 Å radius sphere is centered on each outward normal, tangential to the surface. This smothers the surface with spheres. In the third step, iteratively identifying and striking out that sphere which has the greatest volume overlap with its neighbors cull the surface spheres. This procedure is repeated until no overlap volume exceeds 5 Å3. This yields a fairly even distribution of the surviving spheres over the surface of the receptor. Finally, each surviving sphere (normal vector) was used to define a local intermolecular axis for docking, with the initial ligand/axis orientation being transferred onto the outward normal, and a local coordinate origin for the receptor being defined at an equal distance along the inward normal. Here, we used the following parameter set: correlation type=shape, post-processing=none, steric scan=16 (maximum), final search=25 (maximum), the others were default set.
Protein-ligand docking: The ligands, including all hydrogen atoms, were built and optimsed with chemsketch software suite. Extremely Fast Rigid Exhaustive Docking (FRED) version 2.1 was used for docking studies (Open Eye Scientific Software, Santa Fe, NM). This program generates an ensemble of different rigid body orientations (poses) for each compound conformer within the binding pocket and then passes each molecule against a negative image of the binding site. Poses clashing with this ‘bump map’ are eliminated. Poses surviving the bump test are then scored and ranked with a Gaussian shape function. The binding pocket was defined using the ligand-free protein structure and a box enclosing the binding site. This box was defined by extending the size of a ligand by 4Å (addbox parameter of FRED). This dimension was considered here appropriate to allow, for instance, compounds larger than the co-crystallized ones to fit into the binding site. One unique pose for each of the best-scored compounds was saved for the subsequent steps. The compounds used for docking was converted in 3D with OMEGA (same protocol as above) (Open Eye Scientific Software, Santa Fe, NM, USA). To this set, the active compounds (generation of multi conformer with Omega) corresponding to the modeled protein were added. It is an implementation of multi conformer docking, meaning that a conformational search of the ligand is first carried out, and all relevant low-energy conformations were then rigidly placed in the binding site. This two-step process allows only the remaining six rotational and translational degrees of freedom for the rigid conformer to be considered. The FRED process uses a series of shape-based filters and the default scoring function is based on Gaussian shape fitting.56
Sequence alignment
An optimal sequence alignment is essential to the success of homology modeling. The sequence identity between AKT1 and 1ORQ is; 17% and the percentage of similarity are 32 in the M1 M2 and P-loop regions, making this element of the alignment relatively straightforward. However, for the M1 and M2 helices the sequence identity is rather low. The alignment thus obtained is shown in Figure 1. The first 155 residues are removed from the homology model, which thus corresponds to the central pore-forming domain of the channel with three helices further referred as M1, M2 with an intermediate P helix. The loop between the end of M1 and M2 helices constitute 64 residues and the loop between the end of M1 and the start of the P-helix contains 44 residues. Within the P-helix the LWW motif of 1ORQ is replaced by MYW, and the TVGYG selectivity filter sequence of 1ORQ is conserved in AKT1. It is possible that this conserved glycine may confer some degree of flexibility upon M2, which in turn may be related to channel gating.57 Furthermore TM helices were also predicted from different programs. It can be seen that although the same core regions are identified by most of the algorithms, there are significant differences in the lengths of the TM helices. Predictions of TM helices by four different programs are given in Table 1. In general TM helices predicted by TMHMM were longer than those predicted by other three methods.
TM Helices |
TMHMM |
DAS |
Tmpred |
HMMTOP |
|---|---|---|---|---|
Start--End |
Start--End |
Start--End |
Start--End |
|
Helix 1 |
15---------37 |
15---------32 |
18---------36 |
18---------36 |
Helix 2 |
59----------81 |
68---------76 |
58---------80 |
- |
Helix 3 |
96----------118 |
94---------113 |
91---------113 |
88----------106 |
Table 1 Prediction of Transmembrane helices using different programs.
Homology modeling
A high level of sequence identity should guarantee more accurate alignment between the target sequence and template structure. In the results of BLAST search against PDB, only three-reference proteins, including crystal structure and mechanism of a calcium-gated K+ channel from Methanothermobacter thermautotrophicus (PDB :1LNQ),58 crystal structure of Kvap-33h1 Fv complex from Aeropyrum pernix (PDB:2A0L),59 X-Ray structure of a voltage-dependent K+ channel from Aeropyrum pernix (PDB:1ORQ)60 have a high level of sequence identity and the identity of these three reference proteins with the AKT1 protein are 29%, 22%, and 22% respectively (Table 2). Structurally conserved regions (SCRs) for the model and the template were determined by superimposition of the two structures and multiple sequence alignment (Figure 1). Reference protein 1ORQ was chosen for modeling AKT1 of rice in our subsequent studies. Coordinates from the reference protein (1ORQ) to the SCRs, structurally variable regions (SVRs), N and C-termini were assigned to the target sequence based on the satisfaction of spatial restraints. All side chains of the model protein were set by rotamers. The options used for running the modeler are shown in Table 2. Thus we know that residues 1-23 do not locate near the active site .In our study, residues 1-23 are removed from the model because no homologous region occurs in 1ORQ and these residues do not locate near the active site. Thus the model is made up of residues 24-238.This model was refined by molecular dynamics method and the final stable structure of the AKT1 enzyme obtained is shown in Figures 3 & 4. In molecular dynamics (MD) studies, the structure is stable over several picoseconds of simulation. Root mean square deviations (RMSD) of the protein’s backbone from the starting structure range from 1.6 to 2.5 Å. The final structure with the least RMSD difference between the structures generated was taken for further studies. From Figure 4 it is evident that this enzyme has 8 helices. The final structure was further checked by ERRAT graph and the results have been shown in Figure 4. The overall quality score in the ERRAT graph of 68.644 corresponded to acceptable protein environments (Figure 5). From Figure 5 it apperas that all residues are reasonable, which makes us to believe that the structure of AKT1 is reliable? Finally from the final structure the same 155 residues are removed as done with the sequence analysis. Leaving only M1, M2 and P helices and was used for further studies. The most flexible part of the protein has been found to be the turret region. The selectivity filter is the most rigid, and the TM helices are intermediate, with the inner helix being more rigid than the outer helix. Validation of the model built was carried out using Ramachandran plot calculations computed with the PROCHECK program. The f and j distributions of the Ramachandran plots of non-glycine, non-proline residues are summarized in Figure 6 and Table 3. The RMSD (Root Mean Square Deviation) for covalent bonds relative to the standard dictionary was –0.21 Å and for the covalent angles was –0.48°. Altogether, 99.5% of the residues were in favored and allowed regions. The overall PROCHECK G-factor was -0.08 and ERRAT environment profile was good.The structural superimposition of Ca trace of template and AKT1 enzyme is shown in Figure 7. The weighted RMSD of Ca trace between 1ORQ and AKT1 with respect to Ca was 1.2 Å which further indicated that the homology model was reliable. This model was used for the identification of active site and for docking of the inhibitors with the enzyme AKT. Amino acid sequences of template, and final AKT1 were aligned using CLUSTALW. Given their PDB files, secondary structures were also analyzed and compared by the SWISS PROTEIN DATABANK VIEWER software suite; (http://www.expasy.org/spdbv).55 The secondary structures of template and final AKT1 are highly conserved which showed that final structure is highly reliable as shown in Figure 1 and was further used for active site identification.56-60
PDB |
Protein |
Chain |
Authors |
Identity to AKT1 (%) |
1LNQ |
Crystal structure of Mthk At 3.3 A from Methano thermobacter thermautotrophicus |
A, B, C, D |
Jiang et al.41 |
29% |
2AOL |
Crystal Structure Of Kvap-33h1 Fv Complex from Aeropyrum pernix |
A, B |
Lee et al.42 |
22 |
1ORQ |
X-Ray Structure of a Voltage-Dependent Potassium Channel from Aeropyrum pernix |
C |
Jiang et al.43 |
22 |
Table 2 Data for the closest homologue AKT1 with known 3D structures obtained with the Blast server against PDB.
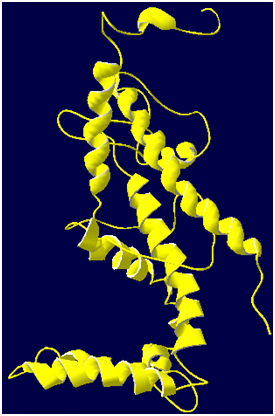
Figure 3 The final 3D structure of AKT1 enzyme. The structure is obtained by energy minimization and equilibration over the last 25000 runs with 50 pico seconds of molecular dynamics simulation. The a-helices is represented in yellow ribbons.
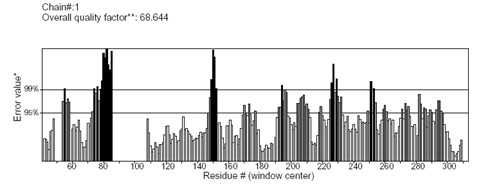
Figure 4 The 3D profiles verified results of AKT1 model using ERRAT program; overall quality factor indicates residues are reasonably folded.
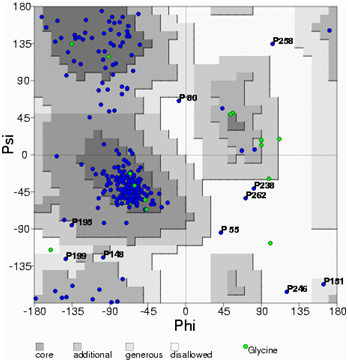
Figure 5 Ramachandran’s map of AKT1 enzyme built using MODELLER software. The plot calculations on 3D model of AKT1 enzyme computed with the PROCHECK program.
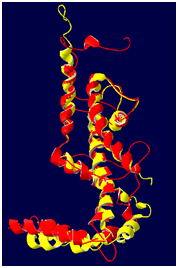
Figure 6 Superimposition of Ca trace of AKT1 (represented in yellow color) and 1ORQ (represented in red color).
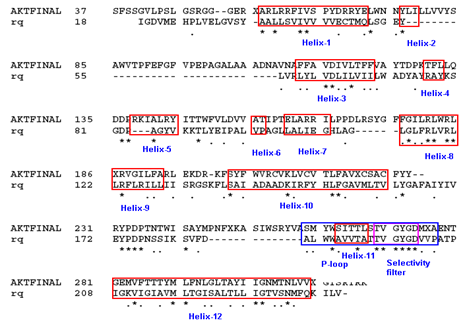
Figure 7 Structure-structure alignment of AKT1 and the template(1ORQ). a-helices is represented in red color boxes.
Comparison of folds, outer surfaces and pore-lining surfaces
As expected, the 1ORQ and AKT1 folds are similar. The P-helix and selectivity filter exhibit very similar (main chain) conformations. The most striking difference between the two structures is the longer M1/P loop in AKT1 with 87 residues compared to 74 residues in 1ORQ and 56 residues in P-loop compared to 33 residues in 1ORQ). This loop has probably adopted a somewhat arbitrary conformation in the homology model. The other noticeable difference between 1ORQ and AKT1 model is the rather longer M2 tail in the AKT1. As both 1ORQ and AKT1 are integral membrane proteins, then, at least in vitro, the outer surfaces of both structures are exposed to a lipid bilayer environment. As this is an anisotropic environment one would expect a corresponding anisotropy in the outer surfaces of the two channel proteins, as is the case in other integral membrane proteins. Such considerations were not (explicitly) included in the alignment and homology modeling procedure. So, visualization of the outer surface of the AKT1 model and comparison with that of 1ORQ provides a simple, if somewhat crude, evaluation of the plausibility of the homology model. Examination of the distribution of polar versus apolar side chains on the surfaces of the two structures (Figure 8) reveals that both AKT1 and 1ORQ exhibit a segregation of side chains common to most integral membrane proteins. Thus, the polar residues are clustered at either end of the molecule (corresponding to the lipid head group/water interfacial region of the bilayer), and in each case, there is a broad central band of predominantly hydrophobic side chains. We also examined the distribution of amphipathic aromatic residues (i.e., Trp and Tyr). Several studies61,62 have indicated that these two residues are preferentially located in two rings on the surface of membrane proteins, corresponding to the position of the lipid head group/water interface when the protein is embedded in a bilayer. This location may reflect the ability of such residues to form favorable H-bonding interactions with lipid head groups (as suggested by some simulation studies,63 or may be a more general consequence of the shape and aromaticity of such side chains.62 Comparison of the distribution of Trp and Tyr residues on the outer surfaces of AKT1 and 1ORQ reveals rings of such side chains at either end of the molecule. The approximate distances between the two rings are 3.7 nm for AKT1, which is consistent with a bilayer thickness of 3 nm. Thus, the outer surface of the AKT1 molecule looks like that of an integral membrane protein. Of course, this is not strong proof that the homology model is correct, but it does suggest that the global distribution of side-chain types is compatible with what we expect for a membrane protein (Figures 9A & 9B).
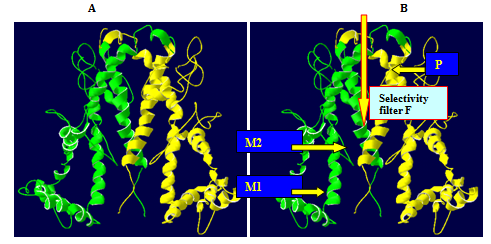
Figure 8 Schematic diagrams of the structures of AKT1 (A and B) In A and B the view is down the extracellular end of the protein from the pore axis. In A the view is perpendicular to the pore axis, with the extracellular mouth at the bottom of the diagram and only two subunits shown (for clarity). In B the M1 and M2 transmembrane helices, the P helix, the selectivity filter loop (F), and the N and C termini of the peptide chain are indicated. This and subsequent structure diagrams were drawn with SPDBV and OPENEYE software’s.
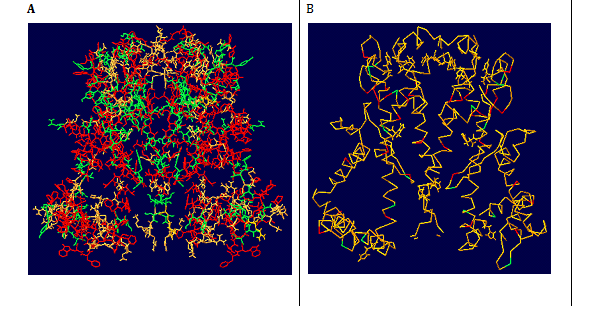
Figure 9 Molecular surfaces of AKT1 (A and B). In A polar residue are indicated in green and non-polar residues are indicated in red colours. In B all the residues are in orange colour expect for Trp and Tyr, which are in green and red colours. Both polar and Trp/Tyr side chains can be seen to form bands on the surface of the molecules that correspond to the presumed location of the lipid headgroups in a bilayer.
We have also examined the inner, pore-lining surfaces of 1ORQ and AKT1 (Figure 10B). Both structures have five rings of O atoms that form the selectivity filter, namely the Og of T, and the carbonyl oxygens of the TVGY backbone. These rings of oxygens occupy very similar locations in the two structures, indicating that the homology model has preserved the essentials of the selectivity filter structure. Turning to the central cavity, in AKT1 this is lined by predominantly apolar side chains. Thus, in both the bacterial channel and the homology model, the properties of the lining of the cavity appear to be conserved and the non-polar residues Ser268, Thr269, Tyr272, Asn279, Thr280, Thr286, 287, 288, Tyr289, Asn293, Thr297, Tyr299, Asn303, Thr305, and, Thr312, Ser313, and Thr315 in AKT1 forms the pore lining surfaces. In these residues Thr269, Tyr299, Asn303 and Asn306 of subunit A form hydrogen-bonding interactions with Tyr66, Ile301, Asn303 and Asn306. Furthermore, no salt bridges are seen during the interactions. One may also examine the nature of the side chains at either mouth of the pore. In AKT1 there is a ring of acidic side chains at either mouth of the pore. A ring of D274, E 278 and 282 side chains guards the extra cellular mouth of AKT1; the intracellular mouth is guarded by positively charged residues like Lys and Arg. Thus, the extra cellular mouth has rings of Asp274, Glu278 and Glu282 side chains, and the intracellular mouth has a ring of Arg314, Arg316 and Lys317 side chains.
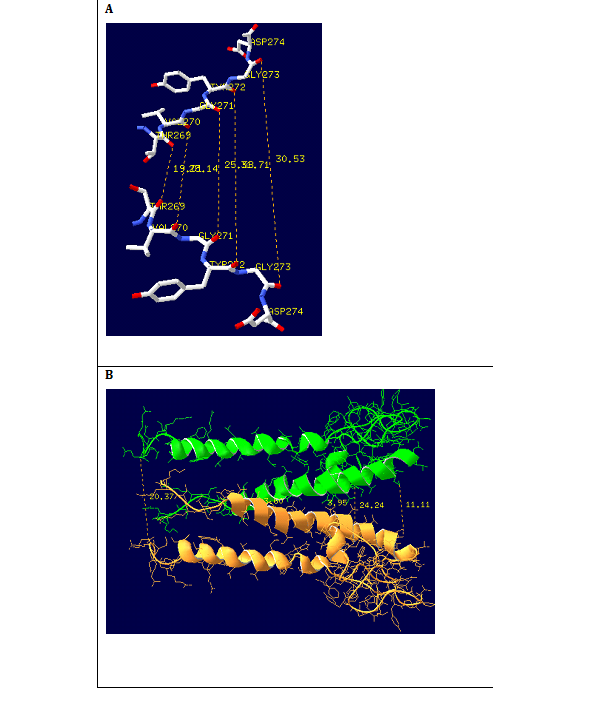
Figure 10 (A) Cross-section of the model channel. Shown are the hydrophobic pore and selectivity filter protein. The solid lines indicated the distances between the extra cellular, central cavity and intracellular openings. (B)Projections of the two subunits forming the selectivity filter. Carbon, nitrogen and oxygen are shown in white, blue and red respectively. Dotted lines indicate the distances between the residues in the selectivity filter.
S.No |
Hydrogen Bonding Interactions |
Subunit1--Subunit2 |
|
1 |
Thr66-------------------------Thr269 |
2 |
Tyr299------------------------Ile301 |
Table 3 Hydrogen bonding interactions between dimer subunits.
Pore dimensions
The homology model includes a narrow selectivity filter, formed by four peptide chains, augmented by a long hydrophobic channel wall consisting of a wide chamber and interior pore. Much of the selectivity filter (Figure 10A) is reasonably flexible, molding itself according to the positions of water molecules and ions within the pore. Each subunit of the dimmer of peptide chains consists of 124 AKT1 signature sequence amino acids. In this we implement signature sequence of five residues lining the selectivity filter, namely glycine (G1 and G2), tyrosine (Y), valine (V), and threonine (T). The polar CAO and C-O-H groups are directed toward the channel axis. The distances between the extra cellular selectivity filter (F), the central cavity (C) was calculated using SPDBV software as shown in figure 10B. It was found that the distances between the Tyr269, Val270, and Gly271, Thr272, Gly273 residues of the two subunits of the extracellular mouth of the selectivity filter is 1.9, 1.8, 2.5, 2.8 and 3.0 nm and the distance between Leu294 and Asn306 residues of the central cavity is 0.39 and 0.36 nm which shows that the radius of the selectivity filter, and the central cavity are higher than the ionic radius of the potassium ion which is 0.13nm.
Ionizable side chains
The pKa calculations indicated that certain side chains in the AKT1 homology model had their pKas significantly perturbed from their standard values. Thus, at neutral pH, only one of the two Asp278 residues, one of the Glu230, one of the Arg206, and two of the Lys199 and Lys249 residues were predicted to be ionized. Furthermore, one of the two Glu278 was predicted to be protonated. Note that the protonation of one of the two Glu278 residues reduces the magnitude of the ring of negative charge at the extracellular mouth of the channel. Furthermore, most of the residues in the intracellular mouth of the channel contains positively charged residues and suppresses the formation of salt bridges.
Normal mode analysis
Normal mode analysis used to identify the key residues involved in the motion and their most probable direction. It calculates the lowest normal mode of the submitted query, finds and highlights the most mobile structural regions, and shows the direction of the four Ca atoms that move the most (Figure 11). Selection of the four most accurate NMA vectors is based on either supplied B-factors or the prebuilt multiple structural alignment for the corresponding fold family. The four selected atoms are Arg69, Ser221, Ala222 and Tyr225 and are shown in red in the calculated lowest-frequency-normal-mode movie. Residue Thr114, Leu215, Phe216, Ala217, Val218, His219, Cys220, Ser221, Ala222, Cys223, Phe224, and Tyr225 are involved in largest motions and the residues, Phe112 and Phe113, Ala114. Vla115, Asp116, Ile117, Val118, Leu119, and Thr120 are involved in smallest motion. A static picture with all residues ranked and highlighted based on their motion amplitudes (red, largest motion; blue, smallest motion) is also provided.
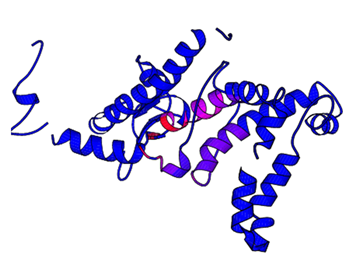
Figure 11 Picture representing all residues ranked and highlighted based on their motion amplitudes using normal mode analysis. (Red, largest motion; blue, smallest motion) is also provided. The four selected atoms are shown in red in the calculated lowest-frequency-normal-mode movie.
Active site identification of AKT1 enzyme
After the final model was built, possible binding sites of AKT1 were searched based on the structural comparison of template and the model built. Since, AKT1 from Oryza sativa and the 1ORQ are well conserved at both sequence and structural level; their biological function should be identical. In fact, from the structure-structure comparison of template, and final refined models of AKT1 using SPDBV program it was found that secondary structures are highly conserved and the residues in the model built, Thr269, Val270, Gly271, Thr272, Gly273, Asp274 (TVGYGD motif) are conserved with the active site of template (Figure 1). Thus, we suggest that uptake of K+ will be similar for both AKT1 of plant and 1ORQ of bacteria. The final stable structure of AKT1 enzyme obtained is shown in Figure 3.
Protein-Protein Docking
The model built was docked with itself using HEX software.58 Based on these protein-protein interactions it was found that Thr66 and Tyr299 of one subunit are interacting with Thr269 and Ile301 of subunit 2. These residues are predicted to be important for the hydrogen bonding interactions between the subunits forming K+ channel as shown in Figure 9 and Table 4. The final subunits complex was shown in Figure 12.
Docking of inhibitors
Docking of the inhibitors okadaic acid, GTP and phylloidin with the dimer of AKT1 from rice was performed using FRED v 2.1, which is based on Rigid Body Shape-Fitting (Open Eye Scientific Software, Santa Fe, NM, USA). To understand the interaction between AKT1 enzyme and inhibitors, the AKT1-inhibitor complex was generated using the OPENEYE software suite (Open Eye Scientific Software, Santa Fe, NM) (Figure 13). These inhibitors are binding with stronger hydrogen bonding interactions with Gly271, Trp 262 and Thr287 residues of dimer of potassium channel of which Gly271 is present in the pore forming region involved in potassium uptake. These hydrogen bonding interactions present in enzyme-inhibitor complex along with their distances and angles are listed in Table 5. This identification, compared with a definition based on the distance from the inhibitors can clearly show the relative significance for every residue. Further it was found that these inhibitors are binding effectively with high scores including chemgauss Score, chem Score, PLP Score, Screen Score and Shape guass Score for the residues in the pore region of protein-inhibitor complex as shown in Table 5. From Table 5 it is evident that AKT1-okadoic acid complex has large favorable total chemgauss score of -95.15, chem score of 6.65, PLP Score of -9.85, Screen Score of -61.48, and Shape guass Score of -727.55. These results indicate that steric interactions, ligand acceptor-protein donor and all metal interactions, contribution from ligand donors interaction with protein acceptors, aromatic-aromatic interactions, frozen rotatable bond penalty, lipophilic-lipophilic interactions, acceptor-metal interactions, hydrogen bond interactions, penalty for ligand clashes with the protein, ligand hydrogen bond donors and acceptors, ligand non-polar atoms, interactions of ligand metal atoms, interactions of ligand sulphur atoms, lipophlic-polar and polar-polar interactions, clash penalty, piecewise Linear Potential, phenyl interactions with amides, methyl and arylCH groups and shape complimentarity between ligand and protein are important for the protein-substrate complex interaction. Through the interaction analysis, it was found that Gly271 of the K+ channel selectivity filter TVGYGD motif is an important anchoring residue for the inhibitor and is the main contributor to the inhibitor interaction. Though the interaction energy does not include contribution from water or the extended enzyme structure, this preliminary data along with the list of hydrogen bond interactions between protein and the pore forming residues clearly supports the fact that Gly271 of TVGYGD motif is a more preferred residue in the binding of inhibitors.
Ligand |
Chemgauss Score |
Chem Score |
PLP Score |
Screen Score |
Shapeguass Score |
Okadaic Acid |
-95.15 |
6.65 |
-9.85 |
-61.48 |
-727.55 |
GTP |
-74.08 |
12.74 |
-29.14 |
-71.51 |
-466.84 |
Phylloidin |
-67.33 |
48.51 |
77.3 |
48.06 |
-670 |
Table 4 The total energies of chemguass score, chemscore, PLP score and shapeguass score of the best-docked conformations.
Ligand |
Hydrogen Bonding |
Distance |
Angle |
Okadaic Acid |
Gly 271 ……..OKA |
3.05 |
73.32 |
GTP |
Trp 262..……. GTP |
2.95 |
113.43 |
Phylloidin |
Thr 287………Phy |
3.01 |
109.96 |
Table 5 Hydrogen bonds along with their distances and angles between the inhibitors and active site residues of AKT1 as deciphered using OPEN EYE software suite.
Potassium channels play important roles in nerve and muscle excitation, hormonal secretion, cell proliferation, and maintenance of osmotic pressure as well as providing important medicinal targets.64 The selectivity of these channels for potassium ions is associated with a conserved sequence motif TXGYG (X is V in KcsA) located in the pore region.65 All potassium channels are thought to share a similar core structure, which was first revealed by x-ray crystallographic studies of KcsA.66 The general architecture of KcsA contains four identical subunits, each comprising three a-helices, are dispersed symmetrically around a common axis central to the pore. Each subunit has two transmembrane (TM) helices and a pore loop between the two TMs. The pore loop comprises a descending pore helix and ascending filter region. The filter region contains potassium-binding sites formed by a ring of backbone oxygen atoms oriented toward the pore interior. There are four potassium-binding sites in the selectivity filter, two at the filter’s mouth, and one in the center of the protein.67 In the present study, we constructed a 3D model of AKT1 enzyme from Oryza using the MODELLER7v7 software and obtained a refined model after molecular dynamics and energy minimization methods. ERRAT and PROCHECK programs further assessed the final refined model, and the results show that this model is reliable. Structural model of AKT protein from rice suggested that these transporters contain P-loop like domains and are related to K+ channels. Here we provide functional evidence that the P-loop like domains indeed determine the substrate specificity of AKT1 transporters. Based on the docking studies it was predicted that a glycine at the predicted filter position in P-loop is necessary and sufficient for K+ permeation in AKT1. However, other residues also contribute to cation selectivity. The highly conserved P-loops of K+ channels all show the characteristic TVGYGD signature sequence. The stable structure is further used for protein-protein and protein-ligand docking studies. Docking results indicate that conserved amino-acid residues in AKT1 enzyme play an important role in maintaining a functional conformation and are directly involved in donor substrate binding. The interaction between the protein and the inhibitors proposed in this study are useful for understanding the potential mechanism of K+ uptake. As is well known, hydrogen bonds play an important role for the structure and function of biological molecules, especially for the AKT1 catalysis. Gly271, Trp262 and Thr287 are important for strong hydrogen bonding interaction with the inhibitors. It is noticeable that, okadaic acid, is the most preferred inhibitor and that there is a simple competitive inhibition between the K+ ion and the okodaic acid. Furthermore, Gly271, Trp262 and Thr287 residues are involved in inhibitor binding and are conserved among these two enzymes (1ORQ and AKT1) and forms hydrogen bonding with the inhibitors. To the best of our knowledge Gly271, of TVGYGD motif was conserved in these two enzymes and may be important for K+ uptake or maintaining the hydrophobicity of the inhibitor-binding pocket.
None.
The author declares no conflict of interest.

©2017 pagadala. This is an open access article distributed under the terms of the, which permits unrestricted use, distribution, and build upon your work non-commercially.