MOJ
eISSN: 2641-9297


Review Article Volume 4 Issue 1
Professor, Colleges of Medicine and Graduate Studies, University of Science Arts and Technology, USA
Correspondence: Orien L Tulp, Professor, Colleges of Medicine and Graduate Studies, University of Science Arts and Technology, Montserrat, BWI MSR1110 and the Einstein Medical Institute, N. Palm Beach, FL, USA 33408
Received: September 21, 2023 | Published: September 28, 2023
Citation: Tulp OL. Differential depot-specific effects of long-term fructose intake on lipoprotein lipase activity and adipose tissue development in lean and obese+NIDDM SHR/Ntul-cp rats. MOJ Research Review. 2023;4(1):4‒9. DOI: 10.15406/mojcrr.2023.04.00063
To determine the effects of a lower glycemic index, fructose-rich diet on parameters of weight gain and adipose tissue cellularity in principle fat depots, groups of congenic lean and obese+NIDDM SHR/tul//-cp rats were fed nutritionally complete isoenergetic diets where 54% of the calories were present as cooked cornstarch (CCS diet) or equal parts CCS and fructose (the CCSF diet) plus essential fats, proteins, minerals and dietary fibers from one until 9 months of age. Initial body weights were similar in all groups. Net weight gain and final body weights of obese >>>lean and demonstrated only a modest trend toward a greater weight gain in obese animals fed the CCSF diet. Differential effects on adipocyte size and number including marked hyperplasia and hypertrophy were observed in retroperitoneal and dorsal fat pads, while the mass and cellularity of the epididymal depots were similar in all dietary and phenotype groups. Tissue Lipoprotein Lipase activity (LPLA) was similar in EPI, RP, and Dorsal fat depots in both phenotypes, but LPLA in IBAT of lean >>> obese and demonstrated a modest diet effect (CSS > CSSF) in both phenotypes. These results indicate that the long-term consumption of the high fructose diet was neither substantially beneficial nor ameliorative in contributing to the modest excess weight gain and adiposity in WAT depots of the obese phenotype of this strain, despite the lower glycemic index and slower luminal digestibility of fructose vs cornstarch when fed in isoenergetic proportions in the diet. In contrast, IBAT mass and cellularity of obese >>> lean, while IBAT LPLA of lean >>> obese, suggestive of improved insulin sensitivity. These results suggest that the excess weight gain and adiposity often attributed to the consumption of excess dietary fructose sources may be at least in part a reflection of net caloric intake and insulinogenic responses rather than the type of carbohydrate consumed. In addition, the greater IBAT mass, cellularity, and percent lipid content of the obese are consistent with early onset hyperphagia and an impaired capacity for energy expenditure via non-shivering thermogenesis and thus represent a likely contributor to the epigenetic expression and development of obesity in the obese phenotype of this strain.
Synopsis
The recent increases in high fructose containing foods and beverages appears to have been arbitrarily attributed at least in part to the greater presence of fructose containing items entering the global food supply in many countries in association with a simultaneous increase in the prevalence of obesity and overweight conditions, particularly among the youth of the populations reviewed.1-5 D direct comparisons between fructose containing vs traditional non-fructose containing isocaloric sweeteners however are scarce or lacking. The effect of a high fructose vs. an isoenergetic cornstarch-based diet on excess weight gain, fat pad mass, and adipose cellularity were determined in lean and obese SHR/Ntul//-cp rats at 9months of age. The initial postweaning body weights of all groups were similar at one month of age, but weight gain was greater in the obese than the lean phenotypes, with a modest trend toward greater body weight and the mass and cellularity of principle fat pads in the obese, fructose fed animals, with differential effects on adipocyte size and number in response to the epigenetic trait for obesity, with less significant direct fructose linked diet effects on adipocyte size and number, while in IBAT, mass and cellularity of obese were greater than their lean littermates, while LPLA of obese was less than their lean littermates. Thus, the lower glycemic index of the fructose enriched diet likely had only a modest, differential direct impact on lipogenesis or on brown adipose tissue development, while phenotype effects were prominent in IBAT and subcutaneous depots.
Keywords: Fructose, obesity, adipose tissue cellularity, rat Abstract.
Although there appear to be few if any direct correlations, the increase in per capita fructose consumption and the rapidly increasing prevalence of overweight and obese conditions appear to have occurred during the same or similar generational timeframes, and with an earlier onset of obesity than has been reported in previous generations.1-7 Indeed, the current consumption of fructose is 4 to 5-fold greater than only a few decades ago, and can now comprise up to 25% of a typical daily caloric intake due to the incorporation of fructose enriched containing sweeteners during the food processing of foods and beverages.1,7 Because of the rapid rise in per capita fructose consumption over such a short generational duration, it has been suggested as a possible contributor to the simultaneously increasing prevalence of obesity and overweight conditions and their common pathophysiologic sequelae including NIDDM, NAFLD and gout.7 Glucose and fructose have a similar chemical structures and empirical formulae as depicted in Figure 1 below (both are C6H12O6), but their structural differences at the C1 and C2 carbon enable glucose but not fructose to undergo cellular uptake efficiently with the cooperation of the insulin-dependent GLUT 4 glucose transporter proteins.8 In contrast, cellular fructose uptake occurs more slowly, in concert with insulin independent GLUT 1 and GLUT5 transporters and facilitated diffusion.9 Both sugars undergo a phosphorylation reaction upon cellular entry, thereby precluding a reversal of their entry process, and presenting them for subsequent intracellular oxidation.10 In addition, fructose enjoys a greater magnitude of sweetness and a lower glycemic index than glucose, thereby making it a more commercially preferable and more palatable constituent of processed foods and drinks.1,5
The commercial manufacture of HFCS began approximately 5 decades ago, following the discovery of the enzyme D-xylose isomerase in 1965.11,12 Typical corn syrup can be treated with the isomerase, resulting in final fructose concentrations of up to 70%, with the predominance of beverages now containing HFCS- 55 and processed foods HFCS-42, representing 55 and 42% fructose content as sweetener replacements respectively.12,13 Coincidentally, the increasing prevalence of overweight conditions has occurred during the same chronologic timeframe.1-7 While the increase in per capita fructose consumption is not known to be pathologically causal per se, the similarity in the chronology of the two events is of interest. Today, HFCS is produced by a cost-effective commercial industrial process.12 To make HFCS, the corn syrup is further processed by D-xylose isomerase, which can convert some of its glucose moieties into fructose, rendering the sweetness equal to sucrose, a common carbohydrate that contributes to the sweetness of many fruits. The introduction of HFCS to the commercial food industry was first noted during the mid- 1970s and has gradually increased in proportion since its introduction, owing to the ready acceptance by the consuming population in addition to the commercial efficiency of production. The Fischer projections of the chemical structure of fructose and d-glucose are depicted in Figure 1, and show the ketone position on C2 of fructose, vs the aldose structure on Carbon 1 of D-glucose.13 In addition, fructose has one less chiral center than D-glucose, and there for the structural and stereochemical differences despite having the same empirical formula [C6H12O6], fructose fails to satisfy the structural and stereochemical identity necessary to bind to the D-glucose specific GLUT4 membrane-linked transporter protein. Thus, it is of interest to compare the physiologic effects of a high fructose vs an isoenergetic cornstarch diet to determine if and to what extent the long-term fructose substitution for cornstarch contributed to the development of excess adiposity and fat accretion in an epigenetic model of obesity and NIDDM.11,12
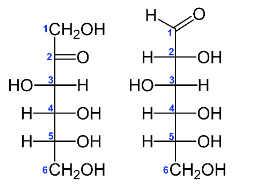
Figure 1 Fischer projections of fructose (left) and d-glucose (right) empiric formula C6H12O6 for both moieties.13
Groups of male lean and congenic obese diabetic (NIDDM) SHR/Ntul//-cp rats originally obtained from the congenic breeding colony at the Veterinary Resources Branch small animal genetics program at the NIH. Rats (n=11-12 rats/group) were fed an isoenergetic diets differing in carbohydrate source from ~1.5 until 9 months of age. The initial body weights of the lean and obese animals were similar (lean = 90.4 ± 5.9 g. vs obese phenotype = 102.6 ± 8.0 respectively; p = n.s.). The diet consisted of (w/w) 54% CHO as cooked cornstarch (CCS diet) or equal parts CCS and fructose (CSSF diet) plus 20% protein (equal pats casein and lactalbumin) 16 %fat (as equal parts lard, corn oil, beef tallow and coconut oil) plus essential vitamins, minerals, (AIN-76 vitamin /mineral mix), and non-nutritive fiber fed ad libitum, from ~1.5 until 9 months of age.14,15 All animals experienced the same environmental housing conditions, including being housed in plexiglass shoebox cages in littermate pairs (I lean plus 1 obese), maintained at 20-22°C room temperature and 50% relative humidity with a reverse light cycle (light 2000-0800 hrs.). Live body weights were obtained initially and periodically throughout the study. At the end of the study, rats were sacrificed by cervical dislocation with a small animal guillotine, truncal bloods collected for later study and the interscapular brown fat depots carefully dissected free of white adipose tissue, weighed to the nearest 0.1 mg to determine fat pad mass, and measures of brown adipocyte size and number determined in representative sections of the tissue as described previously.16-18 Briefly,, the tissue aliquots were fixed in 10% buffered formalin for 24-48 hours, post-fixed with 4% osmic acid (OsO4) for an additional 48-72 hours, washed and sieved with Nitex filters to remove extraneous debris while preserving the doubly fixed adipocytes, and counted in a Coulter Model B particle counter. Cell and tissue lipid content were determined gravimetrically in weighed aliquots of tissue with the method of Dole and Meinertz as performed in our laboratory and expressed a micrograms of lipid per cell and as a percent lipid in the tissue fragment.16-18 Measures of lipoprotein lipase activity per gram of tissue were determined via the method of Shirai and Jackson and expressed as µMols of FFA released per gram of tissue per hour at physiologic temperature (37°C).19 Data were analyzed via standard descriptive and statistical methods including ANOVA and Pages L Test for trend analysis.20,21 This study was approved by the Institutional Ethics, Animal Care and Use Committee (IEACUC) of the University of Science Arts and Technology, Montserrat.
The effect of the high fructose diet on final body weights and weight gain are depicted in Figure 2 and indicate strong phenotype effects (Obese > Lean) for final body weight and net weight gin per rats. In addition, there was only a modest trend (p = < 0.01) for diet effects (CSSF > CSS) in final body weight and net weight gain in the obese phenotype, while the effects of diet on body weight or weight gain were not significant in the lean phenotype. The effects of diet and phenotype on principal fat pad depots is depicted in Figure 3 and indicates a strong phenotype effect occurred (Obese >> Lean) in the Retroperitoneal, Dorsal and IBAT depots, while neither diet nor phenotype were evident in the epididymal depot. In addition, diet effects were not apparent (p = n.s.) in any of the depots measured.
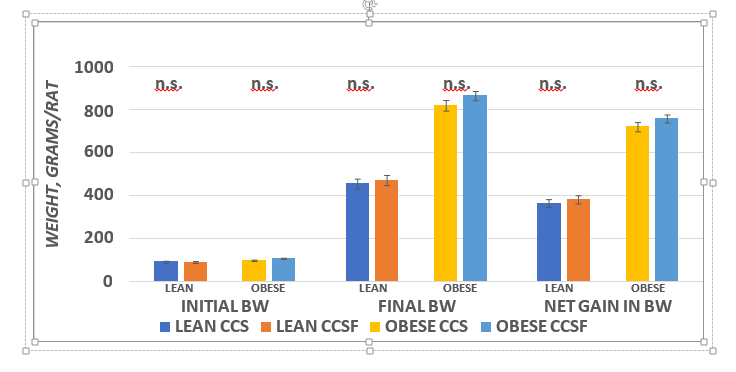
Figure 2 Effect of diet and phenotype on Initial, final and weight gain of rats.BW = body weight in grams. Data are mean ± 1 SEM, n=6 rats / group. ANOVA p + < 0.001 (Lean vs Obese) for final body weights and weight gain; P = n.s. for initial body weights. Diet = trend for final Body Weights and net gain (CCSF > CCS in obese).
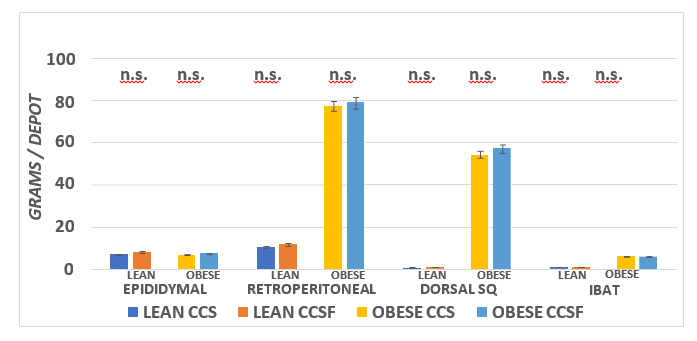
Figure 3 Effect of diet and phenotype on fat pad mass in lean and obese SHR/N-cp rats. Data are Mean ±1 SEM, N= 11-12 rats/group. ANOVA p = < 0.001 for RP, Dorsal SQ and IBAT; p = < 0.05 (trend) for effects of diet in Epididymal and RP fat pads; IBAT Ob >> L with no diet effect.
Differences in adipocyte number per Dorsal and Retroperitoneal WAT depots were significant (Figure 4; Obese > Lean; p = < 0.05) while in the Epididymal depot cell number per depot of Lean was greater than in the obese (p = < 0.05). Diet effects were apparent in the retroperitoneal and dorsal depots (CSS > CSSF) depot as presented in Figure 4 and indicates that phenotype effects were present in all Retroperitoneal and Dorsal depots CSS > CSSF; p = < 0.05) in obese phenotype, while in the epididymal depot the reverse is evident, adipocyte number of Obese CSSF > obese CSS (p = < 0.05) in the fructose fed animals.
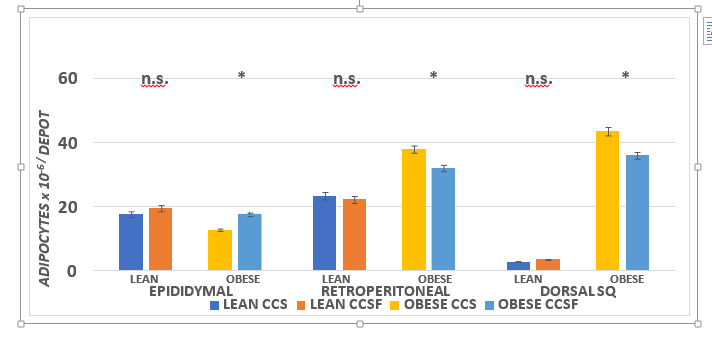
Figure 4 Effect of diet and phenotype on fat pad mass in lean and obese+NIDDM rats. Data are mean ± 1 SEM, n = 11-12 rats/group. Phenotype effects were present at p = > 0.05 for epididymal, retroperitoneal and dorsal subcutaneous depots, and diet effects (CSSF > CSS) for Epididymal and CCS > CSSF for obese retroperitoneal and dorsal subcutaneous depots of obese rats.
Adipocyte lipid content, also often referred to as cell size, are presented in Figure 5 and indicate that phenotype effects were present in the epididymal (left panel) and dorsal depots (Right panel; p = < 0.01) but no phenotype effects on adipocyte size were apparent in the retroperitoneal depot. Diet effects (Obese CSSF > Obese CSF, trend at p < 0.05) but diet effects were not statistically significant in either phenotype or diet group in the epididymal or Dorsal depots.
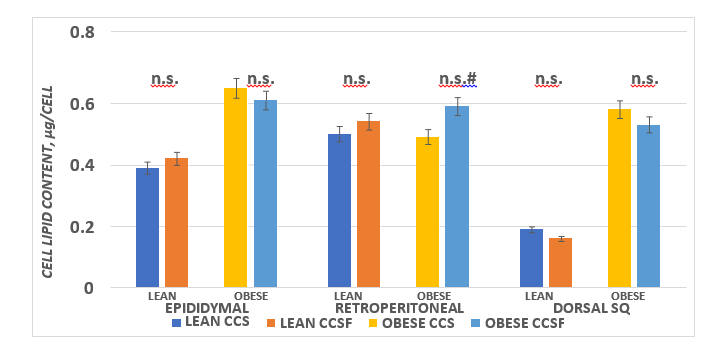
Figure 5 Effect of diet and phenotype on adipocyte lipid content (cell size) in lean and obese+NIDDM rats. Data are mean ± 1 SEM, n = 11-12 rats/group. Phenotype effects were present at p = > 0.05 for epididymal and dorsal subcutaneous depots, and a diet effects trend (CSSF > CSS) for obese retroperitoneal depot. Diet effects were not prominent in other depots in either phenotype.
The effects of diet and phenotype in IBAT mass and proportion of body weight are depicted in Figure 6 and indicate that parameters of phenotype on IBAT mass and as a proportion of final body weight were highly significant, but diet effects were not found in either lean or obese phenotype. The effects of diet and phenotype on brown adipocyte lipid content are presented in Figure 7 and indicate that strong phenotype effects were present ( p = < 0.01) but diet effects on adipocyte lipid content were only present in the obese phenotype (CSS > CSSF). Adipocyte number per IBAT depot are depicted in Figure 8 and indicate that strong phenotype effects on adipocyte number were present (Obese >> lean), but diet effects were indicated only in the lean phenotype (CSSF > CSS), while diet effects were not observed in the obese phenotype.
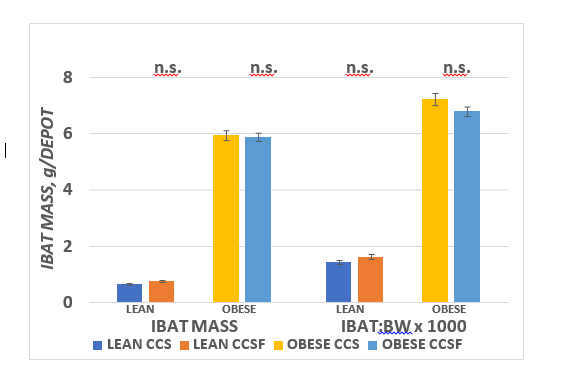
Figure 6 Effect of diet and phenotype on IBAT depot mass in lean and obese+NIDDM rats. Data are mean ± 1 SEM, n = 11-12 rats/group. Phenotype effects were present at p = > 0.001 for IBAT mass (Obese >>> Lean), while diet effects were n.s.
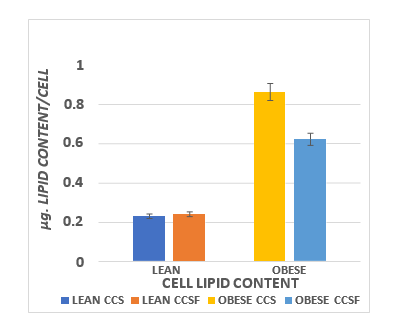
Figure 7 Effect of diet and phenotype on brown adipocyte number per IBAT depot in lean and obese+NIDDM rats. Data are mean ± 1 SEM, n = 11-12 rats/group. Phenotype effects were present at p = >0.001, and a diet effects trend (CSS > CSSF) for obese IBAT cellularity.
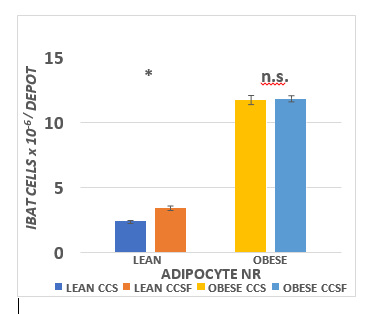
Figure 8 Effect of diet and phenotype on IBAT brown adipocyte number (cell number) in lean and obese+NIDDM rats. Data are mean ± 1 SEM, n = 11-12 rats/group. Phenotype effects were present at p = > 0.001, and a diet effects trend (CSSF > CSS) for lean IBAT cell number.
The effects of diet and phenotype on adipose tissue LPLA activity and adipose tissue lipid content are depicted in Figure 9A, 9B, and 9C. These data indicate that LPL activity was greater in lean than obese in the epididymal depot, with diet effects in the obese phenotype (CSSF > CSS). In the retroperitoneal depot, LPLA activity was only modestly greater in the obese than the lean CSS fed rats and was greater in both phenotypes when fed the CSSF than the CSS diet. In the Dorsal depot (Figure 9B), LPLA activity was similar in both phenotypes and was not affected by the diet.( p = n.s.) In contrast, LPLA activity in IBAT tissue is depicted in the right panel of Figure 9B and indicates that LPLA activity of lean was significantly greater in the lean than the obese phenotype and became further increased when fed the CSSF diet in both phenotypes. Tissue lipid content, expressed as a percent lipid per gram of tissue and likely reflective of insulin activity, is depicted in Figure 9C and indicates that the lipid content of all WAT depots was similar and decreased only modestly in the obese phenotype in the Dorsal depot when fed the CSSF than the CSS diet. In contrast, the lipid percent in the IBAT tissue in the lean phenotype was significantly less than in the obese littermates fed the same diets.
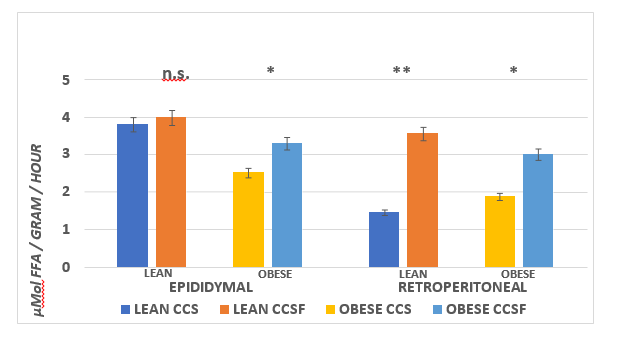
Figure 9A Effect of diet and phenotype on adipose tissue lipoprotein lipase activity (LPLA) in lean and obese+NIDDM rats. Data are mean ± 1 SEM, n = 11-12 rats/group. Phenotype effects were present at p = > 0.05 for epididymal depots, and diet effects (CSSF > CSS) for obese epididymal and CSSF > CSS in both phenotypes in the retroperitoneal depot with the greatest difference noted in the lean animals.
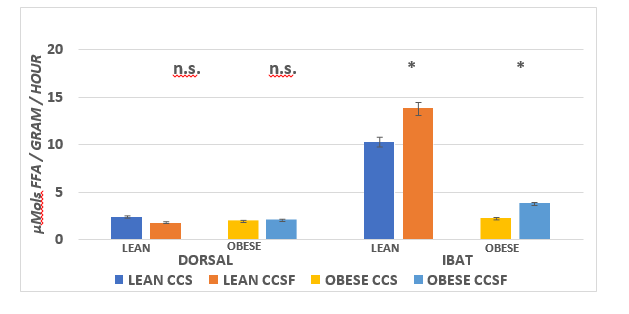
Figure 9B Effect of diet and phenotype on adipose tissue Lipoprotein Lipase Activity (LPLA) in lean and obese+NIDDM rats. Data are mean ± 1 SEM, n = 11-12 rats/group. Phenotype effects were present at p = > 0.05 for the IBAT depots, and diet effects (CSSF > CSS) for both phenotypes in the IBAT depot Phenotype and diet effects were n.s in the Dorsal subcutaneous depot.
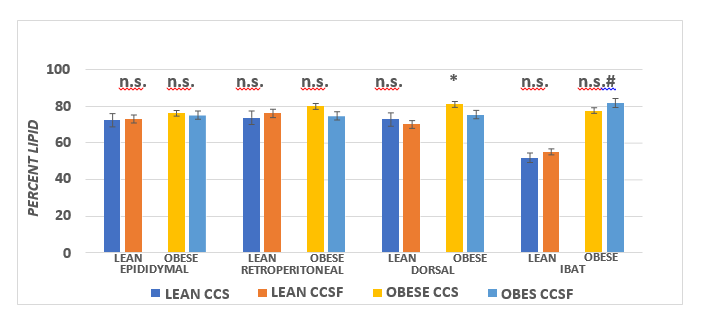
Figure 9C Effect of diet and phenotype on adipose tissue lipid content activity (LPLA) in lean and obese+NIDDM rats. Data are mean ± 1 SEM, n = 11-12 rats/group. Phenotype effects were present at p = > 0.05 for epididymal depots, and diet effects (CSSF > CSS) for obese epididymal and CSSF > CSS in both phenotypes in the retroperitoneal depot with the greatest difference noted in the lean animals.
The results of this study indicate that the high fructose diet had only modest and depot-specific effects on the lipoprotein lipase activity and cellularity of white adipose tissue depots, while phenotype effects were present in all depots. In contrast, measures of brown adipocyte number, IBAT mass, and lipoprotein lipase activity were dramatically different in the brown adipose tissue. While the high fructose diet had a positive impact on the cell number in the lean phenotype, diet effects were not prominent in the obese phenotype, likely because the capacity for diet induced thermogenic activity was already decreased in the obese+NIDDM animals. Impaired nonshivering thermogenesis is a common result of insulin resistance and decreased insulin sensitivity in the NIDDM animals.22-24 Bukowiecki and others have demonstrated that isolated brown adipocytes from the obese SHR/N-cp rats had impaired glucose uptake and utilization, an essential component of the expression of thermogenic activity in brown adipocytes.22-31 Thus, the effect of an isoenergetic, high fructose vs a fructose free diet were not remarkably prominent in explaining the modestly greater weight gain and adiposity in the lean or obese phenotype of this strain, and suggest that the increases in weight gain and cellularity were more likely related to total caloric intake than the carbohydrate source of the diet per se. The lower glycemic index of the fructose-laden diet would be expected to result in a moderation or attenuation in the insulinogenic responses to diet, but the physiologic impact of the obese phenotype appears to have exerted a stronger impact than the dietary carbohydrate source in this study. In contrast, the effects of the high fructose intake on parameters of renal function, while not specifically evaluated in this study, were associated with an unexpected high prevalence of renal calculi likely of uric acid origin not previously observed in the obese+NIDDM animals. Fructose intake when in excessive amounts has long been associated with abnormalities in luminal absorption and adverse metabolic sequelae and suggest that additional studies may be considered to further characterize specific aspects of its disposal in the obese+NIDDM state.
The marked increase in brown adipose tissue mass and adipocyte cellularity in the obese phenotype is characteristic of brown adipose tissue in several strains of rats that demonstrate epigenetic traits for obesity, and likely occurs at least in part due to insulin resistance, in combination with hyperphagia during the preadult growth phase. In the lean phenotype, the greater palatability of the fructose diet was found to promote moderate increase in brown adipocyte number per depot, while in the obese phenotype the increases in mass and cellularity were much more profound. Similar increase in IBAT mass and cellularity were observed in lean Sprague-Dawley rats fed appetizing diets, and in the obese phenotype of LA/Ntul//- cp, SHR/Ntul//-cp in Zucker obese rats.18,26,27 In the lean animals, nonshivering thermogenesis was increased, while in the obese of all strains studied, the capacity for nonshivering thermogenesis in response to factors of diet, environment, and thermogenic pharmacologic agents was consistently decreased. Several authors have proposed that deficits in brown adipose tissue thermogenesis may be contributory if not causal factors in the expression and development of obesity at least in rodents, while the observation in humans remains speculative at best. Historically cadaveric dissections had reported continued findings of brown adipose tissue in adult humans throughout most if not all of the projected lifespan, although moderate decreases in brown adipose tissue, including larger brown adipocytes with greater lipid reserves occurred in approximately one third of the cadaveric specimens of aging humans.32-34 Rothwell, Stock et al observed what appeared to be activated brown adipose tissue via thermography in adult humans, thus clarifying its physiologic functionality in humans and animals.28,29 In conclusion, the contribution of high fructose diets appeared to have miniml additional impact on the expression and development of brown adipose tissue in the insulin resistant obese+NIDDM phenotype, and differential, depot specific effects of a modest nature on the development of obesity. In contrast, the fructose enriched diet resulted in moderate increases in lipoprotein lipase activity and brown adipocyte number in the lean phenotype, and which presumable may contribute to an enhanced thermogenic response following dietary or environmental challenges. Dietary fructose once ingested may result in an attenuated insulinogenic response, and improved oxidation of glucose and other insulin dependent substrates.
The author is appreciative of the Institutional support from the University of Science Arts and Technology, Montserrat for the conduct of this research and the preparation of this manuscript.
None.

©2023 Tulp. This is an open access article distributed under the terms of the, which permits unrestricted use, distribution, and build upon your work non-commercially.