MOJ
eISSN: 2572-8520


Research Article Volume 3 Issue 2
1PhD student of Environmental Engineering-Water Resources, University of Tehran, Iran
2Associate professor, Faculty of Environment, University of Tehran, Iran
3Assistant professor, Faculty of Environment, University of Tehran, Iran
Correspondence: Mohammad Hossein Niksokhan, Department of Environmental Engineering, Faculty of Environment, University of Tehran, Tehran, Iran, Tel 021-61113578
Received: April 28, 2017 | Published: July 21, 2017
Citation: Binesh N, Niksokhan MH, Sarang A. Temperature trend analysis in Kan watershed during two recent decades. MOJ Civil Eng. 2017;3(2):260-264. DOI: 10.15406/mojce.2017.03.00063
Temperature is of the most prominent elements in climatic studies and can be considered the main factor causing climate change. Therefore it is investigated in many climatic researches. In this paper, the changes in maximum, minimum, and average temperature in annual and seasonal scales in Kan Watershed is studies during 1995-2014. In order to do this the data from Chitgar synoptic weather station are used, after examining them in terms of quality and Homogeneity. Linear regression test and Mann-kendal graphical test were applied to the time series to investigate the change points and the time of fluctuations occurred in the temperature in two recent decades in Kan watershed. Also moving average and anomaly of maximum and minimum temperatures were calculated. The results showed that there were no trends in annual and seasonal temperature time series (at significance level of 5%), meanwhile, the temperature has decreased with a slight slope in recent years. In addition, the anomalies of time series are mainly positive, which proves higher max/min temperatures compared to long-term average in Kan watershed during 20 recent years.
Keywords: climate change, temperature, anomaly, mann-kendal, linear regression
Nowadays, climate change phenomenon and climatic elements such as temperature are of the most important subjects which has drawn many attention to themselves. Temperature variability can change the climatic condition of any area, that’s why investigating temperature trend in different times for different locations has formed the majority if climatology studies. Previous studies are representative of increase in temperature in different parts of the world.1−4 In current research, trend of changes in annual and seasonal temperature, and also maximum and minimum temperatures are examined through both linear regression and graphical Mann-Kendal tests,5–6 and then maximum and minimum temperature anomalies alongside their moving average are calculated in order for trend of change in temperature to be identified.
Kan watershed which is located in Solaghan village in Tehran, Iran, is considered as the case study of this paper. This catchment is the largest mountainous basin in northern Tehran7 and is located on the geographic coordinates of 51 ̊10’ to 52 ̊22’ E longitude and 35 ̊46’to 35 ̊57’N latitude. Average height of the watershed is 2417.15 meters above sea level (MASL). Catchment’s area and perimeter are 203 Km2and 85 Km, respectively.8 Figure 1 shows the situation of Kan watershed in Tehran province.
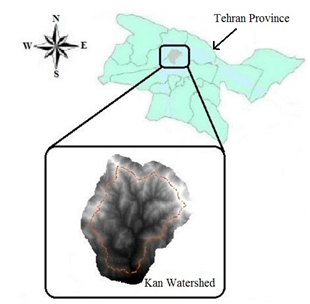
Figure 1 Position of Kan watershed in Tehran province (Iran).8
According to location of the watershed inside Tehran, Chitgar synoptic station (Table 1) is recognized to be suitable in order to determine the catchment’s climatic status.9 After receiving monthly temperature data during 1995-2014 from Iranian meteorological organization database and testing the homogeneity of data and reconstructing lot ones, linear regression test was used based on least square method to identify linear behavior and trend line slope. In addition, graphical Mann-Kendall test was applied to investigate the probable deviation and determining the type and time of change in climatic series of temperature. Mann-Kendall test is one of the most common non-parametric methods in analyzing the trend of meteorological and hydrologic series.10–11 afterwards, in order to calculate anomalies of min and max temperature time series, equations (1) and (2) were used.
Height (MASL) |
Latitude |
Longitude |
Name of synoptic station |
13.05 |
35 ̊ 44’ |
51 ̊ 10’ |
Chitgar |
Table 1 Characteristics of chitgar weather station
In which Pa is the anomaly percent of the given variable, P is the variable value in the given year, and P is its long-term average, n is the period length, and i=1,2,3,…., n.12
Table 2 represents the results of linear regression test for max and min annual and seasonal temperature. According to the results of linear regression, there has been no trend for all time-series of Chitgar temperature. The max and min annual temperature and also winter temperature during 20-year period in Kan watershed had been increasing with a slight slope, while mean annual temperature and also time series of Spring, Summer, and Autumn has decreased during the two investigated decades, and all these changes have been little and non-significant.
Autumn average temperature |
Summer average temperature |
Spring average temperature |
Winter average temperature |
Average annual temperature |
Minimum annual temperature |
Maximum annual temperature |
-0.025 |
-0.015 |
-0.003 |
0.034 |
-0.003 |
0.013 |
0.022 |
Table 2 The results of linear regression for maximum, minimum, and average annual and seasonal temperature of Chitgar synoptic station during 1995-2014
The results of Mann-Kendall graphical test (Figure 2) show that there is no trend (at the 5 percent probability level) for annual average temperature since U and U’ curves have been located inside the ±1.96 critical ranges. However, colliding the two curves for several times is representative of the commence of abrupt changes in temperature in corresponding years, though such jumping points are not significant. It can be said that mean annual temperature has increased at the beginning of the given period, and afterwards, has experienced a declining, oscillating trend until the end of the period. Spring temperature has experienced a similar trend. Summer temperature has the least jumps, and has gone through non-significant (at the 5% level) decreasing trend. In autumn, mean temperature has primarily an ascending trend, however after that, has faced several jumps and fluctuations and has decreased till the end of the studied period. For winter season, in most years there has been an increasing trend, but this trend is interpreted as meaningless (at the 5% level) since the curves have not quit the critical range.13
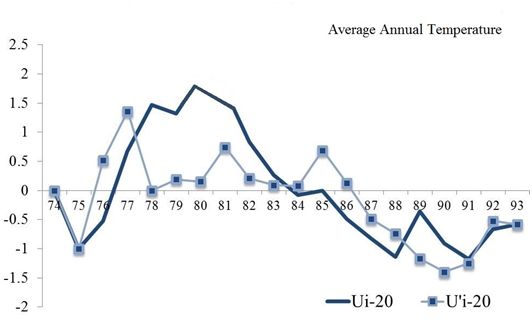
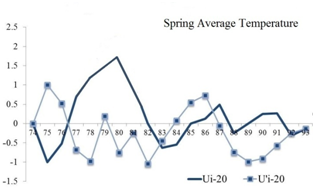
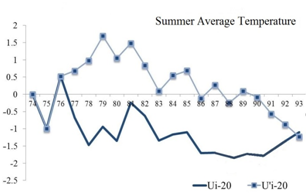

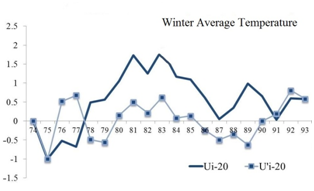
Figure 2 Variability of U and U’ components related to annual and seasonal average temperature of Chitgar station.
Figure 3 shows the results obtained by Mann-Kendall graphical test for two time-series (min and max annual temperature). According to the figure, the graph for min temperature shows increase in some years and decrease in some others. Maximum temperature graph also indicates fluctuations. Minimum temperature graph has more jumps than maximum temperature, which has caused changes and fluctuations in min temperature, though such jumps are non-significant. In both cases U and U’ curves have not exceeded the critical range, which represents that min and max temperature trend is non-significant during the two studied decades.
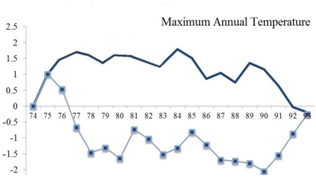
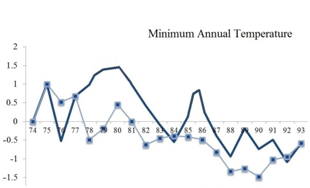
Figure 3 Variability of U and U’ components related to Min/Max annual temperature of Chitgar station.
Figure 4 is related to anomalies of min and max annual temperatures, alongside moving average of each of these variables in Kan watershed during 1995-2014. I can be seen that minimum annual temperature in two investigated decades has been nearly constant, and just a end of the studied period, decrease with a slight slope. However, the values of calculated anomalies for this variable are huge and mostly positive, so that length of time period with negative anomalies is really short. This shows that minimum annual temperature is mainly more than its long-term average. Maximum annual temperature has been also constant during first years of the period, but has decreased after 2009. The amounts of the anomalies are mostly positive, which indicates that maximum annal temperature is more than its long-term average in the catchment.
This paper studied the trend of change in temperature, as a prominent climatic element, in Kan watershed during two recent decades using Chitgar synoptic station. According to applied tests, it can be concluded that in spite of sudden jumps and several fluctuations in the time-series, there has been no meaningful trend (at the 5% level) in the catchment’s temperature during the studied years. In all studied cases in this paper, it could be seen that average, minimum, and maximum annual temperature of the watershed has decreased slightly in recent years, but in the whole two-decade time period, maximum and minimum temperature have experienced a positive, non-significant trend with a slight slope. The anomalies of min and max annual temperature in most years have been positive, which indicates that min and max temperature values from their long-term average. Totally it can be concluded that there has been no significant trend in the temperature of Kan watershed during the two recent decades, and most changes in temperature has occurred with a sight slope and mainly in the form of meaningless fluctuations and sudden changes (at the 5% level).
None.
None.
The authors declare that there is no conflict of interest.

©2017 Binesh, et al. This is an open access article distributed under the terms of the, which permits unrestricted use, distribution, and build upon your work non-commercially.