
Research Article Volume 2 Issue 6
Porosity and Tuotorsity Effect on Flow Pressure in Lacustrine Deposition Applying Predictive Models
Eluozo SN,1
Regret for the inconvenience: we are taking measures to prevent fraudulent form submissions by extractors and page crawlers. Please type the correct Captcha word to see email ID.

Oba KM2
1Department of Civil Engineering, Port Harcourt Rivers State of Nigeria, Nigeria
2Department of Civil Engineering, University of Sciences and Technology, Nigeria
Correspondence: Eluozo SN, Department of Civil Engineering, Subaka Nigeria Limited Port Harcourt Rivers State of Nigeria, Nigeria
Received: March 27, 2017 | Published: June 8, 2017
Citation: Eluozo SN, Oba KM (2017) Porosity and Tuotorsity Effect on Flow Pressure in Lacustrine Deposition Applying Predictive Models. MOJ Civil Eng. 2017;2(6):195-200. DOI: 10.15406/mojce.2017.02.00053
Download PDF
Abstract
This paper studies the rate of permeability passage through Tuotorsity of fluid flow at different soil strata. The rate of fluid flow depends on the permeability of the soil. Such condition has other influences. However, this study monitors fluid flow reflection on the rate of soil permeability through Tuotorsity in the formation. The penetration of fluid is influenced by the structural stratification of the formation. Tuotorsity flows are determined by the structural depositional setting of the soil intercedes. Monitoring the fluid flow condition in lacustrine deposition was possible through the application of mathematical modeling method. The study monitored the permeable condition of the formation to phreatic zone through the effect of Tuotorsity of the formation. The developed model was simulated to express the rate of fluid flow through Tuotorsity to the phreatic zone. Theoretical values were generated from the developed model. The study expressed the rate of permeability through Tuotorsity flow to the phreatic zone. It was confirmed that the permeability was increasing with respect to change in depth under plug flow condition. Subject to this condition, the study produced 4.11E-05, which implies that the condition developed flow based on the deposition from Tuotorsity. This expression implies that the stated parameter influences the low yield rate of phreatic aquifers in the study area. Experts can now use the developed model from this study as a tool in exploitation of groundwater by monitoring the rate of Tuotorsity flow in the study location.
Keywords: Porosity; Tuotorsity; Lacustrine; Predictive model
Introduction
In years past, it has been noted that scaling laws for seepage velocity has been established and applied, but most researchers are yet to understand whether it is the Darcy’s permeability (hydraulic conductivity) or the hydraulic, expressed to be gradient that determines the function of gravity. Thus this has not been thoroughly addressed properly. This concern was investigated by Gooding’s,1 as he pointed out the diverse concepts for scaling flow velocity. Butterfield2 & Dean3 also discussed this issue. Other parameters such as permeability were considered by Pokrovsky & Fyodorov;4 Cargill & Ko;5 Tan & Scott.6 Recently, Singh & Gupta7 including other researcher’s defined permeability (k) to be directly proportional to gravity and hydraulic gradient (i).This implies that gradient is independent of gravity. Furthermore, it explains the reason why seepage velocity has a scaling law of N (m p v = N v).It has been observed that there is an alternative expression for the improvement of seepage velocity in a centrifuge. Schofield,8 Hussaini et al.,9 Goodings,10 & Taylor11 were able to further express how permeability becomes independent of gravity, thus developed through mathematical expressions. Drainage, evaporation and water-uptake are some of the parameters with relationship that determines the rate of water flow through the soil, which plays a significant role.12,13 More so, the relationship of three parameters such as (water, gas and solid) in three phases of the soil are influenced by properties such as texture, structure, biological activity, weather and soil management.14 Relating it in terms of porous media, it can be grouped in volume and function; this has been observed to be of tremendous importance to assimilate the processes associated with water, air and heat transport in soils.15-17 Meanwhile, the volume of soil is influenced by mechanical stresses (e.g. tillage-induced soil compaction, Blackwell et al.;18 Horn et al.;19 Horn et al.;20 Ball et al.;21 McNabb et al.22 and internal forces (e.g. wetting and drying cycles, Peng & Horn19; Bartoli et al.20). The quantity changes and are controlled by such mechanical stability of the soil or through the main in comparison with previous internal stresses. Recurring swelling and shrinkage develop tensile and shear induced crack formation in blocky structure thereafter in a sub-angular blocky structure (Horn & Smucker,14). The influences from soil compaction on soil structures have been investigated by several researchers. Finally it is also observed that soils are able to shrink & swell.14
Governing Equation
(1)
Nomenclature
K = Permeability [LT-1]
Q = Flow rate [LT-1]
ne = Porosity [-]
= Void ratio [-]
T = Time [T]
Z = Depth [L]
= Linear velocity [LT-1]
Let
(2)
(3)
(4)
(5)
(6)
(7)
(8)
(9)
(10)
(11)
(12)
(13)
(14)
(15)
(16)
(17)
(18)
(19)
Auxiliary Equation becomes:
(20)
Applying quadratic expression, it can be express as:
(21)
(22)
(23)
(24)
Assuming this discriminate is complex; therefore, equation (23) and (24) can be expressed as:
(25)
But if T =
and V =
The expressed model can be written as:
(26)
And
(27)
Materials and Method
Standard laboratory experiments where performed to monitor the rate of flow using failing head at different formations. The depositions of the strata were collected in sequences based on the structural deposition at different locations. These samples collected at different points generate at different depths, producing different migration of fluid flow, developing at various levels of flow and at different strata. The experimental results are applied to compare with the theoretical values to determine the validation of the model.
Result and Discussion
Results and discussion are presented in tables including graphical representations of permeability on Tuotorsity flow conditions Tables 1-7. The figures from the graphical representation of permeability and Tuotorsity show the following behaviour of the system. Permeability, as is called is defined as the ability to permeate. It is the measurement shows easily a fluid can flow through a porous medium. Most especially in geotechnical engineering, the porous medium is soils and fluids are definitely the water at ambient temperature. In general conditions, the coarser the soil grains, the larger the voids and larger the permeability. Based on these factors, it is confirmed that gravels are more permeable than silts. Hydraulic conductivity is another term used for permeability especially in environmental engineering literature. In another development on soil structural stratification, it is obvious that when water flows through soils, from upstream to downstream, due to difference in water levels, some energy is lost in overcoming the resistance provided by the soils. This loss of energy, expressed as total head loss is simply the difference in water levels. The pressure is the pore water pressure and therefore pore water pressure at any point in the flow region will definitely influences the behaviour of flow under the geological settings of the soil. The express figures were found to be influenced by these conditions as exponential state of permeability generating Tuotorsity were graphically expressed in such linear direction. The influences from homogeneous setting of structural stratification may have influenced the behaviour of the flow, although it is not always at regular intervals, but the condition of the geological settings from this dimension was found to have been influenced by the system. The simulation values were compared with other experimental results for validation of the model, but parameters from Figure 1-6 expressed in graphical representation show that the maintained exponential state of flow in such linear phase developed lots of homogenous influences within the intercedes of the formation. The expressed alluvium deposition in the deltaic environment may also pressure the behaviour of the flow under the influences of Tuotorsity.
Depth |
Flow Rate [m/s] |
3 |
6.45E-08 |
6 |
1.42E-07 |
9 |
2.22E-07 |
12 |
2.88E-07 |
15 |
3.57E-07 |
18 |
4.33E-07 |
21 |
4.85E-07 |
24 |
5.64E-07 |
27 |
6.37E-07 |
30 |
6.96E-07 |
Table 1 Flow rate at different depths
Depth |
Flow Rate [m/s] |
3 |
6.45E-08 |
6 |
1.42E-07 |
9 |
2.22E-07 |
12 |
2.88E-07 |
15 |
3.57E-07 |
18 |
4.33E-07 |
21 |
4.85E-07 |
24 |
5.64E-07 |
27 |
6.37E-07 |
30 |
6.96E-07 |
Table 2 Flow rate at different depths
Time Per Day |
Flow Rate [m/s] |
10 |
6.45E-08 |
20 |
1.42E-07 |
30 |
2.22E-07 |
40 |
2.88E-07 |
50 |
3.57E-07 |
60 |
4.33E-07 |
70 |
4.85E-07 |
80 |
5.64E-07 |
90 |
6.37E-07 |
100 |
6.96E-07 |
Table 3 Flow rate at different depths
Time Per Day |
Flow Rate [m/s] |
10 |
3.41E-06 |
20 |
8.35E-06 |
30 |
1.29E-05 |
40 |
1.72E-05 |
50 |
2.17E-05 |
60 |
2.34E-05 |
70 |
2.77E-05 |
80 |
3.32E-05 |
90 |
3.79E-05 |
100 |
4.23E-05 |
Table 4 Comparison of theoretical and measured values of flow rate at different Depths
Depth [m] |
Theoretical Values [m/s] |
Measured Values[m/s] |
3 |
6.45E-08 |
6.11E-08 |
6 |
1.42E-07 |
1.35E-07 |
9 |
2.22E-07 |
1.89E-07 |
12 |
2.88E-07 |
2.80E-07 |
15 |
3.57E-07 |
3.33E-07 |
18 |
4.33E-07 |
3.43E-07 |
21 |
4.85E-07 |
4.66E-07 |
24 |
5.64E-07 |
4.54E-07 |
27 |
6.37E-07 |
5.41E-07 |
30 |
6.96E-07 |
6.55E-07 |
Table 5 Comparison of theoretical and measured values of flow rate at different Times
Time Per Day |
Theoretical Values [m/s] |
Measured Values [m/s] |
10 |
6.45E-08 |
6.55E-08 |
20 |
1.42E-07 |
1.35E-07 |
30 |
2.22E-07 |
2.32E-07 |
40 |
2.88E-07 |
2.82E-07 |
50 |
3.57E-07 |
3.52E-07 |
60 |
4.33E-07 |
4.29E-07 |
70 |
4.85E-07 |
4.88E-07 |
80 |
5.64E-07 |
5.61E-07 |
90 |
6.37E-07 |
6.41E-07 |
100 |
6.96E-07 |
7.11E-07 |
Table 6 Comparison of theoretical and measured values of Flow rate at different Times
Time Per Day |
Theoretical Values [m/s] |
Measured Values [m/s] |
10 |
3.41E-06 |
4.08E-06 |
20 |
8.35E-06 |
7.75E-06 |
30 |
1.29E-05 |
1.21E-05 |
40 |
1.72E-05 |
1.67E-05 |
50 |
2.17E-05 |
1.87E-05 |
60 |
2.34E-05 |
2.33E-05 |
70 |
2.77E-05 |
2.84E-05 |
80 |
3.32E-05 |
3.38E-05 |
90 |
3.79E-05 |
3.64E-05 |
100 |
4.23E-05 |
3.99E-05 |
Table 7 Comparison of theoretical and measured values of Flow rate at different Times
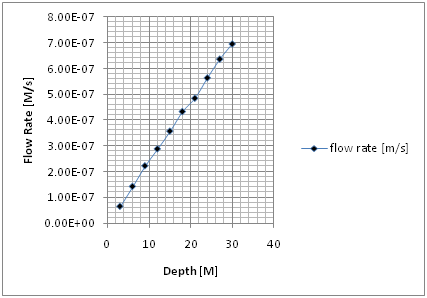
Figure 1 Flow rate at different depths.
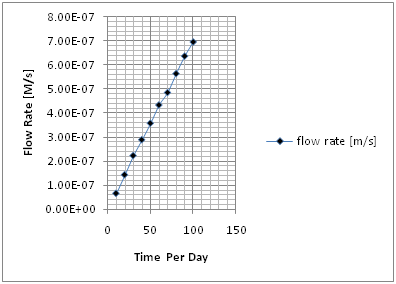
Figure 2 Flow rate at different at different Times.
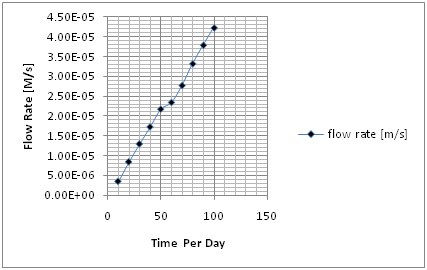
Figure 3 Flow Rate at different Times.
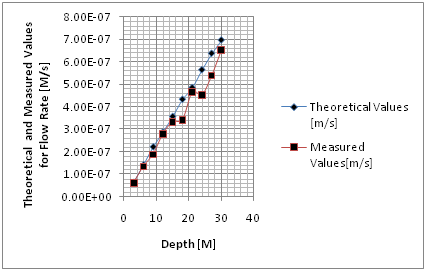
Figure 4 Comparison Theoretical and Measured values at different depths.
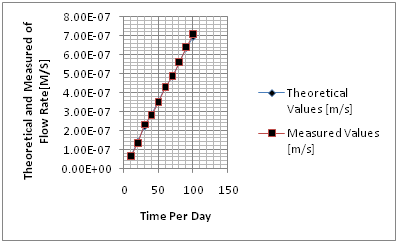
Figure 5 Comparison Theoretical and Measured values at different depths.
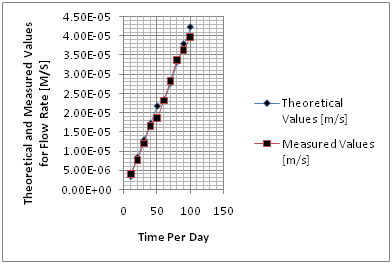
Figure 6 Comparisons of Theoretical and Measured Values at different depths.
Conclusion
The study has expressed the behaviour of permeability in the soil over the Tuotorsity flow condition in deltaic formation. The rate of strata permeation are structured through the geological settings in the study location. The expression from the formation has been able to express its pressure on the Tuotorsity flow condition in the study location. The simulation was able to establish the depositional level of the fluid within the intercedes of the strata. Graphical representations of the flow conditions show linear phase in the strata. The study has determined the rate of flow in the formation. The rate of flow was found to be in average condition. It implies that the structure of the formation deposition reflected on the pressure of flow in the strata. The developed model simulation results generated theoretical values that were compared with other experimental results. Both parameters developed a best fit. The values from the simulation implies that the flow yield rate may not occur as shallow depth yield experienced are very low. The formation may be predominant silty formation, and such stratum may develop permeable conditions of an average flow within the intercedes of the formation. The study is imperative because experts will apply the model and simulation values to monitor the rate of permeability and Tuotorsity flow conditions in the study location.
Acknowledgements
Conflict of interest
The author declares no conflict of interest.
References
- Goodings DJ. Centrifuge modeling of slope failures. Thesis presented to University of Cambridge, at Cambridge, England, in partial fulfillment of the requirements for the degree of Doctor of Philosophy. 1979.
- Butterfield R. Scale–modeling of fluid flow in geotechnical centrifuges. Soils and Foundations. 2000;40(6):39–45.
- Mcnabb DHAD, Startsev, Nguyen H. Soil wetness and traffic effect levels on bulk density and air– field porosity of compacted boreal forest soils. Soil Sci Soc Am J. 2001;65(4):1238–1247.
- Pokrovsky GI, Fyodorov IS. Centrifuge Modelling in the Construction Industry. 1, in Translation Building Research Establishment. UK; 1968.
- Cargill KW, Ko HY. Centrifuge modelling of transient water flow. Journal of Geotechnical Engineering. 1983;120(2):366–387.
- Tan CS, Scott RF. Centrifuge scaling considerations for fluid–particle systems. Geotechnique. 1985;35(4):461–470.
- Jun–zhen DI, Zhi–xiang YIN. Coupling Model of Contaminant Transport of Landfill Soil College of Civil Architecture Engineering. China: Liaoning Technical University.
- Schofield AN. Cambridge Geotechnical Centrifuge Operations. Geotechnique. 1980;30(3):227–268.
- Dorota D, José D, O Becker F, et al. Effect of bulk density on hydraulic properties of homogenized and structured soils. J Soil Sc Plant Nutr. 2008;8(1):1–13.
- Goodings DJ. Relationships for modeling water effects in geotechnical models. USA: Proceedings Application of Centrifuge Modelling to Geotechnical Design University of Manchester; 1984. p. 1–23.
- Taylor RN. Discussion on Tan & Scoot. Geotechnique. 1987;37(1):131–133.
- Horn RH, Domzal A, Sowi skajurkiewicz, et al. Soil compaction processes and their effects on the structure of arable soils and the environment. Soil & Till res. 1995;35:23–36.
- Kutilek M, Nielsen DR. Soil hydrology. Germany: Catena Verlag; 1994.
- Horn R, Smucker A. Structure formation and its consequences for gas and water transport in unsaturated arable and forest soils. Soil & Till Res. 2005;82(1):5–14.
- Dörner JJ, Horn R. Anisotropy of pore functions in structured Stannic Luvisols in the BWeichselien moraine region in N Germany. J Plant Nutr Soil Sci. 2006;169(2):213–220.
- Blackwell PS, Graham JP, Armstrong, et al. Compaction of a silt loam soil by wheeled agricultural vehicles i effect upon soil conditions. Soil tillage res. 1986;7:97–116.
- Ball BC, Campbell DJ, Douglas JT, et al. Soil structural quality, compaction and land management. Eur J of Soil Sci. 1997;48(4):593–601.
- Oschner TE, Horton R, Ren T. A new perspective on soil thermal properties. Soil Sci Soc Amer J. 2001;65(6):1641–1647.
- Peng X, Horn R. Anisotropic shrinkage and swelling of some organic and inorganic soils. Eur J Soil Sci. 2007;58(1):98–107.
- Bartoli FJC, begin G, Burtin Schouller E. Shrinkage of initially very wet soil block, cores and cods from a range of european and osol horizons. Eur J of Soil Sci. 2007;58:378–392.
- Hillel D. Environmental Soil Physics. London: Academic Press; 1998. 771 p.
- Eluozo SN. Mathematical model to monitor seepage and discharge velocity influenced by volume of void in coastal area of port Harcourt. Open Journal of Water Resources and Environmental Engineering. 2013;1(1):10–18.

©2017 Eluozo, et al. This is an open access article distributed under the terms of the,
which
permits unrestricted use, distribution, and build upon your work non-commercially.


