MOJ
eISSN: 2572-8520


Research Article Volume 5 Issue 4
Adjunct Researcher, Polytechnic School, University of São Paulo, Brazil
Correspondence: Vanessa Meloni Massara, Adjunct Researcher, Polytechnic School, University of São Paulo, Brazil
Received: December 10, 2019 | Published: December 30, 2019
Citation: Massara VM. An overview about Brazilian railway system – Part II: 1930-actual. MOJ Civil Eng. 2019;5(4):97-100. DOI: 10.15406/mojce.2019.05.00161
Background: This article is a continuation of the Brazilian rail profile (An overview about Brazilian railway system – Part I: 1835-1930) from its inception in 1835 to the present day, considering the importance of this mode to travel long distances and transport large loads. It is noteworthy that in the Brazilian case the large territorial dimension is a barrier to the expansion of the rail network, but that after the privatization process, this infrastructure has been receiving investments that have gradually changed this scenario.
Keywords: railway, infrastructure, Brazil, urban development, privatization
In 1990 a law was created that established the “National Privatization Program”, being the Federal Railway Network (RFFSA) included in the Program in 1992. RFFSA's privatization process was based on Law 8987/95, which established the rights and obligations of the parties involved in the concession process, also defining the principle of economic and financial stability and the rights of users. In 1999, the Federal Government, under resolution number 12, created the “National Privatization Council” and, through Decree 3277, extinguishes the RFFSA. After privatization, the performance of privately managed railways improved significantly. The railway in the country totals 30,485 km, of which 29,074 km are concessions to the private sector. The Brazilian rail system is the largest in Latin America in terms of transported cargo, but, in terms of mesh, occupies the second place, losing to Argentina.1
The article is developed based on the bibliographic survey in transport yearbooks with varied spatial limitation, given the interest in the historical character of this expansion and continuing the article of the same title, which presented the evolution of the Brazilian rail network until 1930, addressing the first three phases of expansion:
Phase I (1835-1873)
Phase II (1873-1889)
Phase III (1889-1930)
Now the following periods will be dealt with:
Phase IV (1930-1960)
Phase V (1960–1990)
Phase VI (1990-2001)
Phase VII (2001-actual)
Again, the spatial delimitation is Brazil and Its States, as shown in Figure 1, allowing an analogy with the following figures that show the expansion of the country's railways in different periods. The delimitation of the study is, in this first part, is the period between 1930 and 2016 (Figure 1).

Figure 1 The Brazilian states.2
Phase IV (1930 - 1960)
Vargas government in the late of 1930’s, began the reorganization of railways and investment promotion, by the expropriation national and foreign companies that were in a bad financial situation process. Important facts of this period:

Figure 2 shows railway in 1930 and 1954.3
Note that the two periods are quite similar. The railway was concentrated in the southeast region in the states of São Paulo, Rio de Janeiro and Minas Gerais, with expansion in the states of Santa Catarina and Rio Grande do Sul , south including the state of Paraná and in the northeast in the states of Bahia, Pernambuco and Sergipe. There was a minimum extension in the northern region in the states of Pará and Amazonas.
Phase V (1960 - 1990)
In 1971, the Government of the State of São Paulo (the most important city in the country) decided to unify into a single company, the five railways of its property: “Paulista Company of Railways”, “Railway Sorocabana”, “Railway Araraquara”, “Company Mogiana of Railway” and” Railway São Paulo-Minas Gerais”. Thus, due to this junction, was created the “Ferrovia Paulista SA – FEPASA”, to manage approximately 5,000 km of railways.
From 1980 to 1992, rail systems belonging to the “Federal Railway SA- RFFSA” and “Ferrovia Paulista SA- FEPASA”, were dramatically affected when investments have declined substantially, also reaching RFFSA in 1989. In 1984, RFFSA could not manage enough resources to cover the contracted services debt. The company supported serious technical and operational imbalance.
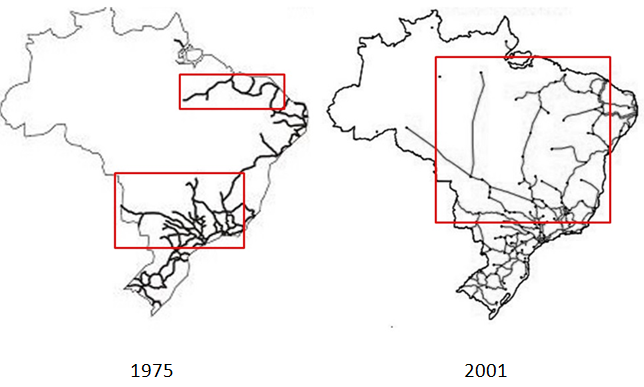
Measures of institutional adjustment were made by the Federal Government, with the removal of RFFSA of the administration of urban transport. The Decree of February 1984, constituted the “Brazilian Company of Urban Transport – CTBU” which was responsible for the provision of those services. Figure 5 shows railway in 1975.
In this figure it is possible to verify that the rail network is still concentrated in the south and southeast, mainly in the state of São Paulo.
There is an attempt to expand in order to link the south-east and west-central regions of Brazil. However, due to the great territorial extension, there are still major links between regions, mainly in the north and central-west, making transportation of agricultural and livestock production difficult, specially to the large consumer centers of the southeast (with emphasis on the state of São Paulo).
Phase VI (1990 – 1997 – 2001)
In this first phase of the post privatization, there was an effort in trying to connect the southeast to the rest of the country, extending the railways to the north and center-west and creating ramifications in the northeast. Although not yet sufficient for the transport optimization in the country (whether cargo or people), this phase can be summarized as an advance in the intention to remove the gaps between regions and in the greater understanding of the country's territorial and economic development needs as a whole (Figure 3 & Table 1).

Figure 3 Railway in 1975 and 2001.1
Performance indicators |
1997 |
2001 |
Transported volume Carga (billon TKU) |
138 |
162 |
Average distance (km) |
518 |
531 |
Commercial average speed (km/h) |
21 |
22 |
Passenger transport (106 passanger/km) |
14,000 |
16,500 |
Table 1 Shows the benefits obtained in the first phase of privatization of the Brazilian railways4
With the auction of “Paulista Network” (formerly FEPASA to RFFSA incorporated by Decree number 2502, 1998), the process of privatization of RFFSA was completed.
Phase VII (2001 until now)
Data from the National Confederation of Transport indicate that 61.1% of all cargo transported in Brazil used the modal road system; 21.0% went through railroads, 14% through waterways and port terminals, and only 0.4% by air. The state of São Paulo is the only one that presents complete interaction between modal.
Although there is still expansion for the railroad expansion, it should be emphasized that this type of transportation meets a very important demand in the Brazilian economy: the commodities outflow. Good examples are the transport of iron ore and grains from agribusiness, including the North-South Railroad, which links Anápolis (GO) to the Port of Itaqui in São Luís (MA), transporting soy, and the Railroad Carajás, which connects the Serra dos Carajás to the Ponta da Madeira Terminal, also in São Luís, and the Vitória-Minas Railroad, which links Minas Gerais to the Port of “Tubarão” (ES), transporting ores.
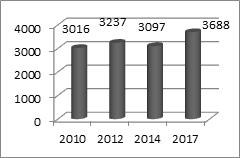
The post-privatization period covered shows the largest investment in the rail network made since the 1970s. In 04 years, there has been reasonable progress reaching in 2001 162 billion TKU transported the largest rail system in Latin America in terms of freight carried. But, much must be done mainly due to the lack of ramifications for intermodal connection. The actual panorama of privatization is summarized in Figure 5. Through this brief analysis it is clear that the density of the rail network is still far below what is needed compared to other countries with large territorial dimension. The Graph in Figure 5 exemplifies the evolution of the number of active cargo locomotives in the period 2010-2017.

Figure 5 Evolution in the number of freight locomotives from 2010–2017.5
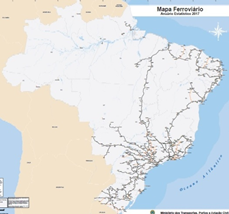
The Map of Figure 6 shows the rail network in 2017 (in black), the orange lines correspond to the disabled network.

Figure 6 The national railway network.6
The graph in Figure 7(A) shows the division between railway transported inputs, totaling 538.8 million tons in 2017 and highlighting in Figure 7(B) the evolution of iron ore transportation.

Figure 7 (A) Percentage by input type.
(B) Highlights the evolution of iron ore transportation (million tons).6
It is well known that the expansion of the railway infrastructure encounters obstacles such as: need for undercarriage acquisition; domain intrusions; critical level crossings; winding or mountainous layout of railway sections; rail share between freight trains and passenger trains; existence of different gauges in the mesh. Through this brief analysis it is clear that the density of the rail network is still far below what is needed compared to other countries with large territorial dimension. A feature of rail transportation in Brazil is that the compositions leave their origin in the direction of the ports, usually loaded with export cargo, with more than 90% of the weight referring to that route. However, they return with little or no charge. That is, low return load utilization, which makes operation more expensive, but privatization is over the years, managing to meet the demand for investments and consequently making the railways a model of importance.
None.
The author declares that there are no conflicts of interest.
None.

©2019 Massara. This is an open access article distributed under the terms of the, which permits unrestricted use, distribution, and build upon your work non-commercially.