MOJ
eISSN: 2572-8520


Research Article Volume 3 Issue 1
Reliability Laboratory of Materials and Structures (FIMAS), Tahri Mohamed University, Algeria
Correspondence: Chikhi Abderrahmen, Reliability Laboratory of Materials and Structures (FIMAS), Tahri Mohamed University, Algeria
Received: May 26, 2017 | Published: July 5, 2017
Citation: Abderrahmen C, Mohamed D (2017) Dynamic Buckling of Cylindrical Storage Tanks during Earthquake Excitations. MOJ Civil Eng. 2017;3(1):227-232. DOI: 10.15406/mojce.2017.03.00058
The behavior of storage tanks' analysis in seismic areas is of major importance because of the strategic nature of these works. The steel cylindrical tanks are the most susceptible to damage due to dynamic buckling during earthquakes. In this study, three criteria are used to estimate the critical peak ground acceleration caused the tank instability. The liquid inside the tank was modeled using specific Ansys's finite elements and fluid-structure interaction. The calculation includes modal and time history analysis, including material and geometric non-linearity. The result values are compared with standard code previsions as well as the results of previous numerical research, and show the need to improve code provisions.
Keywords: dynamic buckling, tanks, earthquakes, finite element, fluid-structure interaction, instability criteria
Cylindrical tank is one of the strategic structures in the daily human life. These facilities are used to store petroleum products, water, oil and chemicals, etc. According to various reports and observations on the structural behavior of the reservoirs during the recent earthquakes, steel tanks are more susceptible to damage than others. Among those reports which cited1 damage of petroleum steel tanks due to the earthquakes of 1933 Long Beach, 1952 Kern County, 1964 Alaska, 1964 Niigata, 1966 Parkfield, 1971 San Fernando, 1978 Miyagi prefecture, 1979 Imperial County, 1983 Coalinga, 1994 Northridge, and 1999 Kocaeli earthquakes,2 Shibata,3 Kono,4 Manos & Clough,5,6 Boumerdès & Sezen.7 Evidence of damage to silos Korso during Boumerdès earthquake7 not provided in seismic zone. Types of failure reported for these structures: diamond or elephant’s foot buckling, uplift of their bases, pipe damage, etc. Among these negative phenomena, dynamic buckling of tank walls remains the most common and more dangerous one.1
The Elephant Foot buckling (EFB)-which is an outward bulge located just above the tank base – results from the combined action of vertical compressive stress, exceeding the critical stress, and hoop tension close to the yield limit.8 The elephant foot buckling bulge usually extends completely around the bottom of tanks due to the reverse in the direction of the seismic excitation.8 The diamond buckling is an elastic instability phenomenon due to the presence of high axial compressive stresses.8–14 The first numerical research estimated the critical PGA that causes the dynamic buckling is due to Virella et al.15 Using the technique of the added mass modeled by ABAQUS code, they examined the PGA which induces the buckling of a set of anchored cylindrical tanks. Followed by Djermane et al.8 presented the contribution to evaluate the PGA values and compared with standard code previsions by using a numerical model. This finite element developed locally is exposed.8 More recently, Sukhvarsh & Mark14 have presented stability static and dynamic analysis of cylindrical tanks. The fluid – structure interaction (FSI) is modeled in ANSYS finite element code. Unlike the most research papers cited above this work uses three different stability criteria to estimate the critical PGA.
Numerical model
In this work, the tank used has been treated by several authors.8,15 The tall tank has a height to a radius ratio (H/R) of 2. In the three-dimensional tank, most developed models use shell element for the wall, the roof and the tank bottom, beam elements for the roof rafters, and fluid element for liquid containing cylindrical tank. As mentioned earlier, the model of the fluid and the shell structure was done using ANSYS software. In the numerical analysis, we used two shell elements for tank structure, the SHELL63 element used for modal analysis and the SHELL181 for time history analysis. This last element is suited for non-linear application. The liquids inside this structure are modeled by FLUID80 element. The roof rafters are modeled by BEAM4 element. Material properties of the studied tank are presented in Table 1, Figure 1 shows the different shell thickness of the tank model.
Water |
|
Density |
1000 kg/m3 |
Bulkmodulus |
2.0684e9 Pascal |
Viscosity |
1.13e-3 N.S/m2 |
Steel |
|
Density |
7850 kg/m3 |
Poisson ratio |
0.3 |
Elasticity modulus |
20.67e10 Pascal |
Yield stress |
2.5e8 Pascal |
Tangent modulus |
1.45e9 Pascal |
Table 1 Material properties
Fluid-structure interaction
The fluid-tank interface is modeled by coupling equation; the coincident nodes at the common areas between the fluid element and the shell elements are attached in the normal direction (Figure 2).2
Boundary conditions
The tank studied in this work is assumed to have a completely fixed-base (all the nodes at the base are assumed to be fixed).
Modal analysis
Modal analysis is used to determine vibration characteristics of this model. The important parameters in the design of a structure for dynamic loading conditions are the natural frequencies and mode shapes.2 The equation of free vibrations for undamped system is given by:
(1)
where, [M] = structural mass matrix, [K]= structural stiffness matrix, {u ̈ } nodal acceleration vector, and {u}= nodal displacement vector. For a linear system, free vibration will be expressed as:
(2)
where, eigenvector representing the mode shape of the with natural frequency, = ith natural circular frequency in radians per unit time, t = time in seconds. Substitution of Eq. (2) in Eq. (1) gives:
(3)
Nonlinear time history analysis
According to various reports,1,9 the damage in the thin tank walls in seismic areas shows almost all large displacements and relatively large deformations. For these raisons, the material and geometric non-linearities are considered in this work. The elasto-plastic stress-strain curve is used for steel. The software offers several options, among which we have chosen the simplest consisting of a bilinear kinematic hardening curve, taking into account the Beauschinger effect. To obtain a satisfactory solution, the loads are applied incrementally at each time step through a series of smaller sub-step.10
The transient dynamic analysis solves the basic equation of motion:
where: [C] = damping matrix, = nodal velocity vector and = load vector.
The earthquake records selection
The present study has used earthquake records of El-Centro and San Fernando with maximum acceleration of 0.349 g and 1.2 g respectively. A record is considered interesting in the sense of this study if the maximum amplitudes are recorded during the first seconds which could also contain the essential of the frequency content. This is the case with the El Centro 1940 earthquake. The selection of the San Fernando 1970 earthquake is due essentially to its hard PGA which caused massive damages to storage structures (Figure 3).8,17
Total energy-phase plane criterion (Hoff & Bruce, 1954)
The curve representing the movement is traced in a phase plane (U;U ̇) as shown in Figure 4. The stable movements are characterized by limited trajectories and do not move too much away from the solution of the static equilibrium which plays the role of a center of attraction. When the load reaches the critical value, the trajectory moves away from this pole without any oscillation around it.6
Equation of motion criterion (Budiansky & Roth4)
The first and most used criterion of stability is due to Budiansky & Ruth.4 It was formulated as an engineering application of the Liapunov stability criteria. In this criterion, the time displacement curve is plotted for several values of the PGA. The PGA value corresponding to a curve which gives a ‘‘jump’’ relatively to its neighboring curves indicates the dynamic buckling critical value(PGA) cr Figure 5A.
Criteria of Ari Gur & Simonetta3
This curve has been proposed originally by Budiansky & Ruth4 and generalized later by Ari-Gur & Simonetta.3 In the case of seismic excitation, this strong increase is less pronounced, and is rather replaced by a change of the slope of the pseudo-dynamic curve relating the PGA intensity and the maximum radial displacement at a fixed monitored node (several nodes are considered especially in the potential buckling zones) as shown in Figure 5B. This criterion offers an estimation which must be confirmed with the above criteria.6 The most commonly used stability criteria such as that of Budiansky-Ruth, the phase plane and energy witch ‘‘watch’’ the dynamic bifurcation are very time consuming CPU.8
Based on simplified analogical models and on experimental research, different simplified design standards for anchored and unanchored tanks have been developed.8 The normal design procedure in North America for water structures is based on the specifications provided by the American Water Work Association (AWWA-D100)1 and for other fluids on the American Petroleum Industry (API) Standard 650.16 More recently, the European code EC 8-Part 49 has provided enhanced analysis methods for anchored and unanchored tanks design. Two different strategies have been used in the code practice: The simple stress limitation method adopted in many standards especially in American standards (AWWA100,1 API65016), the semi-empirical method of Rotter18 adopted by the New Zealand seismic Tank design recommendation, the European Standards ENV1998-4,9 etc.
To ensure the validity of the used model, modal analysis for the tank with FSI system was performed. The results were compared with previous research and standard code provisions. The results are summarized in the Table 3.The excellent agreements indicate the validity of the used model.
N° mode |
Frequency |
Period |
Cumulative Mass Fraction |
||
convective |
1st |
2 |
0.168578 |
5.932 |
0.26671 |
2nd |
6 |
0.264308 |
3.7835 |
0.273556 |
|
3th |
13 |
0.302594 |
3.3048 |
0.274772 |
|
4th |
22 |
0.321403 |
3.1114 |
0.275144 |
|
Impulsive |
1st |
281 |
3.16079 |
0.31638 |
0.969402 |
2nd |
340 |
6.95603 |
0.14376 |
0.970209 |
|
3rd |
341 |
6.97019 |
0.14347 |
0.999052 |
|
4th |
444 |
45.0829 |
0.0222 |
0.999978 |
|
Table 2 The significant convective and impulsive modes.
Ansys |
Virella et al. [15] |
Eurocode 8 |
API 650 |
Ratio |
n Mode |
Type |
|
Timp (sec) |
0.316 |
0.3 |
0,299 |
/ |
0.944 |
281 |
column |
Tcon (sec) |
5. 932 |
/ |
5.778 |
5.696 |
0.96 |
2 |
/ |
Table 3 Modal Period Comparison.9,15-16
Participation factor
Selection of significant modes is based on the criterion of effective mass participation; Figure 6 represents the actual participation factor and the number of mode. We can see that natural impulsive frequencies are greater than natural convective frequencies. Table 3 compares the obtained results versus those given by the EC8, API 650 standard and the attached masses model. This table indicates that estimated values for structural periods of vibration are reasonable. The obtained fundamental impulsive mode is a column mode type as shown in Figure 7B.
Elcentro earthquake
Figure 8 shows the pseudo equilibrium path for El Centro excitation. The discontinuity on the curve indicates that the PGA critical value (PGAcr) occurs at 0.384g. Figure 9 shows several history curves corresponding to different excitation levels. The reversal nature of earthquake excitation caused a hard difficulty to determine (PGA)cr with Budiansky-Ruth criterion type, this is clearly showed in Figure 9.8 At level 0.384, a disproportionate increase in displacements is distinguished.
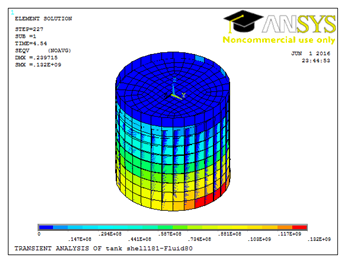
This increase does not correspond to a monotonic jump for the above-mentioned reasons. The phase planes' criterion illustrated in Figure 10 shows more easily in this case the instability near the (PGA) cr. The difficulty for using this criterion is, in some cases, the same as that reported for Budiansky and Ruth one, but the use of the two criteria simultaneously can be more illustrative. The nature of the obtained dynamic buckling response can be evaluated by studying the deformation and the iso-stresses around the excitation critical level see Figure 11.
San Fernando earthquake
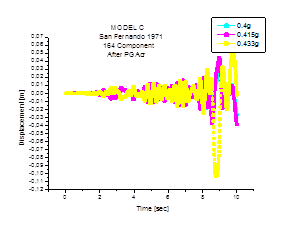
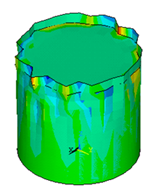
Figure 11 gives the PGAcr for San Fernando excitation. Using an estimation given by the pseudo dynamic path, the Budiansky–Ruth and phase plane criteria are then used to confirm the obtained value Figures 12 & 13. The dynamic buckling obtained is of the elastic type, the folds are concentrated on the upper part of the tank see Figure 14.


Figure 12 Time History curves before and after PGAcr for the tank Model A under San fernando earthquake.

Figure 14 Von miss stress for the studied tank at time= 4.54 seconds under El Centro earthquake at PGA = 0.384g under PGAcr.
This type of buckling has been obtained by several authors Natsiavas & Babcock13 and also by Virella et al.15 Natsiavas and Babcock13 studied and characterized this type of buckling. They showed, in particular, that the dynamic pressure in the fluid exerts a negative pressure on the zone of the wall located near the fluid free surface, where the hydrostatic pressure and the wall thickness are of weak values. The resulting negative pressure (hydrostatic pressure- impulsive pressure) can cause sufficiently large compressive stresses to generate localized elastic buckling (depression buckling).
Table 4 shows the critical values under El Centro and San Fernando earthquakes at PGA of 0.384g, and 0.416g respectively. Through the obtained results see Tables 4 for the dynamic buckling of the tank under two seismic excitations, one can conclude the following points:
El Centro Earthquake at PGA=0.384g |
San fernando Earthquake at PGA=0.416g |
|||||||
Displacement of tank wall (cm) |
(MPa) |
(MPa) |
Hydrodynamic pressure (MPa) |
free surface displacement (cm) |
Displacement of tank wall (cm) |
(MPa) |
(MPa) |
Hydrodynamic pressure (MPa) |
2.483 |
139 |
84.15 |
23.14 |
38.14 |
5.043 |
91.2 |
81.5 |
28.7 |
Table 4 The critical values of the radial displacement, stresses, hydrodynamic pressure and maximum water displacement under El Centro and San fernando earthquakes

Figure 15 Maximum water vertical. Displacement at time= 8.64 seconds under El Centro earthquake at PGA = 0.384g.

Figure 16 Dynamic buckling obtained in the upper. zone of the tank wall under San fernando earthquake at PGA = 0.466g after PGAcr.
Spectrum Analysis of Used Model |
Eurocode 8 |
API 650/AWWA |
27.52 |
27.43 |
26.86 |
Table 5 The maximum free surface displacement comparison
Earthquake |
Numerical Model |
By Codes |
|||
AWWA |
Difference |
EC8 |
Difference |
||
El Centro |
0.384g |
0.399g |
3.76% |
0.387g |
0.77% |
San Fernando |
0.400g |
0.443g |
9.70% |
0.430g |
6.97% |
Table 6 Comparison of (PGA) cr values for the Tall tank
In this work, our investigation was focused on the search for the value of critical PGA that can lead to instability of the tank. We used a finite-element model considering the fluid-structure interaction, to have reliable results. We have used three different instability criteria. The results obtained by modal analysis confirm the validity of our model. The results of the instability study were compared to the values given by the international codes. The maximum free surface displacements obtained for spectrum analysis of the used model versus those given by standards codes are quite similar. The results of the instability study were compared to the values given by the international codes. It is clear from this comparison that the code results are not conservative.
None.
The author declares no conflict of interest.

©2017 Abderrahmen, et al. This is an open access article distributed under the terms of the, which permits unrestricted use, distribution, and build upon your work non-commercially.