Journal of
eISSN: 2574-8114


Research Article Volume 5 Issue 4
1Department of Textile Engineering, City University, Bangladesh
2Department of Jute and Fibre Technology, University of Calcutta, India
Correspondence: Md. Anowar Hossain, Department of Textile Engineering, City University, Savar, Dhaka, Bangladesh, Tel 8801732681104
Received: July 07, 2019 | Published: July 30, 2019
Citation: Hossain A, Samanta AK. Uster analysis of cotton/polyester blended spun yarns with different counts. J Textile Eng Fashion Technol. 2019;5(4):213-218. DOI: 10.15406/jteft.2019.05.00204
Uster testing of yarn to measure the irregularity before knitting and weaving may reduce the faulty fabric production, faulty dyeing which may minimize the production hassle in different stages as well as customer rejection of end product. Unevenness, coefficient of variation of mass and hairiness of spun yarn are the major indicator of yarn quality measurement for the textile technologist in ring spinning industries and such types of yarn qualities can be confirmed by uster tester. Decision making of yarn count versus yarn quality is a confused matter by production concern in ring spinning. 40Ne, 50Ne and 60Ne ring spun Yarn of 35% cotton and 65% polyester blended yarn produced from same fibre and sliver blending process where the different counts of yarns were tested with Uster tester to find the variation of three types of yarn considering the major parameters of yarn qualities like unevenness, coefficient of variation of mass and hairiness of spun yarn. As per uster analysis of ring spun yarn the unevenness% and coefficient of variation of mass% were gradually incraesed when fineness of yarn was increased like unevenness of 40Ne<unevenness of 50Ne<unevenness of 60Ne and coefficient of variation of mass 40Ne<coefficient of variation of mass 50Ne<coefficient of variation of mass 60Ne. Hairiness of yarn was decreased when the fineness of yarn was increased in a sequence of hairiness of 40Ne>hairiness of 50Ne>hairiness of 60Ne.
Keywords: cotton/polyester blended yarn, uster tester, ring spun yarn, unevenness, coefficient of variation of mass, hairiness
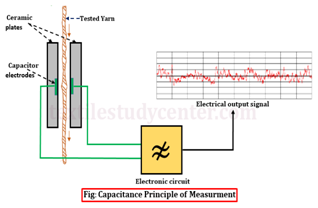
Textile engineers in ring spinning1 industries are fully dependent on uster yarn evenness tester2 to decide yarn qualities as per customer expectations of unevenness, coefficient of variation of mass and hairiness of spun yarn. The Uster yarn evenness tester is the instrument developed by Switzerland Uster Company, and it is used to test the evenness of yarns. This evenness tester uses the capacitance conversion principle3 to translate the non-electric yarn section change into the electric singles representing the change of section. The testing part is composed by the capacitors with two parallel metal plates. Because the dielectric coefficient of the fiber materials exceeds the dielectric coefficient of air, when the sample of yarn enters into the capacitor with certain speed, the capacitance of the polar plate will increase, and the change of the capacitance is related with the actual volume of the yarns in the polar plates (Figure 1).4

Figure 1 Capacitance principle of uster tester.3
The weight of the sliver, roving, and yarn, particularly the weight of the draw-frame sliver, is affected by the temperature and relative humidity of the spinning room. Various tests have been made to determine the degree of the effect, but the results have been inconclusive.5 Mohammad Hatamvand, Seyed Abbas Mirjalili, Saeid Fattahi, Tariq Bashir, Mikael Skrifvars used an experimental design to investigate the influence of the total draft, break draft, distance between the aprons (Clips) and production roller pressure on yarn quality in order to obtain optimum drafting conditions for polyester and viscose (PES/CV) blend yarns in ring spinning frame. Experimental results and statistical analysis show that the best yarn quality will be obtained under drafting conditions total draft of 38, 1.2 break draft, 2.8 mm distance between of aprons and maximum pressure of the production top roller (18daN).6
A statistical model is developed for predicting the likely end breakage rate in ring spinning. The important factors in governing end breaks are the mean yarn strength, yarn strength variation, mean value of the peak spinning tensions and the variation of yarn mass irregularity.7
The production of a textile yarn involves the drawing out of a thick intermediate web of fibres (sliver) by a process known as drafting which influences the quality of yarn.8 Neha Gupta studied that actually defects rate causes a direct effect on the profit margin of the product and decrease the quality cost during the manufacturing of product.9 Yarn structure and its relationship with the properties have attracted many researchers and scientists. Yarn can be defined as a product of substantial length and relatively small cross-section consisting of fibres and/or filaments with or without twist1. It forms an important immediate stage in many methods of textile production.10
A Ring Spinning machine, spindle, ring and traveller are arranged to impart twist to the yarn, and enables winding of the produced yarn on the cop. Prime problem of ring-traveller combination of a ring spinning machine and for this reason twist insertion rate is low compare to modern spinning machines. Below Figure 2 shows the ring and traveller of the ring spinning machine. Traveller is very small compared to ring. Both of the ring and traveller are made from steel, which are specially treated in different ways for high speed running.11
Karthik & R Murugana reported that Cotton/milkweed (60/40) blended yarn of 29.5 tex has been produced on a ring spinning system and observed that a higher fibre friction gives higher yarn tenacity and lower yarn unevenness, imperfection and hairiness.12 Ismail Dogu was studied that twisted fiber assembly influenced. drafting force and strength of a low-twist staple-fiber yarn.13
Theoretical concept of yarn irregularity: The spinning of even yarns from staple fibres is dependent on certain technical limits. The fundamental requirements for an optimum mass distribution would be the same number of fibres each having the same fineness in each having the same fineness in each section of the yarn. No present existing spinning system is in a position to produce a yarn always having the same number of fibres in the cross section. The theoretical limit of irregularity is if referred to as the limiting irregularity and can be calculated.
(1)
Where, = Limiting irregularity
n= Number of fibres in the cross section of the fibre assembly
T= Count of yarn in Tex
= Fibre fineness in Tex
The index of irregularity I am characteristics without a unit which gives an indication of the degree to which the mass variations of a fibre assemble deviate from the ideal fibre distribution. In order to able to calculate the limiting irregularity of yarns spun from fibres with a high variation in fibre fineness the formula used:
= Coefficient of variation of fibre diameter in %
Percentage of mean deviation (PMD) or unevenness (U %)
The average value for all the deviations from the mean which is expressed as a percentage of the overall mean is called percentage of Mean Deviation (PMD). This is termed U% by the Uster Company.
Coefficient of mass variation (CV %)
The coefficient of mass variation CV % is the ratio of standard deviation of mass variation divided by average mass variation. The higher the CV value is the more irregular the yarn (Figure 3).

Figure 3 Graphical experimentation of mass variation.15
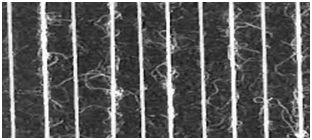
Uster hairiness index: The hairiness index H corresponds to the total length of protruding fibres within the measurement field of 1cm length of the yarn (Figure 4).

Figure 4 Yarn hairiness.16
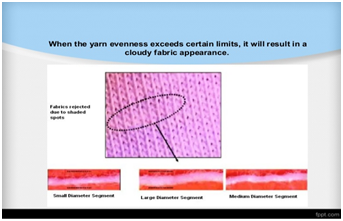
Effect of yarn unevenness, coefficient of variation and hairiness on fabric: The yarn unevenness, coefficient of variation and hairiness may create different problem on fabric surface under consideration of major fabric properties such as fabric appearance, clear structure, good luster on fabric surface, hand feel of fabric, water absorption, abrasion resistance, fabric strength, pilling tendency and as well as other effects on dyed and printed fabric surface (Figure 5).

Figure 5 Effect of yarn unevenness on fabric structure.14
Materials used
Length : 24.25mm
Fineness : 2.2dtex
Tensile strength : 3.2g/dtex
Color : Gray
Elasticity : Relatively low
Moisture Regain : 7.3%
Origin : India
Brand : Meije
Fineness : 3.5dtex
Color : Raw white
Grade : Recycled
Fiber length : 25mm
Origin : Indonesia
Machine used during production of blended spun yarn:
Department |
RH% |
Temperature (˚C) |
Blow room |
50 (Cotton) |
35 (Cotton) |
55(Polyester) |
29 (Polyester) |
|
Carding |
55 (Cotton), |
43 (Cotton) |
58(Polyester) |
37 (Polyester) |
|
Draw frame |
56 |
35 |
Simplex |
57 |
36 |
Ring frame |
50 |
35 |
Winding |
62 |
33 |
Table 1 RH% and temperature observed during production
Where, C is the capacity
= Dielectric relative constant (1 for vacuum)
S = Plates area (m2)
d = Distance between plate.
Equation shown that if the dielectric constant is changed, the capacity also change when the yarn is inserted between the plates.
Testing standard: ISO 2649, DIN 53 817
Testing machine:
|
Machine Name |
USTER® TESTER 5 |
|
Company Name |
USTER TECHNOLOGY AG |
|
Origin |
Switzerland |
|
Model |
S-400 |
Standard production parameters from blow room lap to finished yarn production were maintained during the whole spinning process of 40Ne, 50Ne and 60Ne ring spun yarn of 35% cotton and 65% polyester blended yarn produced from same quality cotton and polyester fibre and sliver blending process was continued in draw frame stage of spinning. 40Ne, 50Ne and 60Ne ring spun yarn of 35% cotton and 65% polyester blended yarn were tested with Uster Machine to find the variation of three types of yarn considering the major parameters of yarn qualities like irregularity or unevenness (U%), coefficient of variation of mass (CVm%) and hairiness of spun yarn. Relative humidity (RH%) and temperature was showed in table -01 during production of yarn (Figure 6) (Figure 7).

Figure 6 Uster tester-05.1

Figure 7 Ring frame machine.2
Process of sample testing in uster tester: As per uster standard, ten samples were tested for each parameters like unevenness (U%), coefficient of variation of mass (CVm%) and hairiness of spun yarn of 40Ne, 50Ne and 60Ne ring spun yarn. First, second, third and fourth samples were tested from top portion of yarn cone. Fifth, sixth and seventh samples were collected from middle portion of yarn cone. Eighth, ninth and tenth samples were collected from inner portion of yarn cone.
40Ne, 50Ne and 60Ne ring spun yarn of 35% cotton and 65% polyester blended yarn produced with a standard parameters of same quality blended yarn were tested with uster tester to find the variation of three types of yarn taking into consideration of major parameters of yarn quality like unevenness (U%), coefficient of variation of mass (CVm%) and hairiness of spun yarn.
As per uster analysis shown in table 2,3,4 and Figure 8, the sequence of unevenness was found following from low to high that unevenness of 40Ne<unevenness of 50Ne<unevenness of 60Ne and coefficient of variation of mass 40Ne<coefficient of variation of mass 50Ne<coefficient of variation of mass 60Ne.
Similarly, as per uster analysis shown in table 2,3,4 Figure 9, the sequence of coefficient of variation was found following from low to high that Coefficient of variation of mass 40Ne<coefficient of variation of mass 50Ne < coefficient of variation of mass 60Ne.

Figure 9 Coefficient of Variation of Mass (CVm%) among 40Ne, 50Ne and 60Ne cotton and polyester blended yarn.
As per uster analysis shown in table 2,3,4 Figure 10, the sequence of hairiness was observed following from low to high that hairiness of 40Ne>hairiness of 50Ne>hairiness of 60Ne. Hairiness of yarn was decreased when the fineness of yarn was increased i.e the count of yarn number was increased gradually from 40Ne to 50Ne and 50 Ne to 60Ne.
The unevenness, Coefficient of variation of yarn is caused mainly by uneven fiber distribution along the length of the strand. Coarser yarns contain higher number of fibre in crosssectional area of yarn where moisture regain percentage is higher comparing to finer yarn due to having lower number of fibre in crosssectional area of yarn. Moisture regain in any stage may increase the irregularity and coefficient of variation of mass. Moisture regain of the fibers may alter their physical properties and affect capacitive yarn testing. Moisture is not always homogeneously distributed within a thermally conditioned yarn cone. Therefore, deviation of unevenness, coefficient of variation and hairiness may be expected for cotton and polyester blended yarn.
In case of blended spun yarns, cotton and polyester fibers are compacted together by lateral forces imposed by the twist inserted to form the yarn. The discrete nature of cotton and polyester fibre provides variable compactness with plenty of air pockets inside the yarn structure filling in the inter-fiber spaces which may influence the unevenness and coefficient of variation during capacitance yarn testing in uster.
When 40Ne, 50Ne and 60Ne ring spun yarn of 35% cotton and 65% polyester blended yarn produced from the same fiber material, it can be expected that increase of yarn count leads to increase of yarn hairiness because of higher number of fibers in yarn cross-section.
The irregularity (U%), Coefficient of Variation of Mass (CVm%) and hairiness of. Variation of yarn fineness may influence different common production parameters arised in ring spinning like fibre length variation, fineness variation and strength variation, m/c parameters, roller setting, speed of the machine, defective drafting system, defective gears, rollers, worn out of belts, tension, atmospheric condition and controlling of these parameters may minimize the variations of unevenness, coefficient of variation and hairiness of yarn (Tables 2–4).
Sample no |
U% |
CVm% |
Hairiness |
1 |
10.44 |
11.24 |
7.33 |
2 |
11.33 |
11.55 |
7.34 |
3 |
10.38 |
11.39 |
7.32 |
4 |
11.4 |
11.28 |
7.42 |
5 |
10.28 |
11.35 |
7.25 |
6 |
10.58 |
12.11 |
7.72 |
7 |
10.94 |
11.29 |
7.39 |
8 |
11.43 |
11.75 |
7.94 |
9 |
10.88 |
11.99 |
8.22 |
10 |
10.46 |
12.28 |
7.42 |
Table 2 Unevenenss (U%), coefficient of variation of mass (CVm%) for 40 Ne cotton and polyester blended yarn
Sample no |
U% |
CVm% |
Hairiness |
1 |
14.22 |
14.32 |
6.24 |
2 |
13.74 |
14.67 |
6.34 |
3 |
14.36 |
14.47 |
6.32 |
4 |
14.22 |
14.3 |
6.42 |
5 |
14.33 |
14.4 |
6.25 |
6 |
15.12 |
14.9 |
6.59 |
7 |
14.25 |
13.32 |
6.24 |
8 |
13.74 |
14.77 |
6.44 |
9 |
15.66 |
14.47 |
6.52 |
10 |
14.32 |
15.3 |
7.22 |
Table 3 Unevenenss (U%), coefficient of variation of mass (CVm%) for 50 Ne cotton and polyester blended yarn
Sample no |
U% |
Cvm% |
Hairiness |
1 |
17.22 |
18.32 |
5.24 |
2 |
16.74 |
18.67 |
5.34 |
3 |
18.36 |
19.47 |
5.32 |
4 |
18.22 |
19.35 |
5.42 |
5 |
17.33 |
19.43 |
5.25 |
6 |
17.12 |
18.92 |
5.12 |
7 |
17.92 |
18.92 |
6.44 |
8 |
16.84 |
18.77 |
5.34 |
9 |
18.36 |
19.77 |
5.92 |
10 |
18.72 |
19.65 |
5.72 |
Table 4 Unevenenss (U%), coefficient of variation of mass (CVm%) for 60 Ne cotton and polyester blended yarn
Limitations of uster tester for measuring evenness of cotton and polyester blended yarn: Uster CV value of yarn evenness can only denote the unevenness degree of yarns, but cannot reflect the uneven structure of yarns.
Uster CV value of yarn evenness only considers the average of the unevenness degree of yarns and cannot reflect the uneven waves with different characters on yarns, i.e. it ignores the discrete character of yarn unevenness. But these uneven waves of yarns would largely influence the unevenness of cloth cover. Measuring 35% cotton and 65% polyester blended yarns polyester% is higher and sliver blending process was followed for blending if the blended evenness of fibers in yarns is less, the capacitance will change, which will influence the CV values, because cotton and polyester fibre properties are different and the dielectric coefficients of fibres are also dissimilar and dielectric is major fact for yarn testing with capacitance method of uster tester.
The quality of uster result can be controlled by proper conditioning under constant standard atmospheric conditions, exact calibration of the measurement, correct setting of the instrument and adequate sample size for testing.
Faulty fabric14 is the key hasstle for the fabric producers like evenness,15 uniformity and hairiness.16 Weavers are now faced with the evenness requirements knitters have faced, more if they have air jets. All shuttleless looms demand yarn that is superior in strength, evenness and consistency. That holds true for the quality of the package as well. Knitters are now facing increasing quality demands themselves because of tighter stitches and fine gauge machines.
The authors declare that they have no competing interests.

©2019 Hossain, et al. This is an open access article distributed under the terms of the, which permits unrestricted use, distribution, and build upon your work non-commercially.