Journal of
eISSN: 2574-8114


Research Article Volume 1 Issue 5
Department of Chemical and Bio molecular Engineering, The University of Akron, USA
Correspondence: George G Chase, Department of Chemical and Bio molecular Engineering The University of Akron, Akron, Ohio, USA, Tel 443253906
Received: April 03, 2017 | Published: April 27, 2017
Citation: Zhang X, Chase GG. Solid aerosol filtration by electrospun poly vinyl pyrrolidone fiber mats and dependence on pore size. J Textile Eng Fashion Techno. 2017;1(5):180-187. DOI: 10.15406/jteft.2017.01.00030
The pore openings of electrospun fiber mats can vary significantly with fiber diameter and with basis weight for low basis weight mats. To evaluate the effects of fiber diameter and basis weight on filter performance, poly vinyl Pyrrolidone fibers of three average diameters (287, 883, and 1709nm) were electrospun to form nonwoven fiber mats of six basis weights (5, 10, 15, 22.5, 30, and 45g/m2). The fiber mats were tested for capillary flow porometry and solid aerosol capture. The bubble point pore diameter (largest pore) and the mean-flow pore diameter (average pore diameter based on flow measurement) decreased as the basis weight increased and approached minimum plateaus at 30g/m2 basis weight and larger. The mats with larger fibers tended to have larger pores. The minimum plateau bubble point diameters were approximately 1.5~2 times the size as the average fiber diameter. The fiber mats with an average fiber diameter of 287nm and basis weight of 45g/m2 yielded the best separation efficiency (99.89%) in capture of NaCl nano particles of diameters ranging from 25 to 100nm.
Keywords: poly vinyl pyrrolidone, electro spinning, capillary flow porometry, aerosol, particle capture, filtration, aerosol filtration, electro spun, pore size, gas pressure, nanometers, filter thickness, fine fibers, porosity, polymer concentrations, capillary flow porometer
HEPA, high-efficiency particulate air; ULPA, ultra low penetration air; PVP, poly vinyl pyrrolidone; PP, poly propylene
Textiles and fiber mats are used for a wide range of applications. One application that impacts health, safety, and environment is that of aerosol filtration. Fiber mats are often used to remove aerosol particles from air streams. Developments in electro spinning1,2 to produce submicron fibers have generated industrial interests in use of these materials for filtration. Methods and techniques for measuring and characterizing the properties of electrospun mats have been developed but are not yet widely implemented. One property of electrospun fiber mats that is important to filter performance but is not commonly discussed is the pore size distribution. This paper discusses the preparation of electrospun fiber mats, their pore size distributions as a function of basis weight, and performance of the mats in aerosol filtration.
The method of electro spinning to fabricate nano fiber mats is well documented.3−6 Applications of electrospun fibers vary widely and as examples include filtration,7−9 catalysis,10−13 and biomedical engineering.14,15 Specific to filtration, electrospun fibers are used in filters with high efficiencies greater than 99% for particles ranging in size from nanometers to microns. Conventional high-efficiency particulate air (HEPA) filters remove solid particles of 0.3µm diameter and larger achieving separation efficiencies above 99.97%, and Ultra Low Penetration Air (ULPA) filters remove from air at least 99.999% of airborne particles of size 100 nm or larger.16 Novel nonwoven media of electrospun polymeric fibers typically possess high specific surface areas and small pores which are favorable for the particle capture process through interaction mechanisms of interception, inertial impaction, and Brownian diffusion.17 High surface areas generally favor higher capture efficiencies by single fiber mechanisms and the small pores favor capture of smaller particles by straining mechanisms. However, these properties also require greater gas pressure to drive the gas flow.
Improved the filtration performance with respect to the most penetrating aerosol particles without greatly increasing the pressure drop by inter layering nano fiber and microfiber mats in a multilayer filter medium while maintaining certain mechanical strength.18 Ahn et al.19,20 electrospun Nylon 6 fibers of diameters lower than 200nm and conducted aerosol filtration tests to evaluate the filter media performance. They concluded that the Nylon 6 fibrous media performed better than common HEPA filters, making them promising candidates for applications requiring HEPA and ULPA filter media.
Yun et al.21 tested PAN electro spun fibers as a filter medium to capture NaCl nano particles from air. Compared to commercial filters, less mass of electrospun filter media was needed to reach the same performance. The authors concluded that the penetration was strongly dependent upon the filter thickness, while the quality factor and single fiber collection efficiency were dependent on the fiber size. Besides aerosol filtration, electrospun fibrous media have been used to separate particles from liquids. Gopal et al.22 used PVDF electrospun nano fibrous membranes to separate micro particles from water achieving efficiencies above 90% showing the electrospun membranes could be used for water pretreatment and pre-filtration for ultra- and nano-filtration applications.
Poly vinyl Pyrrolidone (PVP) as a commercialized polymer is widely used in a variety of application fields. The raw polymer material can be electrospun to form fine fibers.23,24 Electrospun PVP fibers have been applied for drug delivery25,26 and as membranes in batteries,27 however have received less attention for application in filter media. In this work, PVP fiber mats of different average diameters were electrospun from solutions of different polymer concentrations. For each diameter range, fiber mats of different basis weights were produced. It is well known that filter media thickness affects filter performance. Whereas electrospun fiber mats tend to be very thin and their thicknesses are difficult to measure accurately. For the thin fiber mats the basis weight (mass per mat area) is a more robust and convenient measure for comparison of filter media performances.
The objective of this work was to evaluate filter performance and the corresponding structure changes in the mat as a function of the basis weight. Filter performance depends upon many parameters including porosity, pore size, fiber size, and filter thickness. From common experience, the pore openings of an electrospun fiber mat are known to vary significantly with the fiber size and with the basis weight for low basis weight fiber mats. As the basis weight increases, the pores within the fiber mat gradually approach a minimum plateau. To evaluate the variations of basis weight and pore size on filter performance, PVP fiber mats were electrospun with six basis weights ranging from 5 to 45g/m2 and with three average fiber diameters from 287 to 1709nm. The PVP fiber mats pore size distributions, bubble point pore size, and mean-flow pore diameter, were measured. The electrospun fiber mats were tested as filter media to separate dispersed NaCl nano particles from air.
Materials
Poly vinyl Pyrrolidone (PVP, average Mw~1,300,000, Sigma Aldrich, St. Louis, MO) was dissolved in ethanol (200 proof, Decon Laboratories, Inc., King of Prussia, PA) to prepare solutions with polymer concentrations of 10%, 15%, and 20% by weight. All solutions were mildly stirred for 12 hours at room temperature to be homogeneously mixed and then electrospun without any further modifications.
Electro spinning
Fiber mats were fabricated using a typical single-needle electro spinning setup Figure 1. Each polymer solution was loaded into a 5ml plastic syringe and fed by a syringe pump (New Era Pump Systems, Inc., Farmingdale, NY) at a flow rate of 2mL/h. The metallic needle was charged by a high voltage power supply (Gamma High Voltage Research, Ormond Beach, FL) to generate a potential difference of 25kV between the needle tip and grounded aluminum foil that served as the collector. The aluminum foil was square-shaped (6cm×6cm) and located 20cm underneath the needle tip. Details regarding the electro spinning are listed in Table 1.
PVP Conc. (wt %) |
Solvent |
Voltage (kV) |
Flow Rate (mL/h) |
Tip-Collector Distance (cm) |
Fiber Diameter Range (nm) |
Average Fiber Diameter (nm) |
Standard Deviation (nm) |
10 |
Ethanol |
25 |
2 |
20 |
112-574 |
287 |
70 |
15 |
471-1266 |
883 |
132 |
||||
20 |
873-2628 |
1709 |
318 |
Table 1 Electro spinning conditions and diameters of the electro spun fibers
Characterization
Morphologies of the electrospun fibers were observed using a scanning electron microscopy (SEM, TM3000 & TM3030 Plus, and Hitachi, Japan). SEM images were analyzed by Fibra Quant 1.3 software (nano Scaffold Technologies, LLC, Chapel Hill, NC) to measure the fiber diameters based on a length-weight approach.28 For each concentration, at least 150 fibers were measured to determine the fiber diameter distribution, average fiber diameter, and standard deviation.
For each concentration, PVP fiber mats of six basis weights (5, 10, 15, 22.5, 30, and 45g/m2) were prepared and tested in a capillary flow porometer (CFP-1500AEX, Porous Materials, Inc., Ithaca, NY) to characterize the pore properties including bubble point pore diameter, mean-flow pore diameter, and pore diameter distribution.
Solid aerosol separation experiment
Fiber morphology and diameter
All three electro spinning solution produced smooth fibers as shown in the example images in Figure 4. The fibers were randomly aligned with irregular shaped porous structures. Fiber diameter distributions are shown in Figure 5. The concentrations of the polymer in the electro spinning solutions mainly affected the fiber diameter distributions. As the polymer concentration increased, the fiber diameter range became broader and the average diameter increased significantly. Inspection of images taken at multiple locations and at lower magnifications showed the fiber structure was distributed relatively uniform across the fiber mat(Figure 3).
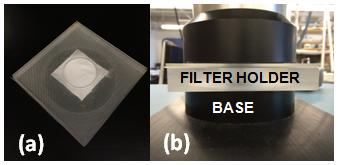
Figure 3 (a) Assembled filter holder with PVP fiber mat on PP mesh sandwiched between Plexiglas plates; (b) Filter holder positioned on filter tester as clamped by pneumatic cylinder.

Figure 4 Example SEM images of the electrospun fibers fabricated from solutions of different PVP concentrations: (a) 10%; (b) 15%; (c) 20%.
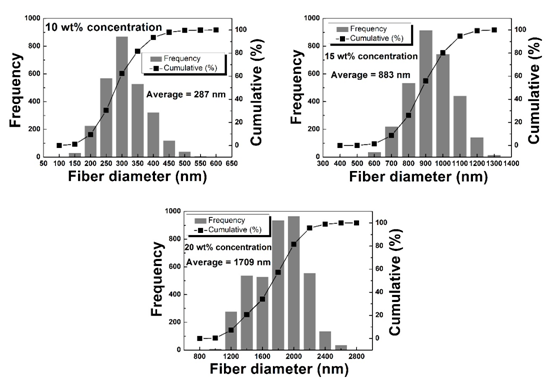
Figure 5 Fiber diameter distributions for different electro spinning solution polymer concentrations. The average fiber diameters increased as the solution concentrations increased.
Fiber mat pores
The capillary flow porometer was used to determine the bubble point pore diameter (largest pore diameter), mean-flow pore diameter, and pore diameter distributions. In the bubble point test, the air pressure was applied to one side of a PVP fiber mat saturated with a liquid of low surface tension. The air pressure was gradually increased until the first air bubble passed through the mat. The air pressure that produced this bubble was used by the instrument to calculate the effective largest pore diameter, i.e. the bubble point pore diameter, as given by the theoretical expression 30.
(1)
Where is the air pressure, is the surface tension of the wetting liquid, is the wetting angle, and is the pore radius.
Equation (1) gives the pressure required overcome the surface tension force that prevents an air bubble from penetrating a cylindrical pore of radius . At pressures above the bubble point pressure, the air flows through pores of smaller sizes corresponding to the applied pressure. The volumetric flow rate of the air through the fiber mat is related to the size and number of pores. The pore size distribution is calculated from the pressure and flow rate data. The air pressure is increased until no new pores are detected. The pore diameter corresponding to the pressure at which 50% of the flow is due to larger pores and 50% due to smaller pores is defined as the mean-flow pore diameter.
Figures 6 & 7 show plots of the bubble point and mean-flow pore diameters for the PVP fiber mats of different average fiber diameters and basis weights. The plots show the bubble point diameters and mean-flow diameters decreased as the mat basis weights increased and reached a minimum plateau at about 30g/m2 basis weight. During the electro spinning process, the collected fibers initially contribute to random mat formation and new fibers cross over large pore spaces thus reducing the pore sizes as the fiber mass increases. However, eventually as more fibers are collected the fibers begin to support each other in the mat thickness direction and fewer large pores are exposed to new fibers to cause reduction of pore size. A point is reached where the fibers no longer decrease pore sizes but increase the thickness and the strength of the mat. This means that the pore sizes decrease but gradually reaches a minimum plateau and become constant as the basis weight increases while properties such as average fiber diameter are constant. The mats with larger fibers had larger pores. By inspection it is observed that the minimum plateau bubble point diameters were approximately 1.5~2 times the size of the average fiber diameters. The minimum plateau mean-flow pore diameters were about half the size of bubble point pore diameters.
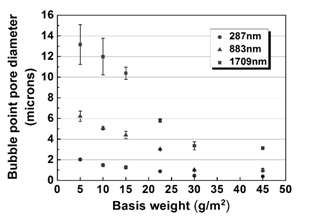
Figure 6 Bubble point pore diameters for different average fiber diameters and basis weights. The data points are the average values of at least three measurements and the error bars represent one standard deviation. For some of the data points the error bars were smaller than the plot symbol.
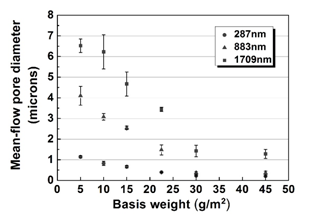
Figure 7 Mean-flow pore diameters for different average fiber diameters and basis weights. The data points are the average values of at least three measurements and the error bars represent one standard deviation. For some of the data points the error bars were smaller than the plot symbol.
Example pore diameter distributions are shown in Figure 8. Due to physical limitations of the porometer (operating gas pressure) the plots were truncated at the smallest pores that the instrument was capable of detecting with reasonable accuracy. The plots show the pore size distributions were non-Gausian (not symmetric), having extended tails towards larger pore sizes. Pore size distributions tended to shift towards larger pore sizes as average fiber size increased (observed when inspecting the plots from the left to right). Pore size distributions tended to shift toward smaller pores as the basis weight increased (observed when inspecting the plots top to bottom).
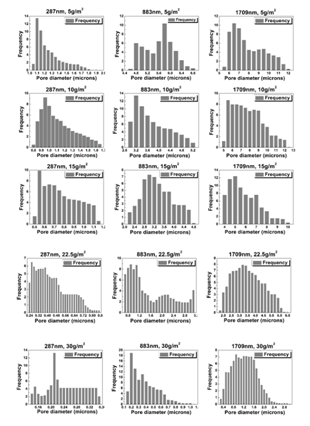
Figure 8 Example pore diameter distributions for different average fiber diameters and basis weights.
Filter Performance
The PVP fiber mats were tested for the capture the NaCl nano particles in the filter tests. The high surface areas of the electrospun mats and the small pore diameters have high potential for capture of nano particles by interception and Brownian diffusion mechanisms. An example SEM image in Figure 9 of a fiber mat after a filter test shows captured particles as white dots distributed on the fibers. The white dots do not appear on the SEM images Figure 4 prior to the filter tests.
Pressure drop and penetration data are plotted in Figures 10 & 11, respectively. For fixed fiber diameters, the pressure drop increased rapidly as the basis weight increased, due to the effects of decreasing pore size and increasing amounts of fiber. As the basis weight approached 30g/m2 and the pore sizes reached the minimum plateau, the pore sizes became constants and the rate of increase of pressure drop with basis weight (slope of the pressure drop versus basis weight) reduced. At the basis weights greater than 30g/m2, the pressure drop was expected to be proportional to mat thickness according to Darcy’s law 31,32,
(2)
Where the permeability, is dependent upon the fiber structure (pore size, fiber diameter, etc.). Here, is the thickness of the medium, is the fluid volumetric flow rate, is the fluid viscosity, is the cross-sectional area of the medium, and is the pressure drop.
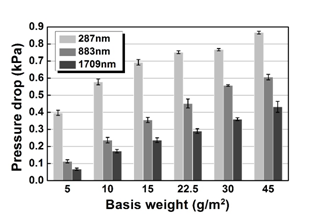
Figure 10 Pressure drops for different average fiber diameters and basis weights. The columns show the average values of at least three measurements and the error bars represent one standard deviation.
The pressure profiles show the pressure drop increases with basis weight at constant flow rate. The data show the pressure drop is roughly linear with the basis weight but with a slightly non-linear decreasing slope. With the available data it is difficult to be certain if the decreasing slope is significant or not and no conclusions are made of this effect. The rough linearity of the pressure drop to basis weight suggests the pressure drop correlates to the mass of the fibers present consistent with single fiber theory 33.
The capture efficiency increased as pore smaller pore sizes increased due to the straining mechanism when pores are smaller than the particle size. Mechanisms such as diffusional capture also increase efficiency, for particles smaller than the pores, as the diffusional distance decreased for smaller pores. Furthermore, capture efficiency increases as the total surface area available for capture increased. At a fixed mass of fibers, mats of smaller fibers had larger surface areas than mats of larger fibers; hence mats of smaller fibers had higher capture efficiencies and smaller penetrations. These mechanisms are consistent with the trends in the penetration in Figure 11. At a fixed basis weight the mats of smaller fibers had smaller penetrations and as basis weights increased the penetrations decreased. The 287 nm fiber mats had nearly zero penetration for basis weights of 15g/m2 and larger.
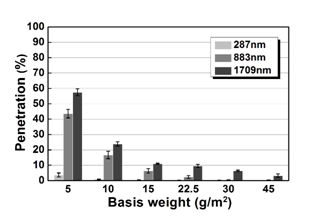
Figure 11 Penetrations for different average fiber diameters and basis weights. The penetrations were essentially zero for the 287nm fiber mats at 22.5, 30, and 45g/m2 basis weights, and the 883nm fiber mats at 30 and 45g/m2 basis weights, and the bars are too small to appear on the plot. The columns show the average values of at least three experiments and the error bars represent one standard deviation.
The overall performance of a filter must take into account both the penetration and the pressure drop. To assess the overall performance of the filter media in one numeric quantity, the Filtration Index (FI) was calculated using the definition 34,
(3)
Where and are the outlet-stream and inlet-stream particle concentrations, respectively. The ratio is the penetration, and is the pressure drop across the filter media. A medium with low penetration and low pressure drop is desired and has a higher filtration index value.
Calculated FI values for the filter test data are plotted in Figure 12. The FI values were in a narrow range between 7 and . Specifically, fiber mats of 45 g/m2 basis weight with an average diameter of 883nm had the highest FI value (10.2 ) as they had one of the lowest penetrations (0.245%) as well as fairly low pressure drops (0.606kPa). Overall, the narrow range of the FI values suggest that FI does not distinguish well enough between the performances hence the selection or design of a filter medium should be based on the penetration or the pressure drop, depending on the application.
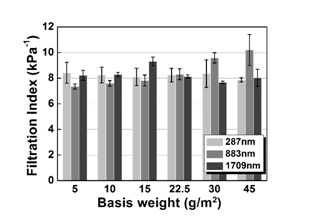
Figure 12 Filtration Indexes for different average fiber diameters and basis weights. The columns show the average values of at least three measurements and the error bars represent one standard deviation.
The filtration tests were conducted up to five runs for each sample and did not consider the effects of particle loading on the life time performance of the PVP fiber mats. Experimentally, the pressure drop tended to increase and the penetration tended to decrease when the same fiber mat sample was tested multiple times. These trends in performance may be due to the aggregation of the NaCl nano particles onto the fibers that restricted the pore space for gas flow and thus increased the pressure drop. The restricted pores could increase the straining mechanism to capture particles and the particles themselves may serve as collectors via mechanisms of Brownian diffusion and interception to increase the capture efficiency and reduce the penetration. This topic should be further explored in future work.
In this work, poly vinyl Pyrrolidone fiber mats of three average fiber diameters were prepared via electro spinning. For each average fiber diameter, fiber mats were prepared in six basis weights to evaluate the effects of fiber diameter and pore size on filtration performance. The bubble point and mean-flow pore diameters decreased as basis weight increased and reached a minimum plateau at 30g/m2 basis weight. The minimum plateau bubble point pore diameters were approximately twice the average fiber diameters of the mats. The importance of this conclusion is the fiber mat structure (ie, pore sizes and porosities) change with the basis weight up to the plateau basis weight. For basis weights greater than the plateau the mat structure becomes constant. The variations in pore sizes and mat structure due to basis weight should be considered when applying electrospun fiber mats in applications such as filtration.
As filters, the PVP fiber mats effectively captured NaCl nano particles from an air stream with the best separation efficiencies of about 99.9%. The pressure drop and particle penetration were influenced significantly by both the fiber diameter and the basis weight, as both significantly determined the pore structures inside the filter media and the total effective surface area exposed to the aerosol flow. In general, as basis weight increased and as the fiber diameter decreased the penetration decreased and the pressure drop increased. The fiber mats of 45g/m2 basis weight and average diameter of 883nm had the highest Filtration Index (10.2 ). The mats of 45g/m2 basis weight and average diameter of 287nm had the least penetration (0.11%).
This research work was financially supported by the Coalescence Filtration Nano fibers Consortium: Ahlstrom, Bekaert, Cummins Filtration, Donaldson, Hollingsworth and Vose, Parker Hannifin, and SNS Nano fiber Technology.
Author declares there is no conflict of interest in publishing the article.

©2017 Zhang, et al. This is an open access article distributed under the terms of the, which permits unrestricted use, distribution, and build upon your work non-commercially.