Journal of
eISSN: 2379-6359


Research Article Volume 1 Issue 1
1Otolaryngology Unit ORLGipuzkoa, Clinica Quiron Donostia, Spain
2Department of Otolaryngology, Clinica Universidad De Navarra, Spain
3Department of Otolaryngology, Hospital Universitario Donostia, Spain
4Department of Otolaryngology, Hospital Comarcal Del Bidasoa, Spain
5Department of Otolaryngology, Hospital General De Catalunya, Spain
6Otoneurology Unit, ENT Departament, IBSAL, University Hospital of Salamanca, Spain
Correspondence: Jorge Rey Martinez, Otolaryngology Unit Orlgipuzkoa, Orlgipuzkoa, Clinica Quiron San Sebastian, Calle de Alkolea 7, 20012, San Sebastian, Spain, Otolaryngology Unit Orlgipuzkoa, Orlgipuzkoa, Clinica Quiron San Sebastian, Calle de Alkolea 7, 20012, San Sebastian, Spain
Received: November 23, 2014 | Published: December 31, 2014
Citation: Rey-Martinez J, Perez-Fernandez N, Ispizua-utierrez A, et al. How to apply classical mechanics to the results of the video head impulse test? J Otolaryngol ENT Res. 2014;1(1):14-18. DOI: 10.15406/joentr.2014.01.00004
Functional evaluation of the vestibulo-ocular reflex (VOR) is one of the most important issues in the examination of the dizzy patient. The video Head Impulse Test (vHIT) has become an essential tool at the bedside and in the laboratory examination of the VOR. Most of vHITs devices only outputs the results of the head and eye movements based on velocity data and graphs, we consider that the position and acceleration data and graphs could have some clinical interest. With this interest we developed a standardized computer-based method to calculate position and acceleration graphs with the velocity data obtained from the vHIT. With the help of a specific computational development program a Graphical User Interface (GUI) was designed. Position and acceleration graphs were done using the classical mechanics methods. The GUI was tested measuring the head and eye displacements in normal and altered vHIT responses. The source files of the developed GUI are available on web: http://mlibra.com. The developed tool can be a useful tool to investigate some vHIT responses.
Keywords: vHIT; Position; Velocity; Acceleration; Classical mechanics; Integral calculus; Differential calculus; Saccades; Algorithm; Software
VOR, vestibulo-ocular reflex, vHIT, video head impulse test, GUI, user interface; XML, extensible markup language
The clinical examination of the vestibulo-ocular reflex (VOR) with the use of video-based tool that measures the eye velocity in response to a fast, high acceleration and unpredictable head impulses in horizontal and vertical planes, also called video head-impulse test (vHIT) is becoming a standard for the evaluation of the patients with dizziness. The vHIT allows for the evaluation of the VOR evoked induced after stimulation of each of the receptors in the different semicircular ampullae of the canals.1 In normal subjects a fast head thrust or impulse to one side will evoke an eye movement that matches the former in velocity; the eye movement occurs in the opposite direction in such a way that at the end of the head movement the eye remains in place because both displacements were similar. In the case when the head movement is incorrectly detected, as occurs in patients with vestibulopathy, the eye movement will be under-compensatory and an eye-position error ensues which provokes visual blurring. In order to resolve this situation, fast eye movements will be produced to move the eye to the expected end point: these are called refixation saccades.2
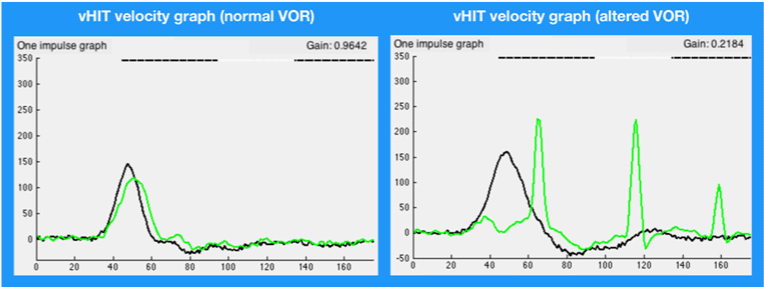
With the use of a head mounted camera to register the eye movement and a sensor for head velocity, the plots of the head and eye velocity are generated in a computer (Figure 1) as a main part of the results of the vHIT’s test. Most of vHIT’s medical devices only output the results of the head and eye movements based on velocity data and graphs, for this research we consider that the position and acceleration data and graphs could have some clinical interest, enhancing the velocity-based results of the vHIT. In theory, applying the classical mechanics principles, the position and acceleration data can be calculated with the velocity data of the same movement. In this article we will describe a standardized method for the head and eye position and acceleration calculation from the velocity data given by some vHIT commercial devices. As example of the clinical interest and possible application of this developed methodology we use it to measure and compare the head and eye displacement occurred on a small sample of vHITs.

Figure 1 vHIT velocity graphs. On the left graph the head velocity (plotted in black) obtained with the head impulse is followed by a similar (in absolute values) eye movement (plotted in green). In the right plot, eye velocity does not follow the head movement and three movements are recorded (refixation saccades) after the head movement has been finished. Y-axis: velocity in deg./s. X-axis: time in (hardware) samples.
The position and acceleration data calculation methodology was developed using MATLAB (MATLAB Release 2014a, The Math Works, Inc., Natick, Massachusetts, United States). First step was to access the original vHIT (ICS impulse, GN Otometrics, Denmark) results database (ICS Data base version 1.2.23). We used the vHIT´s exported results in XML (extensible Markup Language) file format. The access method for the XML file recognition was written in MATLAB code; this method goes over the XML file and stores all impulse data with some metadata information. With the velocity data of each impulse we calculated the position and acceleration data. The integral and differential calculus principles were applied to obtain the acceleration and position graphs according the principles of classical mechanics.3
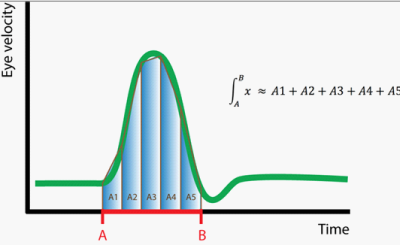
Before applying the integral and differential calculus we standardized the vHIT´s time units. In the original XML file for each impulse velocity units are in degrees per second and time units are in (hardware) samples; so time in samples must be transformed to time in seconds. For this it must be assumed a constant frame rate of 250 samples per second, according with ICS vHIT factory specifications.4 For position vs. time the plot of the selected vHIT impulses the cumtrapz MATLAB function was used to estimate the position of the head and eye. The cumptrapz function estimates the integral of a graphic using the trapezoidal approximation method (Figure 2), which is an accepted method to calculate the area under the curve in periodic functions.5

Figure 2 The trapezoidal approximation method. For the A-B time interval, the area under the eye velocity curve (plotted in green) can be approximated with the sum of the areas of a finite number of trapezoids (A1, A2, A3, A4 and A5) contained in the A-B interval.
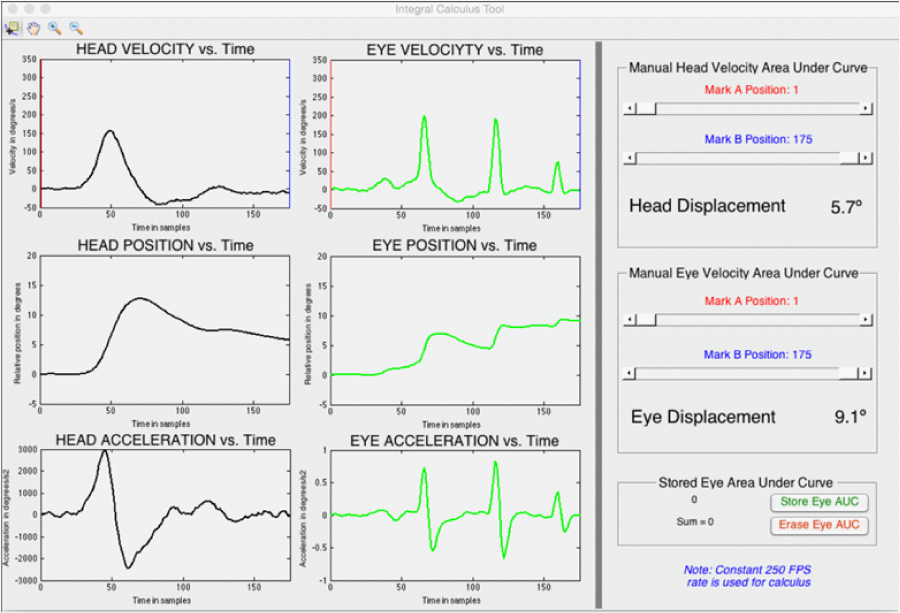
The acceleration vs. time plot was obtained from the variation rate of velocity using the diff MATLAB function. With the calculated data a Graphical User Interface (GUI) was designed, and named Integral Calculus Tool. As shown in Figure 2 one part of this GUI contains the six movement plots, with the tree graphs (velocity, acceleration and position) for head and eye movement. An interval selection tool was also implemented in this GUI, to allow the partial analysis of a determined time interval of the original velocity graphs. To test the Integral Calculus Tool we used 10 anonymized vHIT responses collected from the database of vHITs from the hospital of first author of this study; an experimented explorer performed these vHIT. In normal subjects and in patients, 5 horizontal impulses were selected and in the case of the patients these had to include saccades; patients with spontaneous Nystagmus (to either side) were excluded. All the selected impulses had similar head impulse displacement (7.5-9.5 degrees).
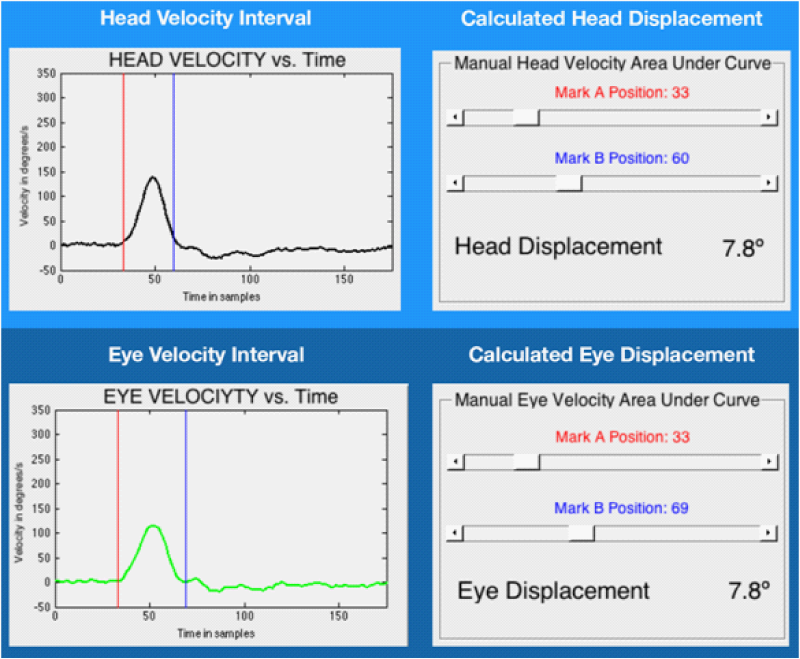
For each impulse the area under curve for the head impulse time interval was compared with the area under curve for the normal eye response (Figure 3). A similar approach was done for the saccades detected (Figure 4&5). The data collected for this study was obtained under informed consent, signed by each participant, authorizing the use of his results in this study. Data for this study were stored in a file as anonymous content (Identifiable patient information was not included in the database used in this study). These terms are in accordance with Spanish regulation applicable to the protection of personal data (LOPD 15/1999).

Figure 3 Head and eye area under curve measurement in normal response impulses. The first row of images is the calculation of the area under curve during the head impulse. The second row of images is the calculation of the area under curve during the eye response. Calculated displacements of the head and the eye are the same, 7.8 degrees.

Figure 4 Head and eye area under curve measurement in altered response impulses. The first row of images is the calculation of the area under curve during the head impulse. The second row of images is the calculation of the area under curve during the first eye response. The third row of images is the calculation of the area under curve during the second eye response. The fourth row of images is the calculation of the area under curve during the third eye response. The accumulative calculated eye displacement is similar to head displacement, 11.9 ≈ 12.5 degrees.
The design of this retrospective study was carried out following the guidelines of the Declaration of Helsinki of the World Medical Association on Ethical Principles for Medical Research Involving Human Subjects. The ethics committee of each participant hospital accepted the protocol of this study. In compliance with the regulation currently in force for research in the Spanish state (ORDEN SAS / 3470/2009) for the type of study (retrospective, observational and anonymized) performed in this paper the design of a study protocol in accordance with Declaration of Helsinki is an ethically valid methodology. According this regulation, for studies of this type, the approval or monitoring by the regional clinical research ethics committee is not required.
As result of this study an Integral Calculus Tool GUI was developed using MATLAB. The GUI was fully operative and its main functions are: velocity vs. time plots, position vs. time plots and acceleration vs. time plots for eye and head movement, interval selection for area under curve calculation, accumulative area under curve calculation. In the test of the Integral Calculus Tool with normal subjects (n=5) the same displacement was measured in head and eye movements. Head displacement (area under impulse curve)=8.36 degrees (SD: 0.23), eye displacement (area under impulse curve)=8.17 degrees (SD: 0.52). In the test with patients (n=5) with detected saccades, the same displacement was measured in head and eye movements. Head displacement (area under impulse curve)=7.98 degrees (SD: 0.35), eye displacement (area under impulse and area under post-impulse)=7.52 degrees (SD: 1.03). These position and acceleration data obtained with the Integral Calculus Tool GUI were in the same value ranges of the values published by other authors.6
The advantages of knowing the acceleration or the position data of the eye and head measured in the VOR responses have been reported in experimental researches.7 The acceleration data are frequently used in other similar exploration techniques,8 but some of these techniques are difficult to use in habitual clinical practice. With the GUI developed in this article, all this data could be obtained and analyzed in the clinical explorations where ICS - video head impulse test is used, without any other additional equipment. The future implications or advantages of the clinical application of this enhanced methodology are actually unknown.
One of the main limitations of our tool is that during the testing a constant sample rate of 250 was assumed; however the data stored in the XML file is not always constant as the vHIT software automatically rejects low sample rates to minimize registration artifacts. As such this “near to” 250 sample rate could affect to the position and acceleration calculations. The ICS vHIT fabricant recommends using the RAW data file for the position calculation, in this RAW file the real time is registered for each measurement. The problem with this RAW format is that all the data recorded during the test is included. The RAW file is a large record file, inside which all files are recorded: the eye an head movements occurred during the well-performed impulses, the not well-performed impulses and even any other movement occurred during the entire test time. To design an automated analysis method based on RAW files, a new impulse recognition algorithm is needed. This algorithm must analyze the entire RAW data selecting the well-performed impulses. The implementation of this impulse recognition algorithm exceeds the proposed methodology for this study. To solve this, we decided to use the XML file format; in which all the data stored is pre-processed by the ICS vHIT software algorithm to select the well-performed impulses.9
The possibility of determining intervals to analyze the graphics is an important feature of the developed GUI. With this feature the user can select and specifically compare the movement during head impulse and eye movements that want to analyze. In certain records may exist head movements (such as overshoot) that does not interest us to analyze, at other times the vHIT can record very low speed movements appeared after the head impulse that the user neither want to analyze. The interval selection feature makes possible that all these movements can be analyzed separately. It has been shown that saccades are one type of compensatory responses aimed to reduce retinal smear during head movements in patients with a deficient VOR.10,11 With the methodology developed in this article we can measure the efficiency of this compensatory mechanism from the data obtained using the vHIT in a small sample of impulses. This methodology can be used in further studies to characterize the saccadic responses on patient with altered VOR. This Integral Calculus Tool GUI has been incorporated in our vHIT advanced analysis software: HIT Cal. The HIT Cal source files are available on web: http://mlibra.com.
In this article we describe a standardized software tool for vHIT position and acceleration vs. time graphs calculation. The developed tool can be a useful tool to investigate some VOR responses.
None.
The authors declare that there is no conflicts of interest.

©2014 Rey-Martinez, et al. This is an open access article distributed under the terms of the, which permits unrestricted use, distribution, and build upon your work non-commercially.