Journal of
eISSN: 2377-4282


Research Article Volume 5 Issue 1
1Barkatullah University, India
2Rajiv Gandhi Proudyogiki Vishwavidyalaya, India
3Advanced Materials and Processes Research Institute, India
Correspondence: Jyotsana Chauhan, HOD in Nanotechnology, Rajiv Gandhi Proudyogiki Vishwavidyalaya, Bhopal, India
Received: January 04, 2017 | Published: January 23, 2017
Citation: Mehto A, Mehto VR, Chauhan J, Singh IB, Pandey RK (2017) Preparation and Characterization of Polyaniline/ZnO Composite Sensor. J Nanomed Res 5(1): 00104. DOI: 10.15406/jnmr.2017.05.00104
Polyaniline/ZnO nanocomposite thin films were prepared via an electrochemical synthesis route on ITO coated glass substrates. ZnO nanoparticles were uniformly dispersed in to the polyaniline matrix. Interaction between ZnO nanoparticle and polyaniline has been studied using X-ray diffraction (XRD), UV-Vis absorption spectroscopy, PL spectroscopy, AFM and I-V characteristics. The ammonia gas sensing behaviors of the polyaniline/ZnO composites were examined at room temperature. It was observed that the composite films showed good sensitivity, improved doping state and enhanced photoluminescence behaviour.
Keywords:Polyaniline, ITO, AFM, UV-Vis absorption spectroscopy, Nanocomposites
Ammonia plays very crucial role for human health. The way of natural process in animals, human and plants are responsible for production of ammonia in atmosphere. High concentrations of ammonia can cause difficulty in breathing, irritation to the eyes and skin and long term exposure of NH3 leads to fatal.1There is a variety of applications of artificially synthesized ammonia in chemical industry, fertilizer factories, textile, food processing, bleaching products and refrigeration systems.2 Therefore the human activity is a main reason for the presence of larger amount of ammonia in our atmosphere and is a necessity to detect its presence. Hence much research has been focused on the development of suitable gas sensitive materials to detect lower concentration of NH3 with excellent performance.3
There are several studies concerning metal oxides like SnO2, WO3, ZnO, TiO2 for NH3 sensing applications but generally it requires a high working temperature.4,5 There are also several conducting polymers like polythiophene, polypyrrole and polyaniline are used for detecting gases, however, the poor selectivity is the main disadvantages of pure inorganic and organic materials. New and interesting properties can be achieved by combining organic and inorganic materials.6 Therefore conducting polymer/inorganic nanocomposites are explored as promising materials for sensing application, because of their good ability and compatibility to form chemical sensors with higher sensitivity at room temperature.
Among the conducting polymers polyaniline based nanocomposites have many advantages. In literature, there are some reports available concerning the synthesis of polyaniline/metal oxide nanocomposites in gas sensing applications. Huyen et al.7 synthesize polyaniline/TiO2 nanocomposites and studies the effect of TiO2 on the sensing features. Lee et al.8 described the effects of O2 plasma treatment on NH3 sensing characteristics of multiwall carbon nanotube/polyaniline composite films. Wu et al.9 reported the characterization and gas sensitivity study of polyaniline/SnO2 hybrid material prepared by hydrothermal route. Deshpande et al.10 reported tin oxide-intercalated polyaniline nanocomposite for ammonia gas sensing applications.
We employed simple electrochemical technique to synthesize polyaniline/ZnO nanocomposites. ZnO nanoparticles dispersed with the polyaniline chains enhanced the doping level and stability of composite structure due to the synergetic effect of the organic polymer and inorganic nanoparticles component, therefore polyaniline/ZnO composite is a promising material for the ammonia gas sensing application at room temperature. In this paper we discuss the ammonia sensing behaviour of polyaniline/ZnO composite structure with different weight percentage (wt %) of ZnO dispersed in polyaniline. The prepared composites were characterized by XRD, absorption and photoluminescence spectroscopy, atomic force microscopy and current voltage (I-V) characteristics.
Synthesis of ZnO nanoparticles
Chemical precipitation method was used for the synthesis of ZnO nanoparticles in a nonaqueous medium. In this synthesis 0.025M zinc acetate and 0.1M sodium hydroxide were added together at room temperature under continuous vigorous stirring. Precipitation was starts following few minutes. After 1 hour of stirring precipitation were collected using centrifugal machine and washed several times in ethanol and dried at room temperature.
Synthesis of polyaniline and polyailine/ZnO nanocomposites
Electrochemical synthesis of polyaniline was carried out using a potentiostat apparatus (EG&G, model 362, USA) with three electrode configuration cell. The three electrodes was working electrode, counter electrode and reference electrode. We used ITO coated glass plate as a working electrode, a platinum foil as the counter electrode, and a saturated calomel (SCE) as the reference electrode connected to the cell using a salt bridge. The electrode position bath contains 0.2M aniline and 0.3M HCl under continuous stirring at room temperature applying of constant DC potential of 1 V vs SCE. Finally the deposited film was rinsed several times with deionised water
Polyaniline/ZnO composites were also prepared by electrode position at a constant DC potential of 1 V vs SCE. In this synthesis different wt% of ZnO (with respect to aniline) nanoparticles were dispersed in an aqueous electrolyte solution containing 2:3 molar ratios of aniline and HCl. Three nanocomposite samples were prepared using the different wt% of ZnO viz polyaniline/ZnO (2 wt%), polyaniline/ZnO (4 wt%) and polyaniline/ZnO (6 wt%).
Characterization techniques
X-ray diffraction (XRD) spectra were recorded by using the XRD (D8 Advanced Bruker, Germany) diffractometer, with CuKα radiation (1⋅542 Å). Optical absorption spectra of the ZnO nanoparticles and composite thin films were determined with the help of a UV-Vis spectrophotometer (UVPC 1601 Shimadzu, Japan). Fresh ITO substrate was used as a reference. Photoluminescence spectra of thin film samples were recorded from luminescence spectrophotometer (LS55 Perkin-Elmer Instruments, UK). Atomic force microscopy (Park System) was employed to examine the surface morphology. Cyclic voltammetry of the electrolytic solution and I-V characteristics of the composite films were examined with the help of an electrochemical analyzer (CH Instruments, model CHI 600E, USA).
Gas sensing test
In order to study the response of polyaniline and polyaniline/ZnO composite film to ammonia gas, aluminium contacts of 2 mm diameter were made on top of the film surface, by vacuum evaporation technique using vaccume coating unit. The chamber pressure during aluminium evaporation was kept around 0.5×10⁻⁶ Torr, and during metal evaporation, film substrates were not heated. A typical device structure for gas sensor has been shown in Figure 1A.
To test the ammonia gas sensitivity of polyaniline and composites films, the sensing electrode of composite thin film was placed in a lab-made U safe tube sensing system of 500 ml volume (Figure 1B). After reaches a steady-state, a certain amount of ammonia was injected into the test chamber. The changes in resistance of polyaniline and polyaniline/ZnO composite sensors were monitored and recorded by using a multimeter.
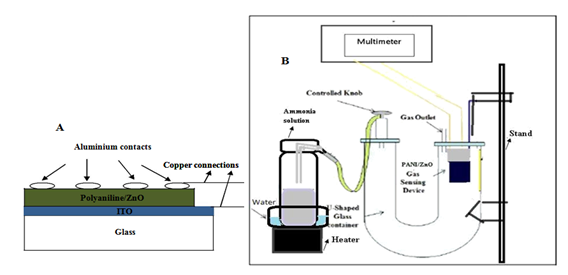
Figure 1 Schematic diagram of (A) polyaniline/ZnO composite sensing device and (B) sensitivity measurement system for ammonia gas.
During the measurements, different concentration of ammonia solution [25%] i.e.100, 200, 300, 400 and 500 ppm volumes were injected to the chamber. After the ammonia was introduced to the chamber, the resistance of the sensors was recorded for 600 s, then the test chamber was flushed with dry air consecutively for another 600 s to make sure that a relatively steady state had achieved before next cyclic test. The sensitivity (S) is defined as
Cyclic voltammetry
The trend of growth of polyaniline film on working electrode was obtained using cyclic voltammetry. In the cyclic voltammetry study the particular onset of current or a peak reveals the occurrence of a specific electrochemical process. Sharma et al. reported that the electro polymerization of polyaniline, depending upon monomer concentration, pH, and the nature of the dopant.11 Figure 2 shows a cyclic voltammogram of HCl doped polyaniline [0.2M aniline and 0.3M HCl ] at a scan rate of 0.05 V/s. Weak noticeable peaks at - 0.8, -0.11, and 0.6 V and a sharp exponential rise in anodic current at 1.0 V were recorded. Observed such weak peaks may be revealed the occurrence of various surface processes.12,13 At the above potential, it is supposed that the aniline monomer undergoes a deprotonation/de-electronization reaction in this specified region as reported by Madhulika et al.14 The peak at 1V was attributed to the emerldine salt form of HCl doped polyaniline. In reverse cycle of scan, we observed the two peaks at 0.13 and -0.48 V which corresponding to the reduction of polyaniline.
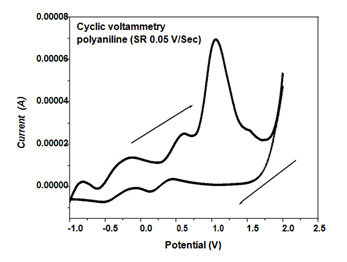
Figure 2 Cyclic voltammogram recorded for polyaniline doped with HCl on a platinum working electrode using a scan rate of 0.05V/sec in a solution containing 0.2M aniline and 0.3M HCl.
X-ray diffraction analysis
The XRD patterns obtained for ZnO and polyniline/ZnO nanocomposite are presented in Figure 3. The XRD pattern of ZnO Figure 3A shows broad peaks at 2θ = 32.80, 34.23, 35.92, 47.46, 59.44, 62.64 and 68.85 which corresponding to the (100), (002), (101), (102), (103), (200), and (104) plane of the hexagonal phase of ZnO respectively. These diffraction peaks show sharp and well defined peaks, indicate the good crystallinity of synthesize material.15 The observed 2θ values are consistent with the standard JCPDS values. The crystallite size of nanoparticles was calculated using Scherrer’s equation. The average size of the ZnO nanoparticles was found to be 7.5 nm.
The XRD pattern of polyaniline/ZnO composite (Figure 3B) contain the characteristic peaks of polyaniline and nanocrystalline ZnO. Diffraction peaks at 2θ= 15.16 , 20.46°, 23.35 and 25.24° are corresponding to the interplaner spacing of 5.73 Å, 4.33 Å, 3.81 Å and 3.53 Å respectively, which represent the emeraldine salt form of polyaniline.14,16 The peaks at 2 =32.20 and 36.46 are corresponding to the nanocrystalline ZnO. The results indicated that ZnO crystallites have been uniformly mixed within the polymer chain. Notice that the characteristic peaks of ZnO are slightly shifted, from their standard position in nanocomposites, which is due to the strong interaction between polyaniline and ZnO. Lee et al.17 reported a similar peak shifting for polyaniline/SnO2 composites. For all the samples, observed peak positions and d-spacing have been summarised in Table 1.
|
Sample name |
2θ (degree) |
d-value (Å) Std. |
Obs. |
Phase assignment |
Particle size of ZnO (nm) |
|
32.8 |
2.81 |
2.72 |
ZnO (Hexagonal) |
||
|
34.23 |
2.6 |
2.61 |
ZnO (Hexagonal) |
||
|
35.92 |
2.47 |
2.49 |
ZnO (Hexagonal) |
||
|
ZnO |
47.46 |
1.91 |
1.91 |
ZnO (Hexagonal) |
7.5 |
|
59.44 |
1.55 |
1.55 |
ZnO (Hexagonal) |
||
|
62.64 |
1.47 |
1.48 |
ZnO (Hexagonal) |
||
|
68.85 |
1.37 |
1.36 |
ZnO (Hexagonal) |
||
|
15.16 |
5.9 |
5.73 |
Polyaniline |
||
|
20.46 |
4.4 |
4.33 |
Polyaniline |
||
|
23.35 |
3.8 |
3.81 |
Polyaniline |
||
|
Polyaniline/ZnO (6 wt %) |
25.24 |
3.5 |
3.53 |
Polyaniline |
≈7.5 |
|
32.2 |
2.81 |
2.77 |
ZnO (Hexagonal) |
||
|
36.46 |
2.47 |
2.46 |
ZnO (Hexagonal) |
Table 1 Summary of XRD results: peak positions, d-values, phase assignments and the calculated particle size for the ZnO nanoparticles, polyaniline and polyaniline/ZnO (6 wt%) composite
Absorption measurements
The observed UV-Vis absorption spectra of ZnO, polyanilne and polyaniline/ZnO (2, 4 and 6 wt %) nanocomposites are shown in Figure 4.
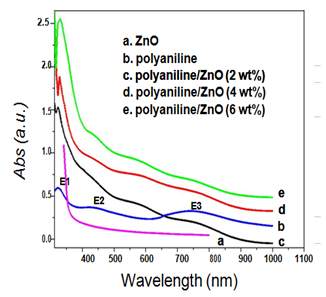
Figure 4 Optical absorbance spectra of (a) ZnO, (b) polyaniline, (c) polyaniline/ZnO (2 wt%), (d) polyaniline/ZnO (4 wt%) and (e) polyaniline/ZnO (6 wt%).
As shown in Figure 4 the sharp absorption onset at 350 nm is corresponding to the fundamental absorption edge of the ZnO nanoparticles. In the absorption spectra of polyaniline (Figure 4), the existence of three characteristic absorption bands around 322, 426 and 750 nm confirms the formation of doped polyaniline and comparable to the known spectral features of precisely characterized redox species of polyaniline.18 The absorption band at 322 nm is due to the π-π* transition within the benzonoid segment. The second absorption band at 426 nm is attributed to the doping level of polyaniline (polaron-π* transition) and the absorption band at 750 nm is related to the formation of localized polaron at the backbone of the polymer (π-polaron transition).19-21 The absorption band positions and corresponding intensities have been reported in Table 2.
|
Sample |
Absorption Peak Position (nm) |
Intensity (Normalized) |
|||
|
E1 |
E2 |
E3 |
E1/E2 |
E1 /E3 |
|
|
Polyaniline |
322 |
426 |
750 |
130 |
121 |
|
polyaniline/ZnO (2 wt%) |
323 |
430 |
756 |
215 |
200 |
|
polyaniline/ZnO (4 wt%) |
328 |
433 |
762 |
201 |
346 |
|
polyaniline/ZnO (6 wt%) |
330 |
439 |
770 |
212 |
392 |
Table 2 Observed absorption peak positions and the normalized intensities for ZnO nanoparticles, Polyaniline and Polyaniline/ZnO composites thin films
From the absorption spectra of composites (Figure 4), we can see that the absorption band due to π-π* transition in the nanocomposites exhibit a increasing red shift from polyaniline to polyaniline/ZnO (6 wt%). Moreover the relative intensities of these bands increase in the composite structures. The observed red shift in the absorption bands may be due to the increasing wt% of ZnO nanoparticles and their interaction with polyaniline.22 Similarly, a systematic red shift was also observed in the peak position for the polaron- π* and π-polaron absorption band in the nanocomposite samples. However, the comparative intensity of these bands decreased remarkably with the increase wt% of ZnO. The intensity of polaron absorption band was decreased with higher doping level due to the uniform distribution of radical cation at the backbone of polymer.23 The decreasing intensity of π-polaron absorption band at ≈750 nm indicated that the doping state improved by ZnO dispersion.
Photo luminescence measurements
Figure 5A represents the photoluminescence spectra of ZnO nanoparticles using excitation wavelength of 300 nm. ZnO exhibited PL peaks at 384 nm, 422 nm and 553 nm. The observed peak at 384 nm is close to the absorption edge of ZnO observed at 350 nm. The observed slight red shift in the PL emission peak from the fundamental absorption edge may be assigned to the electron-phonon or Frohlich interactions.24 The strong green emission band at ~553 nm is due to the defects on the surfaces of nanoparitcles. It is reported that the green emission of the ZnO nanoparticles results from the surface defects formed by oxygen vacancies or the zinc interstitials on the ZnO nanoparticles surface.25,26
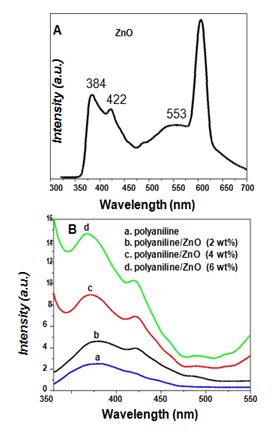
Figure 5 [A] PL spectra of ZnO nanoparticles, [B] PL spectra of polyaniline and polyaniline/ZnO composites using 2, 4 and 6 wt% of ZnO [Ex. wavelength 300 nm].
The PL spectra of polyaniline and polyaniline/ZnO nanocomposite [2,4 and 6 wt% of ZnO] using the excitation wavelength of 300 nm are given in Figure 5B. Polyaniline shows the luminescence peak at 380 nm (Figure 5B), which is due to the recombination involving the polaron bands have been reported in the literature.27 The luminescence peak positions, corresponding FWHM and the normalized intensities observed by PL spectra also reported in Table 3.
|
Sample |
Peak (nm) |
Positions FWHM (nm) |
Normalized Intensity |
|
ZnO |
378 |
51 |
- |
|
Polyaniline |
380 |
70 |
17.06 |
|
Polyaniline /ZnO (2 wt%) |
378 |
81 |
31.3 |
|
Polyaniline/ZnO (4 wt%) |
370 |
34.2 |
61 |
|
Polyaniline/ZnO (6 wt%) |
368 |
25.6 |
100 |
Table 3 The observed peak positions, corresponding FWHM and the normalized intensities in the PL spectra of ZnO, polyaniline and polyaniline/ZnO composites
In Figure 5B-D the nanocomposite samples polyaniline/ZnO [2, 4, 6 wt%] composites also shows the luminescence spectra similar to the corresponding ZnO nanoparticle dispersants but with a considerable enhancement in the relative band edge luminescence intensity with increasing weight persent of ZnO. The enhancement in PL intensity may be related to the process of charge transformation between the electronic levels of polyaniline and ZnO. Due to the strong interaction the charge transfer increases thus the enhancement in PL intensity was observed similar type results have been reported by Weng et al.28 for PEO/CdS/polyaniline composite. Further it is observed that as the concentration of ZnO increased in polyaniline, the band edge luminescence peak was slightly blue shifted. The observed blue shift may also be due to the strong interaction between polyaniline and ZnO nanoparticles.29
Morphological characterization
To study the surface morphology of polyaniline and composite films atomic force microscopy was employed. Figure 6A shows the AFM micrograph of the HCl doped polyaniline which represents the dense packing of ordered polymer bundles. Madhulika et al.14 also reported similar type of dense packing of ordered polymer bundles in HCl doped polyaniline films.
The AFM morphology of polyaniline/ZnO (2 wt%), polyaniline/ZnO (4 wt%) and PANI/ZnO (6 wt%) are shown in Figure 6 B-D respectively. A flower like features is observed in composite sample with 4 and 6 wt% of ZnO loading. Moreover, we observed that higher loading of ZnO (6 wt%) in the polyaniline host lead to increase in the size of the polymeric flower like bundles. The differences in the surface morphology are due to the strong interaction between the nanoparticles and the polymer due to different loading of ZnO. A typical high resolution AFM images of sample polyaniline/ZnO (6 wt%) is also shown in Figure 6E & 6F.
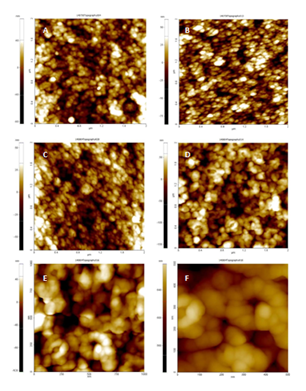
Figure 6 The observed two dimensional AFM images of (A) polyaniline, (B) polyaniline/ZnO (2 wt%), (C) polyaniline/ZnO (4 wt%) and (D) polyaniline/ZnO (6 wt%) thin films. (E) and (F) corresponding to high resolution image of sample polyaniline/ZnO (6 wt%).
I-V curve of polyaniline and polyaniline/ZnO nanocomposite using 2, 4 and 6 wt% of ZnO are shown in Figure 7. All these curves show apparently rectifying behaviour and the current is continuously increased with applied voltage. However in the case of polyaniline/ZnO nanocomposites the current values is much higher as compared to pure polyaniline. Further we can see that as the weight percent of ZnO in polyaniline host increases then the current is also increase therefore these curve indicated that the highest values of current at the higher concentration of ZnO. The turn on voltage for HCl doped polyaniline, polyaniline/ZnO (2 wt%), polyaniline/ZnO (4 wt%) and polyaniline/ZnO (6 wt%) were recorded are 0.38, 0.45, 0.70, and 0.85V respectively.
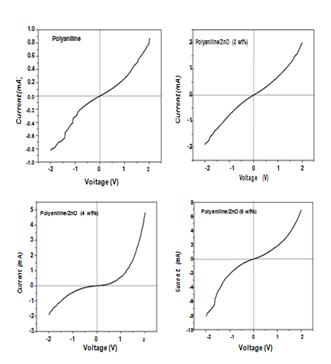
Figure 7 I-V characteristics of polyaniline and polyaniline/ZnO composites using 2, 4 and 6 wt% of ZnO.
Gas sensing analysis
The ammonia sensing profile of polyaniline, polyaniline/ZnO (2 wt%), polyaniline/ZnO (4 wt%) and polyaniline/ZnO (6 wt%) nanocomposites have been shown in Figure 8. The resistance of polyaniline and all the three polyaniline/ZnO composite sensing devices were increased as ammonia gas is injected. The gas sensitivity percentage of all the samples was observed to increase continuously with increasing the gas concentration in the range 100- 500 ppm.
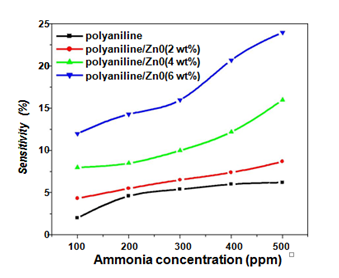
Figure 8 Ammonia sensitivity of polyaniline and polyaniline/ZnO (2 wt%), polyaniline/ZnO (4 wt%) and polyaniline/ZnO (6 wt%) composites for different concentration of ammonia.
In the case of polyaniline alone the sensitivity is low due to lower adsorption of ammonia molecules because of lower surface area. Further it is also observed that the sensitivity is strongly depending on wt% of ZnO. The sensitivity of polyaniline/ZnO composites was found to be increased as the wt% of ZnO in polyaniline increased. The highest sensitivity percent is found in the nanocomposite containing 6 wt% of ZnO. Since we know that HCl doped polyaniline thin film is normally a p type semiconductor while ZnO is a n type semiconductor. In presence of ZnO crystallites, the polyaniline matrix gets a modified structure electronically therefore a p-n junction formed.30 The appearance of a variety of p-n semiconductor contacts likely facilitates the formation of various gas molecular adsorption sites on the polyaniline surface thus the sensitivity is increased as compare to pure polyaniline.7 The electrical conductivity of polyaniline/ZnO composites was found to be much higher then polyaniline and increased with increasing ZnO concentration in polyaniline matrix. Thus the highest sensitivity was found in the composite sample with higher loading of ZnO.
We also studied response and recovery time of the films with respect to ammonia gas exposure. The response time, and the recovery time are defined as the time required for a film resistance to reach 90% of its saturation value from the starting value on gas exposure, and on removal of the gas, respectively. In our case, the polyaniline films had relatively faster response times 10 sec at ammonia concentration of 300 ppm, but as usual the recovery times were relatively larger, around 550 sec. The larger recovery times are likely due to the slow rate of diffusion. The polyaniline/ZnO nanocomposites films have response times of 10-30 sec, and the slower recovery times as compare to polyaniline. Recovery time for polyaniline/ZnO nanocomposite was increased with increasing wt% of ZnO it was ~ 20 min for polyaniline/ZnO (6 wt%) at ammonia concentration of 300 ppm.
We have presented the successful fabrication of polyaniline and polyaniline/ZnO nanocomposites for ammonia gas sensing application. Different weight percent of ZnO have been uniformly dispersed into the polyaniline matrix. The resulting composites were characterized by X-ray diffraction, optical absorption spectroscopy, luminescence spectroscopy, atomic force microscopy, I-V characteristics and sensitivity measurement study. XRD studies confirmed the dispersion of ZnO nanoparticles in polyaniline matrix. The lower intensity polaron absorption bands for polyaniline/ZnO nanocomposites in the UV-Vis spectra indicate that the conducting state of the polymer has been improved. Observed results clearly indicate that polyaniline/ZnO nanocomposite is a good candidate for ammonia sensing with better sensitivity. Photoluminescence measurements represent the improvements in the photoemission following dispersion. I-V characteristics revealed that polyaniline/ZnO sensing device shows more current response as the weight percent of ZnO is increased in polyanilne host, therefore the highest values of current at the higher concentration of ZnO. Sensitivity measurements revealed that the resistance of polyaniline/ZnO composite sensing devices increases with the injection of ammonia gas. The highest sensitivity was found in the composite sample with higher loading of ZnO.
None.
None.

©2017 Mehto, et al. This is an open access article distributed under the terms of the, which permits unrestricted use, distribution, and build upon your work non-commercially.