Journal of
eISSN: 2377-4282


Research Article Volume 3 Issue 1
Washington State University, USA
Correspondence: Nehal I Abu-Lail, Gene and Linda Voiland School of Chemical Engineering and Bioengineering, Washington State University, Pullman, Washington, USA, 99164-6515; Tel: 509-335-4961; Fax:509-335-4806, Tel 509-335-4961
Received: November 06, 2015 | Published: January 12, 2016
Citation: Quisenberry CR, Nazempour A, Van Wie BJ, Abu-Lail NI (2016) Expression of N-Cadherins on Chondrogenically Differentiating Human Adipose Derived Stem Cells Using Single-Molecule Force Spectroscopy. J Nanomed Res 3(1): 00045. DOI: 10.15406/jnmr.2016.03.00045
N-cadherins are important in the initial steps of mesenchymal stem cell chondrogenic differentiation referred to as pre-cartilage condensation. Because of that, the expression of N-cadherins on the surfaces of human adipose-derived stem cells (hASCs) differentiating toward chondrogenesis was investigated using single molecule force spectroscopy (SMFS). To engineer articular cartilage (AC), hASCs were grown in a unique centrifugal bioreactor (CBR) with cyclic oscillating hydrostatic pressure (OHP) and/or transforming growth factor (TGF-β3) to mimic in vivo environments. Static AC tissues grown using micromass or pellet cultures were used as controls. To perform SMFS, anti-N-cadherin monoclonal antibodies were attached to atomic force microscopy (AFM) probes and forces were measured as these probes approached cells. Specific adhesion forces between antibody-functionalized AFM probes and cell surface N-cadherins were then identified, quantified and used to map the distribution of N-cadherins on cells. Our results indicate that a single antibody-antigen interaction has an adhesion force of 79 pN. Multiple antibody-antigen bindings are found to occupy multiples of 79 pN, independent of the culturing method. For tissues grown in the CBR, TGF-β3 elicited an increase in N-cadherin count where SOX9 expression was directly proportional to the increase in N-cadherin. Tissue Young’s modulus also increased with the increase in N-cadherin. When tissues grown in static cultures were compared, they had higher N-cadherin counts and their Young’s moduli were significantly lower than those of the CBR tissues. Our results suggest that the addition of TGF-β3 in the CBR improves chondrogenic differentiation through a path dependent on N-cadherin expression.
Keywords: AFM, Articular cartilage, Centrifugal bioreactor, N-cadherins, Tissue engineering, Young’s modulus.
AC, Articular Cartilage; ACAN, Aggrecan; ADAM-10, A Disintegrin and Metalloproteinase Domain-containing Protein 10; AFM, Atomic Force Microscopy; ANOVA, Analysis of variance; AP, Atmospheric Pressure; ASCs, Adipose-Derived Stem Cells; CBR, Centrifugal Bioreactor; Col II, Collagen Type II; dNTP, Deoxynucleoside Triphosphate; ECM, Extracellular Matrix; EDC, 1-[3-(dimethylamino)propyl]-3-ethylcarbodiimide; EM, Expansion Medium; Erk-1, Extracellular Signal-Regulated Kinase 1; FBS, Fetal Bovine Serum; FV, Force Volume; HASCs, Human Adipose-Derived Stem Cells; HBMSCs, Human Bone-Marrow derived Mesenchymal Stem cells; HG-DMEM, High glucose Dulbecco’s modified Eagle’s Medium; MAPKs, Mitogen-Activated Protein Kinases; MHA, Mercaptohexadecanoic Acid; NC, Negative Control (no growth factor); NHS, N-hydroxysuccinimide; OA, Osteoarthritis; OHP, Oscillating Hydrostatic Pressure; PC, Positive Control; qRT-PCR, Quantitative Real-Time Polymerase Chain Reaction; SAM, Self-Assembled Monolayer; SCs, Stem Cells; SMFS, Single-Molecule Force Spectroscopy; SOX9, SRY (Sex determining region Y)-Box 9; TGF-β3, Transforming Growth Factor β3; WLC, Worm-Like Chain; Wnt, Drosophilamelanogaster Wingless Gene
Articular cartilage (AC) is characterized by its limited capacity for self-regeneration after injury or degeneration because of its avascularity. Damage to AC can result in osteoarthritis (OA) which is a common form of joint disease that affected 27 million US adults in 2005 and incidents are on the rise.1 OA can be detrimental to a patient’s quality of life by limiting their physical abilities and causing pain. Unfortunately, by age 65, the majority of adults will develop some clinical evidence of this disease.2 Current clinical treatments for damaged AC include microfracture and autologous chondrocyte implantation. Unfortunately, these techniques are still insufficient in restoring the durable functional properties of native AC and either cause donor site morbidity or can make a patient susceptible to an immune response or disease transmission.3 The limitations in cartilage defect repair have increased research efforts in AC tissue engineering approaches.
Adult stem cells (SCs), such as human bone-marrow derived mesenchymal stem cells (hBMSCs) and human adipose derived stem cells (hASCs), have been considered as promising cell sources for AC tissue engineering because of their accessibility and their ability to differentiate into multiple cell types including chondrocytes, the primary cell type in cartilage.4 For in vitro chondrogenesis, the appropriate combination of biochemical and biophysical environments are necessary to enhance stem cell viability and to induce their differentiation through cell-cell, and cell-matrix interactions to mimic chondrogenesis in vivo.5 Pre-cartilage condensation, for example, is essential for chondrogenesis and is mediated by cellular condensation through cell-cell adhesion molecules such as N-cadherins.6-8 N-cadherin is a calcium-dependent transmembrane glycoprotein where its extracellular domain forms homophilic interactions between opposing cells and the intracellular domain is anchored to the actin cytoskeleton by α-catenin, β-catenin, and other signaling molecules.6,9,10
Both growth factor supplementation and mechanical stimuli have been shown to affect the level of N-cadherin expression by SCs and to induce SC chondrogenesis. Transforming growth factor beta 3 (TGF-β3) and oscillating hydrostatic pressure (OHP) are among the most commonly used factors to investigate in chondrogenesis studies. OHP is important in the chondrogenic differentiation of SCs and is typically applied up to 10 MPa at 0.5 to 1 Hz for simulation of physiological conditions in vitro.11-13 TGF-β3 can increase the chondrogenic gene expression of SOX9, collagen II (Col II) and aggrecan (ACAN) in hBMSCs by greater than 10-fold, and when used in concert with OHP, it further increases the baseline of SOX9, Col II and ACAN by another 1.9-, 3.3-, and 1.6-fold, respectively by day 14 of culture.12 The importance of mechanical stimulation via OHP is also important for the chondrogenic differentiation and maintenance of adipose derived stem cells (ASCs) .14 OHP can initiate and enhance chondrogenic differentiation of ASCs with or without growth factors.15 In comparison to static controls in which ASCs were exposed only to atmospheric pressure, ASCs with OHP accumulated denser matrices as evidenced by stronger toluidine blue staining of proteoglycans and a 3-fold increase in N-cadherin expression.13,16 OHP at high magnitudes up to 10 MPa is shown to induce SC chondrogenesis, but a more pronounced effect is seen when biochemical growth factors were synergistically applied with OHP. For example, in the Safshekan et al. 17 study, TGF-β1 increased the Col II mRNA expression by 17 times that of the non-supplemented control, but when 5 MPa of OHP was added, the Col II mRNA expression increased by 2.5-fold over the TGF-β1 supplemented control, nearing that of native cartilage.17 The same trend was further confirmed where ASCs, which were exposed to 5 MPa OHP and supplied with TGF-β1, expressed 1.55-, 2.50- and 26.7-fold more SOX9, Col II and ACAN, respectively, compared to the static samples treated with only TGF-β1.11 Although the effects of TGF-β as a medium supplement and OHP as a mechanical stimuli on gene profiles of ASC chondrogenesis have been studied, little is known about their effects either as individual factors or in combination on mechanical properties of tissue constructs obtained by ASC chondrogenesis as well as on the distribution of the N-cadherins on cells.18
With different modes of AFM including single molecule force spectroscopy (SMFS) and indentation AFM, the properties of extracellular matrix (ECM), cells as well as tissues can be probed under native liquid environments and in real time. An SMFS study is simply an AFM study performed with an AFM cantilever modified with a molecule, for example a ligand, that binds to a complimentary molecule on the surface being probed, for example a receptor. The deflection of the cantilever as it detaches from the surface is taken as a measure of the interaction force between the ligand and the receptor. Force spectroscopy by AFM has become increasingly more popular to quantify receptor-ligand interactions.19-26 In addition, AFM has been widely used to indent into cells and tissues and force-indentation profiles have been used to estimate the mechanical properties of these tissues and cells, largely in the form of Young’s moduli.27-29
Our approach to tissue engineering of cartilage is by means of inoculating ASCs in our novel centrifugal bioreactor (CBR) allowing for simultaneous application of TGF-β3 and OHP. To examine the extent of chondrogenesis, in addition to genetic profiling, we benefit from the mechanical and protein mapping capabilities that AFM provides as described above. Specifically, for what may be the first study in the literature, we use SMFS to map N-cadherin proteins on a cell membrane to investigate the relationship between culture method, chemical and mechanical stimuli roles on tissue N-cadherin expression and distribution on cells, and mechanical properties of engineered tissue.
Cell culture supplies were purchased from Invitrogen-Gibco®, Grand Island, NY, USA unless otherwise specified.
Cell culture
hASCs used here were isolated from lipoaspirate tissue of a 33-year-old female (Invitrogen). Cells were cultured in an expansion medium (EM) containing high-glucose Dulbecco’s modified Eagle’s medium (HG-DMEM/F12) under standard conditions (37 °C in a humidified incubator with 5% CO2). The medium was supplemented with 10% fetal bovine serum (FBS), 100 µg/ml streptomycin (Sigma-Aldrich, St. Louis, MO), 100 U/ml penicillin, and 5 µg/ml Gentamicin. Cells were passaged upon 80-90% confluency using Gibco® TrypLE™ Select cell dissociation enzyme and used at passage 7 for the following experiments.
Chondrogenic differentiation
Chondrogenesis was induced in micromass, pellet and in our novel bioreactor as described previously.18 Briefly, for micromass differentiation, 10 µl droplets of 1.6 x 10⁷ cells/ml suspension were placed in the center of each well in a 24-well plate. After letting cells adhere for 2 hours under standard conditions, 500 µl of fresh EM was added. After a day, 250 µl of EM was removed and replaced with either base medium consisting of DMEM/F12 supplemented with 1 mM sodium pyruvate, 2 mM L-glutamine, 5 µg/ml gentamicin, 1% insulin-transferrin-selenium, 50 µM L-proline (Alfa Aesar, Ward Hill, MA) and 1% penicillin-streptomycin (Sigma-Aldrich, St. Louis, MO), or in chondrogenic medium consisting of base medium with 100 nM dexamethasone, 50 µg/ml L-ascorbic acid (Sigma-Aldrich, St. Louis, MO), and 10 ng/ml TGF-β3 (PeproTech, Ward Hill, NJ). Cells that received base medium were considered as negative controls (NCs) and those that received chondrogenic medium were considered as positive controls (PCs). For pellet culture, aliquots of 5 x 10⁵ cells in 500 µl EM were centrifuged for 5 min in 15-ml polypropylene conical tubes. After incubation at standard conditions for a day, half the medium was replaced by either the base or chondrogenic medium as described above. Prior to any CBR culturing, the whole system was sterilized by pumping 70% ethanol for 24 hours. After that, 6 x 10⁶ cells were injected into each bioreactor. Bioreactors were mounted on a COBE SpectraTM Apheresis System (TERUMO BCT, Lakewood, CO) and centrifuged at 500 rpm for 15 minutes. Base or chondrogenic medium supplemented with 20 mM HEPES buffer on a daily basis, for pH control, was continuously pumped for one week into the bioreactors. To expose cells to OHP, medium flow was stopped in reactors and cells within the bioreactors were pressurized for 2 hours a day for a week. The pressure used was 290 psi oscillating at 2 sec intervals. After pressurization, medium pumping was restarted. Samples grown in the bioreactor without OHP were called atmospheric pressure (AP) samples (we neglect the effect of constant hydrostatic pressure caused by the medium head on top of the cells which was approximately 0.003 atm). Bioreactor samples were found to be free of contamination as tested on tryptic soy agar plates. For micromass, pellet and CBR cultures, half the medium was exchanged three times a week. Micromass and pellet cultures served as static controls. Schematics of the reactor and oscillating pressure patterns have been presented elsewhere.18
Cell digestion and immobilization
Cartilage tissues grown in micromass, pellet, or in the CBR were digested to release the cells from the extracellular matrix. Engineered tissues were incubated in tubes containing the culture medium described above supplemented with 10,000 U/g of collagenase type II (Worthington Biochemical Co) overnight at 37 °C at 5% CO2. The cells were filtered through a 100 μm nylon cell strainer and the filtrate was centrifuged at 200-300g for 10 minutes. Cell pellets were collected and seeded onto poly-L-lysine (Sigma-Aldrich, St. Louis, MO) coated glass slides for use in AFM experiments.
AFM tip functionalization with anti-N-cadherin antibodies
To covalently attach monoclonal anti-N-cadherin (Sigma-Aldrich, St. Louis, MO) antibodies to silicon nitride (Si3N4) cantilevers (Bruker Corp., Bruker AXS Inc., Santa Barbara, CA) (Figure 1a), the cantilevers were sputter-coated with a 5 nm Cr adhesive layer followed by a 40 nm Au layer using an Edwards Auto 306 physical vapor deposition sputtering machine. Gold-coated cantilevers were cleaned in ethanol and deionized water (18 MΩ·cm) before deposition of the self-assembled monolayer (SAM) by incubation in a 1 mM solution of 16-mercaptohexadecanoic acid (MHA) (Sigma-Aldrich, St. Louis, MO) dissolved in degassed acetonitrile for 30 minutes. This creates thiol-gold linkages, leaving a SAM of terminal carboxylic (COOH) groups exposed. These cantilevers were then washed with ethanol to remove excess, unbound MHA. To activate the terminal COOH groups, cantilevers were incubated in 0.1 M N-hydroxysuccinimide (NHS) (Sigma-Aldrich, St. Louis, MO) and 0.4 M 1-[3-(dimethylamino)propyl]-3-ethylcarbodiimide (EDC) (Sigma-Aldrich, St. Louis, MO) in deionized (DI) water for 30 minutes each. The cantilevers were then amine coupled to the antibody by incubation in 25 μg/mL monoclonal antibody for 1 hour at room temperature.30 Antibody attachment to cantilevers was verified after experiments by incubation in Alexafluor 488 donkey-anti-mouse antibody (Invitrogen, Carlsbad, CA) for 2 hours. Fluorescent imaging verified that cantilevers with covalently attached primary antibodies fluoresced green, whereas non-functionalized gold cantilevers showed little to no fluorescence (data not shown).
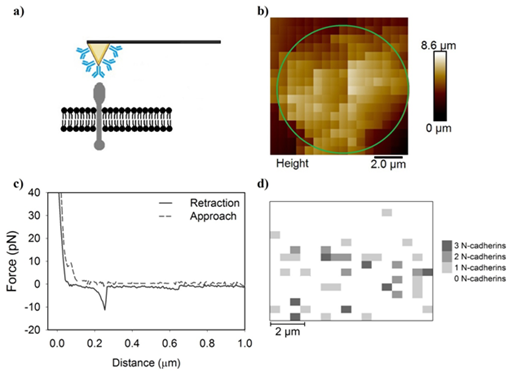
Figure 1 A series of Figures which describe the methodology used in the manuscript.
a) A schematic for how an antibody-modified AFM cantilever can possibly interact with the cell membrane and
b) generates a pixelated height image of the cell. The approximate location of the cell is indicated by the red ellipsoide. Each pixel contains
c) an approach and a retraction curve. If a specific adhesion signaturewas detected in the retraction curve, the magnitude and number of adhesion peaks are recorded to generate
d) an adhesion map demonstrating the quantity of specific adhesion peaks at each pixel and their distributions on cells.
.
AFM experiments
AFM experiments were performed with a PicoForceTM scanning probe microscope with a Nanoscope IIIa controller and extender module (Bruker Corp., Bruker AXS., Santa Barbara, CA). On average, the spring constant, determined by the spectral density of thermal noise fluctuations.31-33 was found to be 0.0559 ± 0.0002 N/m which is near the manufacturer’s reported spring constant of 0.06 N/m. Force curves were collected over a 10 μm scan area using a 16 × 16 grid in force-volume (FV) imaging mode (Figure 1b). Approach and retraction curves were collected for each pixel (Figure 1c) with a trigger threshold of 3.9 nN and loading rate of 6 μm /sec. The retraction data were used to extract specific antibody-antigen adhesion peaks and generate specific adhesion force maps demonstrating the location of N-cadherins (Figure 1d).
Analysis of retraction curves
The retraction curves from each force-indentation profile (Figure 1c) were individually analyzed. Three interaction types existed in the retraction curves. The first was curves with no interactions between the functionalized cantilever and the cell surface (Figure 2a). The second was curves with specific antibody-antigen interactions (Figure 2b) and the third was curves that had nonspecific interactions between the functionalized cantilever and the cell surface with or without specific forces present (Figure 2c).30,33,34 For every 6.4 curves without adhesion, there was 1 with adhesion. Nonspecific interaction forces most commonly represent van der Waals or electrostatic interactions.35 Nonspecific forces occur when forces other than antibody-antigen interactions hold the AFM cantilever to the cell surface.

Figure 2 Example curves demonstrate
a) no specific adhesion,
b) a single specific adhesion peak, and
c) a curve containing specific and non-specific adhesion. The worm-like chain model was fit to the specific adhesion peaks. The arrows indicated peaks that represent non-specific adhesion.
.
To select only specific antibody-antigen binding events, peaks qualified as specific events only if they had a shape that can be fit to a wormlike chain (WLC) statistical model.30,36 also known as the Porod-Kratky chain model, which has been successfully fit to several biological molecules.31 The WLC fits to our specific adhesion peaks are demonstrated in Figures 2b & 2c (Please see the section below for details of the model). In this study, nonspecific interaction forces were excluded from analysis and only specific forces were counted for each treatment group. In a rough estimate of the AFM tip contact area and the size of N-cadherin, we find that approximately 800 molecules could adhere to the AFM tip. As such, we can expect multiple antibody-antigen interactions to occur in a single approach retraction cycle. A single antibody-antigen binding is reported to be about ~100 pN in the literature.20-23,25,37,38 As such, the possibility of having multiple antibody-antigen bindings can cause specific forces to be a lot higher than 100 pN.
Because the cell did not occupy the entire scan area in a force-volume image (Figure 1b), the counts of specific adhesion events were normalized by dividing the protein counts found by the number of pixels that inhabited the cell area. This cell area was determined by comparing the image height with the indentation curves. Areas of low height and high Young’s moduli were considered to be the substrate and were excluded from analysis. For example, the cell in Figure 1b takes up 76.2% of the scanned area.
Determination of protein elasticity–Worm-like chain model
The WLC model was used to determine which adhesion peaks were specifically antibody-antigen interactions. This model can be applied to polymer chains that have continuous curvature in which the direction of curvature is random at any point in the chain. The WLC model takes into account the local stiffness of the chain in terms of the persistence length LP and the long-range flexibility. The force required to stretch a wormlike chain in a solvent to length D is given by31:
where kB is the Boltzmann constant, T is the absolute temperature and LC is the polymer contour length. In equation 1, Lp and Lc are the fitting parameters and chains can’t be extended beyond their contour length. The appropriate fit was chosen by the method of least squares in which the overall solution minimizes the sum of the squares of the errors in equation 2.
where F is the applied force, EY is the Young’s modulus, R is the relative radius, is Poisson’s ratio, and is the indentation depth. Force-indentation data were fit to the Hertz model using in-house designed Matlab software. The best fit was chosen based on the R2 value closest to 1.0. The Hertz model can be used on our cells because the indenter is not deformable, and because it was only applied to the linearly elastic portion of the indentation profile.
Gene expression
Quantitative real time polymerase chain reaction (qRT-PCR) was used to quantify gene expression of SOX9. Total RNA was isolated with TRIzol and chloroform was used for phase separation. The aqueous phase, containing total RNA, was purified using the MagMAX™-96 for MicroarrayTotal RNA Isolation Kit (Life Technologies, Carlsbad, CA) according to the manufacturer’s specifications. Genomic DNA was removed using MagMAX™Turbo™DNase Buffer and TURBO DNase from the MagMAX kit. Total mRNA (up to 2.5 μg) was reverse-transcribed into cDNA using SuperScript® VILO™ Master Mix, which includes: SuperScript® III RT, RNaseOUT™, Recombinant Ribonuclease Inhibitor, a proprietary helper protein, random primers, magnesium chloride (MgCl2), and deoxynucleoside triphosphate (dNTP) (Invitrogen, Carlsbad, CA). cDNA was amplified with the TaqMan® Gene Expression Master Mix (Applied Biosystems, Foster City, CA) on an ABI 7900HT Sequence Detection System (Applied Biosystems, Foster City, CA) and probes specific for GAPDH (housekeeping gene), sex-determining region Y (SRY)-box 9 (SOX9; Hs00165814_m1), were used. The relative gene expression was calculated using the ∆∆CT method, where fold difference was determined using the expression 2 -ΔΔCT as described previously.41 mRNA values prior to differentiation (day 0) were used as a reference to normalize subsequent mRNA data. For each pellet and micromass control, triplicates were analyzed for each treatment group. Each replicate consisted of four constructs grown under the same conditions.
Statistical analysis
Statistical analysis was performed using the SigmaPlot 11.0 (Systat Software Inc., San Jose, CA) software package. One-way analysis of variance (ANOVA) was used with the Dunn test to determine whether significant differences existed between treatment groups, with statistical significance reported at the 95% confidence level (P<0.05). A t-test was used when comparing only two samples to determine significance (P<0.05).
Adhesion force for a single N-cadherin-antibody interaction
Antibody-antigen signatures were identified for all treatments based on the criterion discussed in the methods. When collected together from all treatments into a histogram (Figure 3a), data demonstrated a single-tail distribution. According to the literature, strength of single antibody-antigen interactions are typically around 100 pN.19 As such, we looked at the distribution of adhesion forces under a 100 pN to determine if our single molecule binding force followed the trends reported in the literature. The distribution of adhesion strengths in this range were moderately constant (Figure 3b).This indicates that the probability of an adhesion force between 60 and 100 pN is approximately the same. Because of that, the average of all data in this range which was 79 ± 12 pN was used as the strength of a single N-cadherin antibody-antigen interaction. Under a 100 pN, there was no statistical significance between the means of the specfic forces reported for each treatment group (Dunn method, P<0.05, Figure 4).
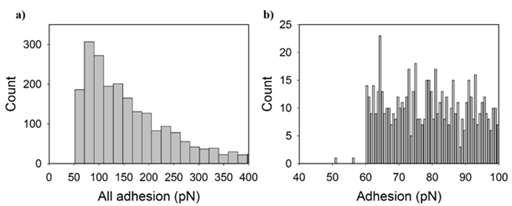
Figure 3 Histograms indicate the number of specific adhesion peaks collected from all treatment groups for each adhesion magnitude. Adhesion forces are displayed from
a) 0 to 1000 pN and
b) 40 to 100 pN. The histogram in (b) represents single antigen-antibody force events while in (a) reflects single and multiple anitigen-antibody bindngs.
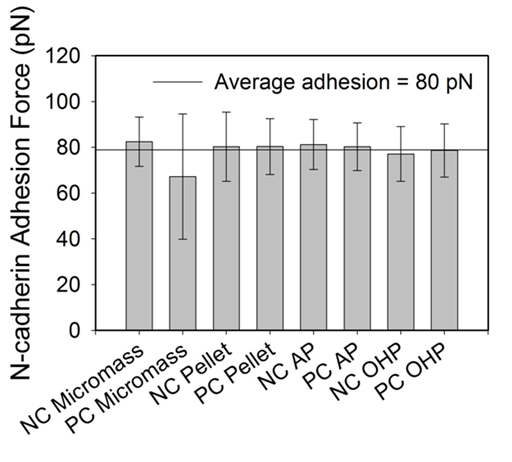
Figure 4 A bar graph indicating the average adhesion force under 100 pN for each treatment group. The horizontal solid line indicates the average of all treatment groups and error bars indicate the standard deviation. All treatment groups are statistically similar (P=0.029).
Antibody-antigen interaction forces in the literature have been reported at a myriad of ranges including 40-100 pN.20,22,23,25,38 depending on the loading rate of the AFM tip. Our average adhesion force for an N-cadherin-antibody interaction is within the range of antibody-antigen adhesion forces reported, but it is important to note that the adhesion magnitude is dependent on the loading rate. A faster loading rate is well known to be correlated with a higher unbinding force.21,26 It is also interesting to note that antibody-antigen interactions were found to occupy adhesion force ranges that are multiples of what is considered a single antibody-antigen adhesion force. This is possible as was discussed in the methods due to the large area of contact between the tip and the cell and as will be discussed below.
Forces involved in multiple antibody-antigen interactions
Specific adhesion forces greater than 100 pN reflect forces due to multiple antibodies binding multiple antigens in a single contact event between the cantilever and the cell surface.22,30 To describe specific forces greater than a 100 pN, the one-tailed histogram that was constructed from all specific forces obtained for all treatments (Figure 5) was segmented so that log-normal fits would follow the existing peaks observed in the histogram. Because the logarithm of the quantities appear to take on a normal distribution, the log-normal dynamic peak function (Equation 3) was used to fit the histogram segments, yielding the most probable adhesion force for each segment (Figure 5). The log-normal distribution function is described by:
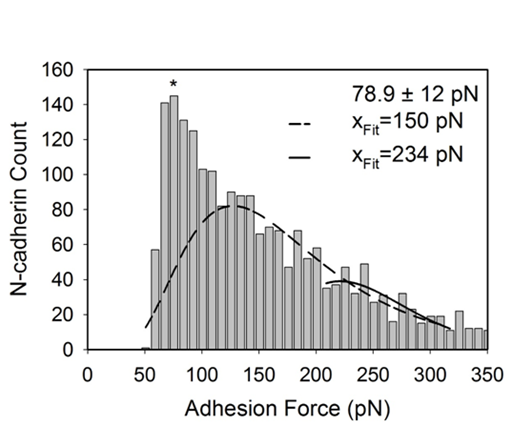
Figure 5 The log-normal function was fit to the observed peaks of the one-tailed histogram. The log-normal peaks yielded the most-probable adhesion force for each segment. The * indicates where the single-binding value of 79 pN is located based on the average for forces under 100 pN. The other listed values (xFit) indicate the most probable adhesion force for each subsequent peak.
where is the adhesion force, is the count, and are constants and is the most-probable adhesion force. The first, and most obvious, peak was not fit to a log-normal function because it was already chosen to be 79 pN from the average adhesion of all treatment groups under 100 pN. The following peaks had most-probable adhesion forces that were approximate multiples of 80 pN. In other words, the most-probable forces were evenly spread and had magnitudes that were multiples of a single antibody-antigen interaction. For example, an interaction force of 150 pN likely represents two N-cadherins binding to two anti-N-cadherin antibodies on the cantilever tip. After multiple antigen-antibody bindings have been assigned forces, specific forces obtained for each treatment group were analyzed individually to determine the probability of observing single or multiple N-cadherins on cellular surfaces. To do this, forces under 115 pN were tabulated to be a single antibody-antigen interaction, forces between 115 and 185 pN were tabulated to be two antibody-antigen interaction, and forces between 185 and 269 pN were tabulated to be three antibody-antigen interactions (Figure 6). For simplicity, antibody-antigen interactions over 269 pN were ignored as they did not easily fit a log-normal distribution.
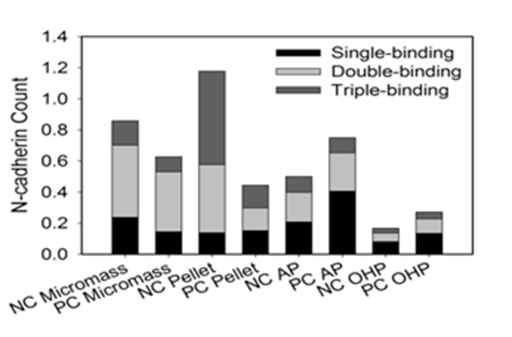
Figure 6a Stacked bar graph indicates probability of adhesion peak magnitude to be multiples about 79 pN, 150 pN, and 234 pN.

Figure 6b Adhesion maps indicating location of specific adhesion peaks in each 10 μm scan area. The white background indicates no binding event. Lighter colors indicate multiple specific adhesion peaks at each pixel.
Effect of culture method on cantilever binding of multiple N-cadherins
Samples grown in the CBR in the presence or absence of OHP or TGF-β3 were charcterized by more single N-cadherin-antigen interactions (Table 1) than those grown in static cultures. Single specific interactions made up 33.1% to 47.0% of the specific interactions observed for PC and NC AP-CBR samples (without OHP), respectively. Upon supplementing the CBR with OHP, the single specific interactions made up 39.2 % and 39.8% for the NC and PC samples, respectively. In comparison, they made up only 8.33 to 30.0% of the total interactions observed for static micromass and pellet PC and NC samples.
The expression of N-cadherins on surfaces of cells from static and CBR cultures
Static cultures, i.e., micromass and pellet cultures, have relatively higher total counts of N-cadherin compared to the N-cadherin counts in the CBR (Figure 6). This can be attributed largely to the occurence of multiple bindings in the specific interactions observed for static cultures (Table 1). NC Micromass, NC Pellet, and PC-AP samples are each statistically higher compared to the oscillating pressure samples, NC-OHP and PC-OHP. Unlike OHP, TGF-β3 has no statistically significant effect on N-cadherin expression. Although no statistical differences were observed upon the supplementation of TGF-β3 to growth conditions, the collective negative trend in the N-cadherin count as TGF-β3 increased in static cultures and the collective positive trend in the N-cadherin count as TGF-β3 increased in the CBR samples are worth noting. OHP caused 5- and 7-fold reductions in N-cadherin expression compared to the NC Micromass and NC Pellet cultures, respectively. These differences were statistically significant. Although the difference between NC-AP and NC-OHP was not statistically significant, OHP still caused a 2-fold decrease in N-cadherin count.
Correlation between N-cadherin protein count and Chondrogenic Differentiation
As a measure of chondrogenic differentiation, the mRNA expression of SOX9 was evaluated. A strong positive linear correlation (, R2=0.96) exists between SOX9 mRNA expression and the normalized N-cadherin count for CBR samples (Figure 7a). The correlation for static cultures was weaker (R2=0.45) and negatively correlated () (Figure 7 a,b).
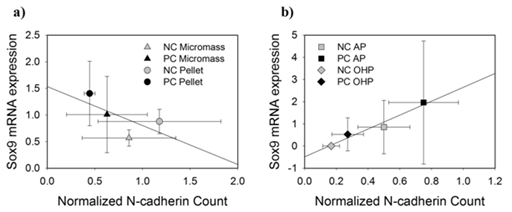
Figure 7 Plots show the SOX9 mRNA expression plotted against the N-cadherin counts for a) static cultures and b) CBR cultures.
The tissue Young’s modulus was correlated with the N-cadherin count. As the normalized N-cadherin count of the CBR tissue increased, the Young’s modulus also increased. In comparison, as the normalized N-cadherin count decreased, the Young’s modulus of the static tissues decreased (Figure 8). Quantitatively using Figure 8 and upon supplementation with TGF-β3, the N cadherin normalized count for transitioning micromass from NCs to PCs decreased from 0.859 to 0.627 and that reduction was associated with a reduction in ECM stiffness as observed by a reduction in Young’s moduli values from 1.85 to 0.498 kPa. Similarly, when the pellet cultures transitioned from NC to PC cultures due to supplementation with TGF-β3, the N-cadherin normalized count decreased from 1.18 to 0.445 and that was associated with a reduction in Young’s moduli from 3.81 to 0.872 kPa. Finally, when TGF-β3 was synergistically added to the OHP CBR cultures, an increase in the N-cadherin counts between 0.167 and 0.271 was accompanied by an increase in the Young’s moduli between 171 and 318 kPa as tissues transitioned from NC to PC cultures.
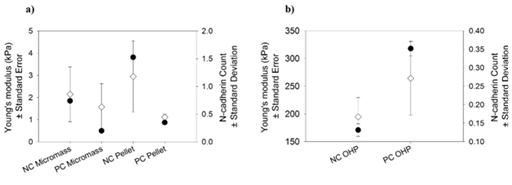
Figure 8 The Young’s modulus (closed circles) of the tissue is compared to the N-cadherin count (open diamonds) for each treatment group in a) static cultures and b) OHP CBR samples. Note the differences in scale. Error bars represent standard error for the Young’s modulus and standard deviation of the normalized N-cadherin count.
N-cadherin has primarily been associated with early chondrogenic differentiation where it initiates and reaches its highest level during mesenchymal condensation.6,42 Although not statistically significant, TGF-β3 had different effects on N-cadherin depending on the culture method. In static cultures, TGF-β3 elicited a 1.4- and 2.7-fold decrease in N-cadherin expression for micromass and pellet samples, respectively. In the CBR, for AP and OHP samples, TGF-β3 caused a 1.5- and 1.6-fold increase in N-cadherin expression, respectively. Literature shows conflicting results on whether TGFβ has a positive or a negative effect on N-cadherin expression which is reflected by our inconclusive data. TGF-β3 is thought to modulate N-cadherin expression levels through activation of mitogen-activated protein kinases (MAPKs) p38 and Erk-1.9 Isoforms of TGFβ have been implicated in increasing pre-cartilage condensation by up-regulating N-cadherin and N-CAM.43 which coincides with the role of TGF-β3 in enhancing chondrogenesis by promoting the expression of SOX9, aggrecan, and collagen type II .44 This role of TGF-β3 is a likely reason for the phenotype observed in CBR samples in that TGF-β3 elicits an increase in N-cadherin count, SOX9 and Young’s modulus.
In CBR samples, N-cadherin expression had a positive linear trend when compared to SOX9 mRNA expression. SOX9 was used as a marker for chondrogenic differentiation as it is the master transcription factor in this process. In static cultures, a negative linear trend was observed between SOX9 mRNA expression and N-cadherin count. It is no surprise that N-cadherin and SOX9 are related as they are regulated by similar signaling mechanisms such as those associated with the bone morphogenetic proteins and the Wnt pathways. Wnt activates β-catenins, so at high levels, Wnt promotes chondrocyte hypertrophy toward endochondral ossification. When at low levels, Wnt promotes SOX9 expression to promote chondroprogenitor differentiation.45 Furthermore, chondrogenic differentiation is directly correlated with the initial cellular condensation of mesenchymal stem cells for which N-cadherins are responsible.46 Inhibition of N-cadherin also suppresses chondrogenesis by preventing the cells from aggregating.47 For CBR samples, we can see that the relationship between N-cadherin and SOX9 holds true in that they are positively related.
N-cadherin induces the expression of the chondrogenic master transcription factor SOX9 which prompts the up-regulation of SOX5 and SOX6.These, along with SOX9, allow for chondrogenic differentiation and synthesis of the extracellular matrix (ECM).46,47 To check if SOX9, which promotes N-cadherin production, has promoted the production of ECM, ECM integrity was quantified by estimating the tissue Young’s modulus. Although standard deviations are large, N-cadherin count and tissue Young’s modulus followed similar trends in that as Young’s modulus increased, so did N-cadherin count. The differences in the Young’s moduli of the static controls and the CBR cultures are statistically significant. In summary, for the CBR samples, N-cadherin increases with TGF-β3 application and a combination of TGF-β3 and OHP is correlated with a linear increase in SOX9 with N-cadherin expression.
An increase in SOX9 promotes chondrogenic differentiation of ASCs and the excretion of ECM to form a tissue with increased mechanical properties as measured by relatively high Young’s moduli nearing those of native cartilage.47
The trend for static controls varied from that observed for the OHP tissues. The variation begins with N-cadherin’s negative response to TGF-β3 treatment in static cultures. Micromass and pellet tissues had 1.4 and 2.6-fold lower counts of N-cadherin when TGF-β3 was supplemented in the media, respectively. This may be explained by TGF-β3’s ability to cleave N-cadherin proteins at their ectodomain using ADAM 10.48 The mutagenesis of this cleavage site suppresses cellular aggregation and proteoglycan synthesis.49 With an opposite trend to that observed with the CBR samples, static cultures showed a negative correlation between N-cadherin and SOX9 mRNA expression. This could be in part due to cleavage of the N-cadherins. As mentioned above, the cleavage of N-cadherins is essential for cellular differentiation. The reduced number of N-cadherins leads us to believe that they were cleaved and therefore differentiation can and does occur as measured by the increase in SOX9 expression. Similar to CBR samples, N-cadherin expression was proportional to the tissue Young’s modulus in static cultures. This follows with the role of N-cadherins in cell-cell adhesion. Stronger cellular adhesion may be improving the integrity of the tissue. This implies that applying pressure during culture is important for proper ASC chondrogenic differentiation and for enhancing tissue mechanical properties.
As we saw earlier, there were different effects in the CBR compared to the static controls. OHP, for example, had on average 3.3-fold less N-cadherin than the static cultures, specifically NC Micromass, NC Pellet, and PC-AP. The literature fails to provide direct evidence for why OHP causes a decrease in N-cadherin in ASCs undergoing chondrogenesis, but it does explain some of the effects that mechanical stimulation can induce on the N-cadherin function. For example, oscillatory fluid flow disrupts the association of β-catenin with N-cadherins by 30% .50 This suggests that adheren junctions are mechano-regulated and means that oscillatory fluid flow causes an increase in the cytoplasmic pool of β-catenins without affecting their phosphorylation. The effect that mechanical stimulation has on N-cadherin expression can also depend on other environmental factors such as substrate stiffness. Differing from our study which shows a reduction in N-cadherin as a result of oscillatory hydrostatic pressure, intermittent mechanical strain for 5 days increased the expression of N-cadherin by 35% on rough materials but did not affect N-cadherin expression on smooth surfaces.51
Our study indicates that tissues engineered with OHP and in static environments respond differently to TGF-β3 supplementation from tissues engineered in the CBR. Although correlations were found with SOX9 and tissue Young’s modulus, N-cadherin expression as measured here was rendered ineffectual as a determinant of chondrogenic differentiation. Despite N-cadherin’s important role in mesenchymal condensation preceding chondrogenesis, its expression is reduced after the cells have begun to differentiate into chondrocytes and is not found in mature cartilage tissue.6 Since our cells were investigated late in culture, on day 23, N-cadherin expression may have been diminishing. In the future, engineered cartilage tissues in CBR or in static cultures will be probed for N-cadherin distributions on cells at day 3 of culturing or earlier when cell condensation is important and numbers of N-cadherins are more significant. Nonetheless, our study here provided a detailed protocol for how N-cadherins can be mapped on cellular surfaces using SMFS methods and how force data collected can be comprehensively analyzed to correlate N-cadherin counts to functions of AC tissues such as mechanical properties or to signaling pathways governed by certain chondrogenesis markers such as SOX9.
The adhesion force for an N-cadherin-antibody interaction was shown to have the same magnitude independent of treatment group with a single interaction equaling 79 ± 12 pN and two and three antibody-interactions equaling multiples of the single interaction at 150 and 234 pN, respectively. The culture method affected the N-cadherin expression, chondrogenic differentiation as measured by SOX9 mRNA expression, and tissue Young’s modulus. In CBR samples, TGF-β3 caused a 1.5- and 1.6-fold increase in N-cadherin count, respectively and N-cadherin count was directly proportional to the SOX9 expression and tissue Young’s modulus. These results suggest that the addition of TGF-β3 in the CBR improves chondrogenic differentiation through a path dependent on N-cadherin expression. Furthermore, improved chondrogenesis increases the tissue mechanical properties as measured by its Young’s modulus. The effects in static culture do not follow the trends found in the CBR. In these samples, although N-cadherin expression was higher than that of the CBR samples due to multiple bindings, TGF-β3 caused N-cadherin expression to decrease, likely due to cleavage of N-cadherins. With strong linear trends, the important statistically relevant results from this study are that the N-cadherin count was statistically 3.3-fold lower and the Young’s moduli were significantly over 44 times higher in OHP samples compared to other treatment groups. Overall, results suggest that oscillating hydrostatic pressure in our novel CBR is important in improving the chondrogenic differentiation as well as the tissue mechanical properties of engineered cartilage grown from ASCs.
This work was supported by an NSF EAGER grant CBER-1212573 and an NSF GRDS supplement for the EAGER grant CBET-1245188. The authors would like to thank:
None.

©2016 Quisenberry, et al. This is an open access article distributed under the terms of the, which permits unrestricted use, distribution, and build upon your work non-commercially.