Journal of
eISSN: 2377-4282


Mini Review Volume 4 Issue 3
1Graduate School of Biostudies, Kyoto University, Japan
2Center for Biotechnology, National Taiwan University, Taiwan
Correspondence: Kunio Takeyasu, Graduate School of Biostudies, Kyoto University, Yoshidakonoe-cho, Sakyo-ku, Kyoto 606-8501, Japan, Tel 81-75-753-6852, Fax 81-75-753-6852
Received: November 01, 2016 | Published: November 17, 2016
Citation: Takeyasu K, Gilmore JL, Deguchi K, Hejna JA (2016) Development of Nano-Biology with Atomic Force Microscopy. J Nanomed Res 4(3): 00089. DOI: 10.15406/jnmr.2016.04.00089
The first observation of double-stranded DNA by atomic force microscopy in the late 1980’s greatly encouraged many biological researchers to jump into the nano-world. Here we briefly review the history of how AFM has been utilized to reveal nanometer-scale structures of DNA-protein complexes, and we highlight key technical developments that have accelerated applications of AFM to molecular biology, physiology, biophysics, and cell biology.
Biology is a visual science. Understanding the ‘biological events’ around us through visualization and observation has always been a fundamental part of biological scientific inquiry. Since the early days in the 17th century, biological investigations of the fundamental components of biological systems have relied on microscopes, the resolution of which is limited to one half the wavelength of light. Electron microscopy (EM), invented in the 1920-1930’s, brought a hundred times greater resolution than the light microscope, and it continues to enable us to visualize biological materials in the nanometer range.1 However, EM requires special specimen preparation and operational constraints, e.g., coating the sample with a fine layer of gold and observing it under vacuum. These limitations were in large part circumvented in the 1980’s by an altogether new concept.
Shortly after Binnig invented atomic force microscopy (AFM).2 Hansma.3 proposed many possible uses for AFM in biology.3 However it took almost 20 years for it to become an indispensable technique in biological research that allows observations in solution without fixation of the specimen. Commercially available instruments equipped with a scanning method known as the tapping mode.4,5 have yielded unprecedented views of biological materials such as DNA and proteins in their native state. The subsequent invention of high-speed AFM.6 which can scan biological samples in solution with sub-second temporal resolution, was a landmark accomplishment that has contributed greatly to the establishment of nanobiology as a major field in bioscience.7
DNA biology and enzymes at work: Single-molecule biochemistry
The first notable application of AFM to biological samples was the observation of DNA in the late 1980s, albeit with many technical limitations. The scanning could be done only with the contact mode which resulted in serious damage to the sample; therefore, the specimen required a protective coating, e.g. cytochrome C. With technical advances over the past 20 years, it is now possible to analyze the physical properties of naked nucleic acids in solution (e.g. thermodynamic fluctuation) using high-speed AFM with sub-second temporal resolution, and without fixation (Figure 1). This new single-molecule analytical method opens up a way of exploring the molecular mechanisms of DNA-protein interactions. For example, the binding and action of restriction enzymes on DNA.8,9 (Figure 2A) and RNA polymerase.10 have been explored.

Figure 1 Dynamic motion of DNA in solution captured by fast-scanning AFM. (A) A snapshot of a 3 kbp DNA plasmid. (B) Consecutive AFM images obtained over 30 seconds were overlaid. The data illustrate thermodynamic fluctuations.
The only technical limitation was the requirement for the specimen to be adsorbed onto the substrate, i.e., the mica surface, which might prevent some free movement of DNA/proteins. This limitation has been overcome in one instance by using ‘DNA Origami’, where a target DNA sample can be tagged and an interacting protein can move freely. Using this method, the action of a resolvase on a Holliday junction was analyzed.9 (Figure 2B). AFM analyses such as these are steps toward real-time observations of single molecules in action. Another powerful adaption could couple AFM with photolysis. Pioneering studies on the GroEL/ES complex.11 have paved the way toward single-molecule biochemistry.

Figure 2 Dynamic motion of DNA in solution captured by fast-scanning AFM. (A) A snapshot of a 3 kbp DNA plasmid. (B) Consecutive AFM images obtained over 30 seconds were overlaid. The data illustrate thermodynamic fluctuations.
Genome organization
One long-standing question to be addressed directly using AFM is how genomes are organized. DNA has various local structures, such as bends, supercoiled regions, single-stranded regions, and stem-loop structures. These structures can be detected by bulk biochemical assays such as chemical or enzymatic treatment followed by agarose gel electrophoresis. However, in terms of “structure”, biochemical analyses are somewhat limited due to their reliance on inherent indirect detection systems. By contrast, AFM has the potential to visualize such structures directly.12,13
Genomic DNA interacts with an assortment of proteins and forms a hierarchical higher-order structure called “chromatin”. AFM has been combined with various biochemical reconstitution techniques, and successfully applied to the elucidation of the initial steps of genome folding (Figure 3). In all eukaryotic cells (except sperm), genomic DNA first interacts with core histones, and forms a “beads-on-a-string” structure; the bead is the fundamental component of chromatin. These beads, called ‘nucleosomes’, have a diameter of 11 nm .14 Initial AFM observations of reconstituted “beads-on-a-string” chromatin fibers were reported in 1993.4 By measuring the difference in contour length of reconstituted “beads-on-a-string” chromatin fibers and DNA used for the reconstitution, it was found that 146 bp DNA wraps around a core histone octamer, which is consistent with data from X-ray crystallography.14 and other AFM observations.15

Figure 3(A1) Chromatin fibers were reconstituted from 186-kb plasmid DNA, core histones, and linker histone H1 and their structures were observed by AFM in air. H1-induced 30 nm fibres were detected.
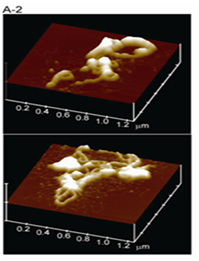
Figure 3(A2) Addition of topoisomerase II to the reconstituted 30-nm fibres induced loop structures.
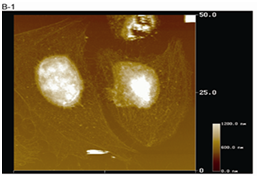
Figure 3(B1) AFM image of HeLa cells depleted of plasma membrane and cytoplasm. HeLa cells on a coverslip were sequentially treated with Buffer A containing 0.5% Triton X-100, Buffer B containing 250 mM (NH4)2SO4, and 10 U/ml DNaseI (B1).
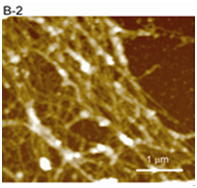
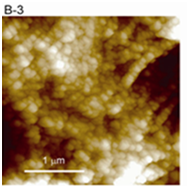
Figure 3(B2,B3) Cytoskeletal fibers (B2) and chromatin fibers (B3) were clearly observed in enlarged images. The interphase chromatin is composed of granular fibers with a width of 78.1 ± 8.1 nm.
Figure 3 AFM images of higher-order structures of chromatin and cytoskeleton.
Linker histone H1 is the best-characterized protein capable of changing the structure of the nucleosomal array. Analyses of chromatin reconstitution and AFM imaging have revealed that the nucleosome-nucleosome distance becomes shorter following the addition of H1, resulting in compaction of the nucleosomes.15-17 In the case of a long nucleosomal array reconstituted on a 100-kb plasmid.15 the formation of 30-nm fibers was promoted by linker histone H1 without the need for other proteins such as histone chaperones (Figure 3).
Type II topoisomerase (Topo II) is a component of the nuclear scaffold and is essential for chromosome condensation during mitosis. AFM analysis has revealed that Topo II induces loop formation in the 30 nm chromatin fiber reconstituted with histone H1.18 (Figure 3). Another nucleosome-binding protein, Poly (ADP-ribose) polymerase1 (PARP-1), is an NAD(+)- dependent enzyme with important roles in the DNA damage response, chromatin remodeling, and apoptosis, to name just a few of its functions. AFM observation of the PARP-1/chromatin complex has indicated that PARP-1 promotes localized compaction of chromatin into supra-nucleosomal structures independent of the amino-terminal tails of the core histones.19 Collectively, AFM-based studies have shown that the complexes of chromatin/Topo II and PARP-1 result from distinct molecular mechanisms.
Chromatin is packed into higher-order structures in nuclei, and the regulation of this packing is critical for transcriptional activity. AFM analysis of chromatin structure inside the nucleus requires the removal of the plasma membrane, cytosol, and nuclear envelope to expose the chromatin. Chromatin fibers can be exposed by treatment with a buffer containing 1 % Triton X-100, followed by a buffer containing 250 mM ammonium sulfate.20 HeLa cells treated this way exhibit 80-nm beaded structures inside the nuclei.21 (Figure 3). A comparison of chromatin structure inside the nuclei of HeLa cells, chicken erythrocytes, and fission yeast cells has lead to the identification of 30-40 nm fibers and 80-100 nm beaded structures as common structural units.22 The current model of the genomic DNA hierarchy includes the step-wise formation of higher-order folding of the genome with different nuclear proteins.12 However, the folding mechanisms beyond 30 nm fibers are still completely open questions.
The structure of condensed chromatin (a mitotic chromosome) has been reported.23,24 but there are many obscure domains, as is the case in the interphase nucleus.21 At present, unfortunately, the overall chromatin structure in the nucleus has not been elucidated due to its complexity, associated with over 5,000 protein species. This is an area that could be developed in the future, but where surprisingly little effort is currently being made.
Muscle contraction and light sensation
Molecular mechanisms of motor proteins and receptors have been the classical targets of physiologists and biophysicists. Cryo-EM and X-ray crystallography have produced much information about static morphology of proteins of interest. However catching morphological changes of such molecules of interest in action has been extremely challenging. Ando’s group addressed these issues by inventing high-speed AFM and contributed enormously to the field.6 They investigated in depth the conformational changes of myosin V walking along actin fibers.25 This work has been a hallmark of modern AFM in biophysics. They also showed the light-sensitive rearrangement of bacteriorhodopsin trimmers.26 Thanks to their contributions, many scientists have joined this field using a combination of biochemistry and high-speed AFM, resulting in an accumulation of excellent studies.7
Ion channels and pumps at work
Another interesting issue is the operational mechanisms of membrane proteins such as ion channels and pumps. The most frequently used technique has been patch-clamping at a single-molecule level with limited morphological knowledge from EM and X-ray crystallography. To gain insight into how a protein’s shape changes during its action, high-speed AFM is proving to be a powerful tool.
If the target protein is abundant in certain tissues (e.g., sarcoplasmic reticulum (SR)), purified membrane (e.g., SR membrane) can be directly used for AFM studies. For example, the behavior of a calcium pump at work (i.e., Ca2+-dependent ATP-hydrolysis) was analyzed with high-speed AFM .27 The P-type ATPases, e.g. Ca2+-ATPase, Na+/K+-ATPase and H+-ATPase, form a super family of membrane-spanning cation transporters (ion pumps) that transport specific cations across the membrane by utilizing the energy obtained from ATP hydrolysis. One of the best-characterized P-type ATPases is the rabbit Sarco(endo)plasmic reticulum (SR) Ca2+-ATPase (SERCA), and its molecular mechanism has been well studied by traditional biochemical experiments and frequently described by the Albers-Post scheme (E1/E2 theory). In the catalytic cycle, the binding of two molecules of Ca2+ to SERCA with high affinity from the cytoplasmic side of the membrane (E1Ca form) triggers autophosphorylation at Asp351 by Mg-ATP (E1P form). Then, after a series of conformational changes, SERCA goes to the de-phosphorylated (E2) and the initial Ca2+ unbound form (E1) in the scheme (Figure 4). The detailed 3D structures of SERCA in many states in the theoretical cycle have been resolved by X-ray crystallography [40-44]. The structural dynamics of the SERCA in the rabbit SR membrane have been successfully captured in the presence of both ATP and free Ca2+ and revealed up-and-down motions and shape changes between taller (compacted) and shorter (open and Y-shaped) forms of SERCA molecules (Figure 4), corresponding to the conformational changes of SERCA during ATP-mediated ion transporting reactions. Interestingly, the number of “up and down” conformational changes of SERCA per unit time was dependent on ATP-concentration, and the motion was strongly inhibited by adding thapsigargin to the buffer solution. One up-and-down motion would correspond to one catalytic cycle (Ca2+-binding shorter conformation à ATP hydrolysis-mediated elevated conformations → Ca2+-binding shorter → conformation), and the number of peaks must correspond to the velocity of the catalytic cycle of SERCA.
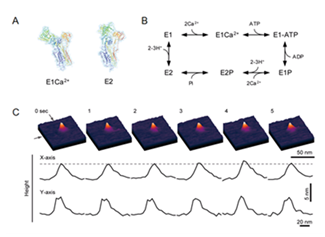
Figure 4 Single-molecule imaging of SERCA1 dynamics in the presence of nucleotides and calcium ions. (A) 3D structures of SERCA1: E1Ca2+ form (left) and E2 form (right). (B) Simplified Albers-Post scheme for SERCA1. (C) Time-lapse sequence AFM images of SERCA1 in the SR membrane on a mica surface in buffer solution were taken in the presence of 10 nM ATP and 100 μM free Ca2+ at a rate of 1 frame per sec. The Z scale is 20 nm. The resulting profiles are shown in the corresponding lower panel. The broken line indicates a height of 5.5 nm from the membrane surface.
If the target protein is not abundant, reconstituted lipid bilayer with proteins purified from expression systems can be used for AFM studies. This is now a standard method for studying ion channels by AFM. Figure 5 illustrates fast-scanning AFM analyses of the heterotetrameric GluN1/GluN2A (NMDA) receptor reconstituted into a lipid bilayer.28 (Figure 5). AFM combined with a specific antibody has revealed two types of height distribution above the bilayer surface in the absence of agonist: the extracellular and intracellular regions of the receptor exhibit heights of 8.6 nm and 3.4 nm, respectively. Fast-scan AFM imaging, combined with UV photolysis of caged glutamate, permitted the detection of a rapid reduction in the height of individual NMDA receptors. The height of the particle above the bilayer before photolysis fluctuated at around 8.2±0.3 nm; after photolysis, the height rapidly fell to 7.2±0.4 nm (Figure 5). The reduction in height did not occur in the absence of glycine or in the presence of the selective NMDA receptor antagonist D-(-)-2-amino-5-phosphonopentanoic acid (D-AP5), indicating that the observed structural change was caused by receptor activation. These results represent the first real-time demonstration of an agonist-induced effect on the structure of the NMDA receptor.
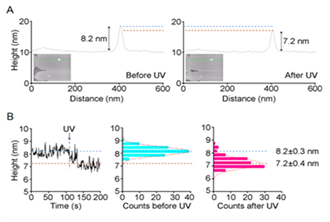
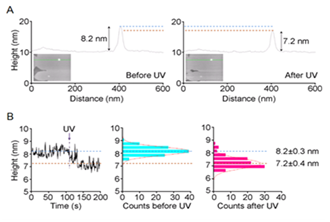
Figure 5 Height shift of NMDA receptor induced by glutamate. (A) Sections through a bilayer-integrated NMDA receptor before and after UV-induced photolysis of caged glutamate. (B) Changes in the receptor height over 200 frames, taken at 1 Hz. A single receptor was monitored in HBS buffer containing 1 μM CaClM2, 100 μM glycine, and 100 μM caged-glutamate. UV irradiation occurred at 107 s. A fitted Gaussian curve is overlaid on each histogram.
Structural changes involved in the activation of neurotransmitter receptors, ion channels and ion pumps have been addressed by various techniques. Among these, X-ray crystallography of proteins in various states has been the most prominent because of its capability to provide atomic scale information. However, fast-scan AFM imaging is perhaps the only technique that allows the visualization of structural changes at the single molecule level under physiological conditions. An extension of this application might shed significant new light on the catalytic motions of ion pumps and the structural rearrangements that occur during the activation and desensitization of receptors and ion channels.
Force measurement and recognition imaging
In addition to molecular imaging capability, AFM has the additional capacity to measure force. Ikai’s group has initiated and further developed the application of AFM to force spectroscopy in biology since the 1990s. He was interested in touching, pushing and pulling a molecule directly, and predicted that AFM can be used as a “carpenter’s tool”. Together with a variety of chemical cross-linking techniques, the force measurement has allowed us to reveal the biophysical basis of specific ligand-receptor interactions as well as the choreographed unfolding pathway of single proteins .29
The key to this force spectroscopy is how the protein of interest should be coupled to the cantilever. To avoid conformational changes by chemical modification or introduction of mutations, a general method has been developed where GST (Glutathione S Transferase) is attached to either the N-terminus or C-terminus of the protein of interest.30 With this innovation, one can attach any GST-fusion protein to a glutathione-coupled cantilever and use it for physiological studies at the molecular level.31
Hinterdorfer and his team have developed recognition imaging using the Topography and Recognition (TREC) mode as a combination of force spectroscopy with imaging.32 AFM with the cantilever on which molecules of interest (e.g. a specific antibody) are specifically attached can be used to simultaneously obtain a topographic image and the position of a specific interaction caused by attractive forces between the specimen and the protein- coupled cantilever. This technique is expected to contribute much to cell biology in the future.
Measurement of stiffness of cells
AFM can also measure the elasticity of living cells.33,34 When an AFM cantilever approaches and pushes against the cell surface, a large indentation in the cell and its surface is usually observed when the probe first contacts the cell surface. This indentation can be plotted against the force of the cantilever and fitted to the Hertz model equation.35 to estimate the Young’s modulus, which describes the elasticity of the sample. Elasticity measurements have shown that both the plasma membrane and the nuclear envelope are “flexible” enough to absorb a large deformation formed by an AFM probe. Penetration of the plasma membrane and the nuclear envelope are possible when a probe with a sharp tip (tip angle of ~25 degrees) deeply indents the cell membrane, causing the membrane to come close to a hard glass surface 36. These types of experiments will provide useful information for the development of single-cell manipulation techniques that are applicable to the evaluation of cell properties under physiological and pathological conditions.
Probing organelle dynamics inside the living cell
Dynamics of the cell membrane and sub-membrane structures are closely linked to carry out various cellular activities. Until recently it has been difficult to investigate the dynamics of these structures in live cells using AFM. Now, however, a high-speed AFM combined with an optical microscopy system has been developed .37 and revealed detailed structural properties of membrane invagination events corresponding to endocytosis and exocytosis in live cells.38 In addition, the movement of mitochondria and the spatiotemporal dynamics of the cortical F-actin network were directly visualized in vivo by AFM from outside the target living cells (Figure 6). Cortical actin micro domains with an average size of 231±69 nm were dynamically rearranged by newly appearing actin filaments, which sometimes accompanied membrane invaginations, suggesting that these events are integrated with the dynamic regulation of sub-membrane organizations maintained by actin turnovers.
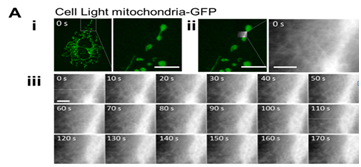
Figure 6A All examples show a fluorescent image of living COS-7 cells expressing Cell Light mitochondria-GFP (i), an overlay of an AFM image on the fluorescent image (ii), sequential AFM images taken at 0.1 fps (iii).
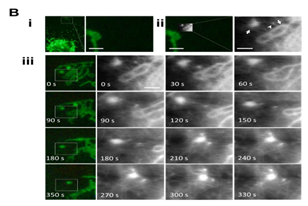
Figure 6B Globular and tubular mitochondria and a small particle in (B-ii) are indicated by arrows and arrowhead, respectively. Scale bars: 8 µm in (A-i), and 1 µm in (B-i) and 1 µm in all the AFM images.

Figure 6C (C) Dynamic rearrangement of F-actin in a sub-membrane actin network. Sequential images show the appearance (white arrowheads) and disappearance (black arrowheads) of filaments, and transient invagination followed by a swollen structure (arrows). The data suggest the dynamic regulation of sub-membrane organizations maintained by actin turnovers.
Figure 6 High Speed AFM/fluorescent images show cytoskeleton and mitochondrial dynamics in living COS-7 cells. An elongated globular (A) and a tubular mitochondrion (B) were continuously observed by high-speed AFM. (C) Represents another COS-7 cell.
Molecular imaging at nanometer scale in a millisecond time range and force measurement at pico-Newton levels are indispensable for elucidating the action mechanisms of biological macromolecules. Techniques and devices of atomic force microscopy (AFM) have been developed over the last two decades and now meet such requirements for studies of genome folding mechanisms and membrane protein dynamics. Especially powerful is the application of high-speed AFM to DNA-protein interactions, capturing the motion of membrane proteins at work, and visual analyses of live cells and intracellular organelles, in combination with various nanotechnologies and inverted fluorescent microscopy.7 This latter innovation may herald the future integration of AFM with other types of imaging platforms that, hopefully, will synergize to yield even more detailed views of biomolecules and nanostructures in action.
None.

©2016 Takeyasu, et al. This is an open access article distributed under the terms of the, which permits unrestricted use, distribution, and build upon your work non-commercially.