Following the work of Alrichs et al.24 on the correction of the Hartree–Fock model, as well as the work of Moorij et al.25 Wu & Yang.26 introduced an empirical interaction term to the first–principles density functional theory in order to simulate the dispersion interaction energy.
This empirical term, given by Eq. (1), is completely independent of the density functional and depends only on the positions of the nuclei.
(1)
For each atom pair separated a distance of
is added to the repulsive density functional potential.26 The coefficient
controls the asymptotic behavior of the attractive term for large internuclear separation.
is a damping function that weakens
for small internuclear separations.24,25 Thus, the damping function is zero for small R, in the region where R<0.2RM, and becomes one for large R, in the region where R>1RM, where RM is the summation of van der Waals radii. As shown in Figure 1, the effects of two different damping functions were examined, damping function I approaching unity much more gradually than damping function II.26
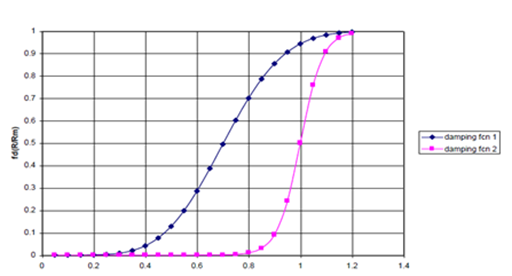
Figure 1a Damping Functions I and II as a Function of Internuclear Separation.
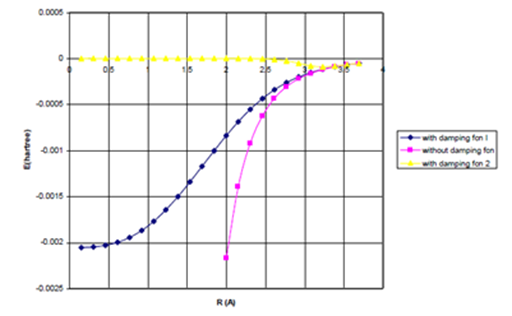
Figure 1b Lennard Jones attractive Energy term as a function of Internuclear Separation for Ne-Ne dimer.
Figure 1 (a). fd(R/RM) I and II as a function of R/ RM, where RM is the summation of van der Waals radii; fdI approaches unity much more rapidly than fdII.
(b) Uattract=- fd (R/ RM)C6/R6 for fdI and II.
For six rare gas systems (He2, Ne2, Ar2, HeNe, HeAr, and NeAr), the repulsive density functional potential, given in Eq. (2).21 was added to the attractive term described above in order to obtain the interaction potential,
, given in Eq. (3).26
(2)
(3)
Binding was obtained in only three systems (Ne2, Ar2, and NeAr) using the B3LYP hybrid density functional while no binding was produced using the BLYP or BPW91 functionals for any of the six systems.26 Figures 2 & 3 illustrate the effect of adding the empirical term to the repulsive density functional potentials with damping function I for Ne2 and He2, respectively. 26
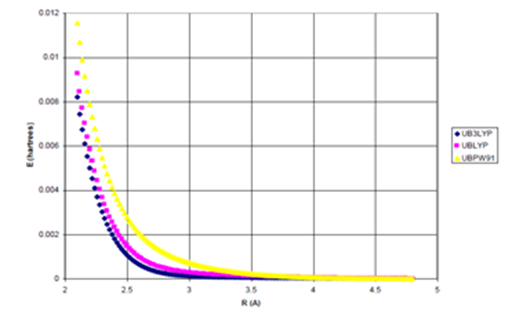
Figure 2a UDFT as a function of Internuclear Separation for Ne Dimer.
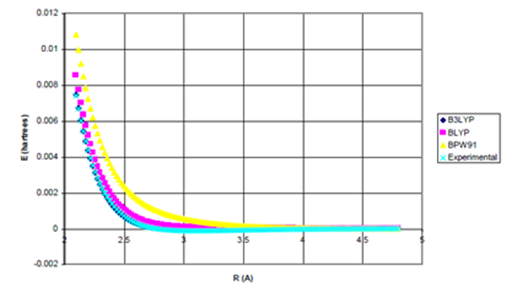
Figure 2b Uinteract=UDFT-fdIC6/R6 for Ne dimer.
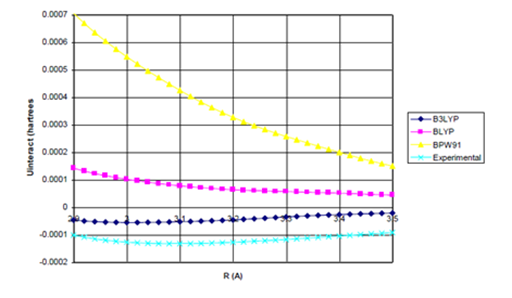
Figure 2c Uinteract=UDFT-fdIC6/R6 (Bonding Region) for Ne dimer.
Figure 2 (a) UDFT as a function of internuclear separation for Ne dimer. All density functional potentials are purely repulsive; (b) Uinteract= UDFT+Uattract as a function of internuclear separation for Ne dimer. Only the B3LYP potential yields binding. De=0.0015eV (experimental*=0.0038eV) Uattract=-fdI(R)C6/R6
(c) Enlargement of bonding region in (b).
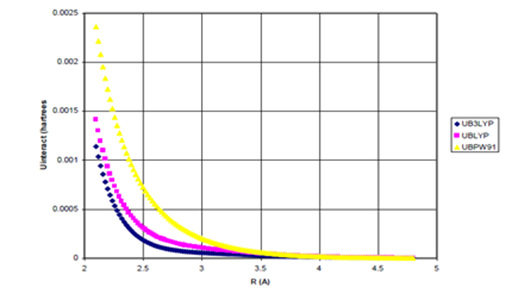
Figure 3a UDFT as a function of internuclear separation for He dimer.
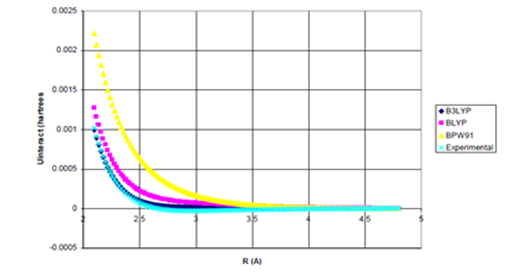
Figure 3b Uinteract=UDFT-fdIC6/R6 for He dimer.
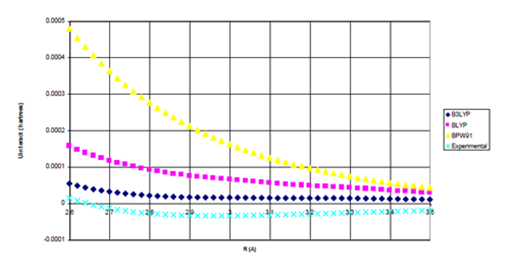
Figure 3c Uinteract=UDFT-fdIC6/R6 for He dimer.
Figure 3 (a) UDFT as a function of internuclear separation for He dimer. All density functional potentials are purely repulsive; (b) Uinteract=UDFT+Uattract as a function of internuclear separation for He dimer. experimental* curve also plotted. None of the density functional potentials yield
binding, Uattract=-fdI(R)C6/R6 (c) Enlargement of bonding region in (b).
For Ne dimer, Figure 2 shows that only the B3LYP functional potential has sufficiently little repulsiveness that binding can occur when the damped attractive term is incorporated.26 However, the addition of the damped attractive term to the more repulsive BLYP and BPW91 functional potentials cannot yield binding. Indeed, as Figure 4 illustrates, even when the full, undamped
attraction, given in Eq. (4), is added to the density functional potentials for Ne2, the more repulsive BLYP and BPW91 functionals cannot produce binding.
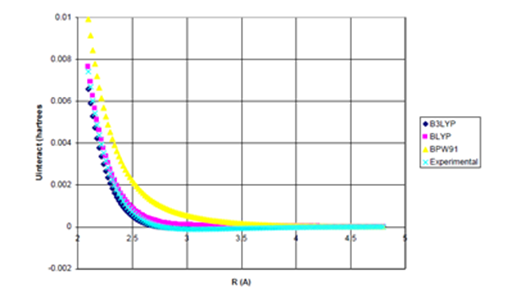
Figure 4a Uinteract=UDFT-C6/R6 for Ne Dimer.
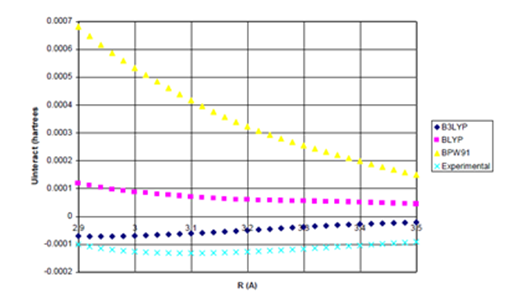
Figure 4b Uinteract=UDFT-C6/R6 for Ne Dimer (Bonding Region).
Figure 4 Uinteract=UDFT+Uattract as a function of internuclear separation for Ne dimer. Even using
the full, undamped attractive potential, only the B3LYP potential yields binding.; De=0.0020eV
(experimental*=0.0038eV) Uattract=-C6/R6, (c) Enlargement of bonding region in (b).
(4)
For the least repulsive B3LYP potential, addition of the undamped
attraction actually gives a slight improvement in the dissociation energy compared to the highly accurate values of Oglivie & Wang.27 (1.5 versus 2.0 compared to 3.5 meV). In the case of He dimer, Figure 3 shows that the B3LYP, BLYP, and BPW91 functionals exhibit potential curves that are so repulsive, the addition of the damped attractive term cannot induce binding. Again, as shown in Figure 5, even when the undamped
attraction is added to these density functional potentials, binding cannot be induced.
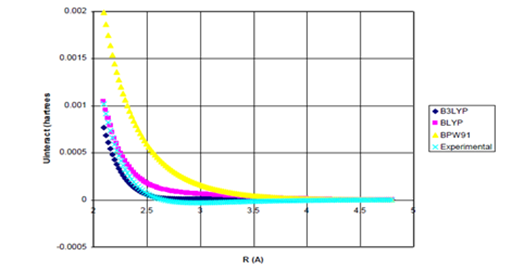
Figure 5a Uinteract=UDFT-C6/R6 for He dimer.
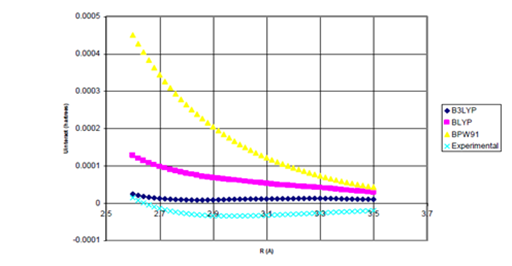
Figure 5b Uinteract=UDFT-C6/R6 for He Dimer
Figure 5 Uinteract=UDFT+Uattract as a function of internuclear separation for He dimer. Even using the full, undamped attractive potential, none of the density functional potentials yield binding. Experimental* potential also plotted. Uattract=-C6/R6, (c) Enlargement of bonding region in (b).
Since the addition of the full, undamped
attraction cannot induce binding for those density functional potentials which are more repulsive than
of Ne dimer.26 and the addition of the undamped
attraction improves the dissociation energy of the bound cases compared to that produced by the damped attractive term, then damping the attractive energy cannot provide a general solution to the problem of simulating dispersive interaction potentials. Two apparent solutions thus present themselves: we may either (a) strengthen the attractive term, or (b) damp the repulsive term.
It is not desirable to damp the repulsive density functional potentials, since the energy lowering would cause a reduction in the force constant and hence frequencies of bound vibrational modes. Indeed, if this energy were damped, the dispersion forces responsible for weak interactions could be introduced only at the expense of the covalent chemistry, the latter of which current density functional methods describe quite well. Therefore, the goal of this work will be to simulate the dispersive interaction potential, typified by the rare gases, through the addition of the density functional potential to a scaled attractive potential. Since the density functional methods studied in the present work are shown to be too repulsive to induce binding, as discussed above, the effect of this scaling will be to strengthen the attractive term.
The point–by–point scaling functions,
necessary to induce binding in Ne and He, given by equations (5) and (6) above, are presented in Figures 6a & 6b for Ne and He dimers, respectively.
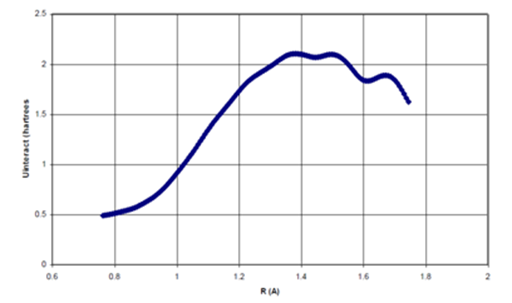
Figure 6a Point-by-point Scaling Function (fs, p-p) as a function of internuclear distance for Ne dimer
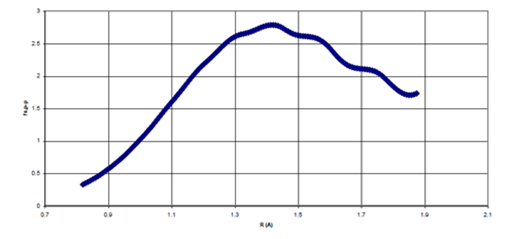
Figure 6b 6b Point-by-Point Scaling Fcn (fs, p-p) as a function of Internuclear Separation for He dimer
Figure 6 (a) The point-by-point scaling function, fsp-p as a function of R/σ for Ne dimer, (b) The point-by-point scaling function, fsp-p as a function of R/σ for He dimer.
For each of the scaling functions, the
attraction is attenuated for
, where is the atomic “hard–sphere” diameter. As the internuclear separation approaches the hard–sphere diameter, the scaling functions gradually rise to unity such that the
term is no longer being attenuated when
. Thus, in this region, the scaling functions behave quite similarly to the damping functions used in previous studies.24–26 However, in the region where
, the scaling functions each become larger than one, such that the
attractive term is being strengthened; yet, purely damping functions cannot account for these effects. Finally, in the limit of infinite internuclear separation, the scaling functions for both Ne and He dimers smoothly decline to unity. Although Ne and He differ by eight electrons, the shape of the scaling functions necessary to induce binding remains roughly constant in these systems.
The oscillatory behavior of the scaling functions at large internuclear separations may be mere artifacts of the size of the grid used for integration. For example, when a smaller pruned (75302) grid was used for numerical integration, more oscillatory behaviour was observed. It seems reasonable that such unphysical behaviour could be eliminated with the use of larger grid sizes. Therefore, these oscillations were ignored when deriving an analytical function that simulates the curvature of the scaling function.
Unlike Gauss’s law, where Coulomb’s inverse square force is at work, the dispersion interaction between two atoms cannot be modeled as point dipoles centered at the nuclei. Indeed, the point–by–point scaling functions,
, necessary to induce binding in Ne and He show that the
attraction between two point charges must be strengthened in order to induce binding, indicating that the interaction distance is shorter than the internuclear distance. This strengthening of the
attraction may be more important than the expansion in higher–order atomic polarizabilities used in traditional treatments.11 Therefore, the potential energy function describing the dispersion interaction between two spherically distributed dipoles must be derived.
First consider the dispersion interaction between a spherically distributed dipole and a point dipole, as depicted in Diagram 1, below.
Here, the point dipole is located a distance τ away from the center of the sphere, and
is the interaction distance between a point on the surface of the sphere, which is described in spherical–polar coordinates
and the point dipole. The potential energy between any point on the surface of the sphere and the point dipole is just the familiar
attraction between two point dipoles. The component of this interaction that contributes to the dispersion attraction between the sphere and the point dipole must be in the direction of the axis adjoining them. However, since the potential energy itself is a scalar quantity, we cannot merely sum up the potential energies from all individual interactions between points on the sphere and the point dipole to obtain the total potential. Rather, we must sum up the electric fields, vector quantities, from all the individual interactions in order that the perpendicular components will cancel. To this end, consider Diagram 1, above. The electric field from the interaction of any point on the sphere’s surface and the point dipole has a magnitude that is the derivative of the potential between two point dipoles, as given by Eq. 7,
(7)
Where
is a proportionality constant between the surface area of a sphere and the
coefficient. Note here that Eq. (7) only holds for a point dipole that is outside the spherically distributed dipole. Eq. 8 gives the interaction distance, between the point on the surface of the sphere and the point dipole
(8)
Note that the only point on the sphere’s surface that will produce an electric field totally in the direction of the axis adjoining the center of the sphere and the point dipole is the one directly in between them, at
. All other points on the sphere’s surface will produce an electric field that has a perpendicular component which does not contribute to the dispersion attraction between the sphere and the point dipole. However, rotating
from 0 to
for any fixed value of sweeps out a circle (outlined in yellow in Diagram 1 above) that is perpendicular to the axis adjoining the centre of the sphere and the point dipole. Due to the cylindrical symmetry, for every point on the circle that produces an electric field given by Eq. (9),
(9)
there exists a second point on the circle that produces an electric field given by Eq. (10), which cancels the component of the field perpendicular to the axis adjoining the sphere’s center and the point dipole.
(10)
Therefore, the average electric field felt by the point dipole from these two points is given by Eq. (11)
(11)
Substituting into Eq. (11) for the cosine of angle as presented in Diagram 1, and for the interaction distance
, gives Eq. (12), below.
(12)
Assuming a hollow sphere with an infinitely thin shell (such that there is no need to integrate radially), the total electric field produced by the entire sphere can be obtained by rotating from 0 to for all values of between 0 and , and is given by Eq. (13), below. Integration was performed with Mathematica.39 The output is appended to this work (Appendix I).
(13)
The potential energy from the interaction between a spherically distributed dipole and a point dipole, then, is the integral of the total electric field with respect to the distance, between the center of the sphere and the point dipole, as given in Eq. (14), below. Again, integration was performed with Mathematica.39 The output is appended to this work (see Appendix I).
(14)
It is important to not that this potential energy function is only valid for a point dipole that is outside of a spherically distributed dipole, and does not apply to the region where
.
In order to derive the potential energy function for the dispersion interaction of two spherically distributed dipoles, let the point dipole of Diagram 1 be a point on the surface of a second sphere, as presented in Diagram 2, below.
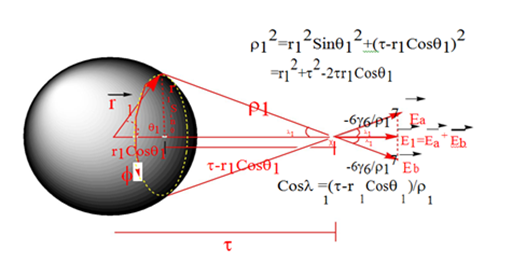
Diagram 1 Dispersion interaction between a spherically distributed dipole and a point dipole.
Here, the internuclear distance is given by R, and the second interaction distance,
is the distance between the center of one sphere and a point on the surface of the second sphere (note that
is the same distance as in Diagram 1). Again, the points on the second sphere are described in spherical, polar coordinates
. From the previous discussion concerning the sphere and the point dipole, it was found that the electric field, labeled
in Diagram 2, felt by any point on the surface of the second sphere due to interaction with the other sphere is given by Eq (13) above.

Diagram 2 Dispersion interaction between two spherically distributed dipoles.
Substituting the second interaction distance for , we have Eq. (15)
(15)
This electric field vector can be written as the sum of two components, one parallel to the internuclear axis and the other perpendicular to it, as given by Eq. (16),
(16)
where
and
are given by Eq. (17) and Eq. (18), respectively.
(17)
(18)
The only component of
the that contributes to the dispersion attraction is the component in the direction of the internuclear axis
. However, rotating
from 0 to
or any fixed value of
sweeps out a circle (outlined in yellow in Diagram 2 above) that is perpendicular to the internuclear axis. As illustrated in Diagram 2, for any point on this circle that produces an electric field,
given by Eq. (16), on the other sphere there exists another point on the circle that produces a field given by Eq. (19), where
and
are given by Eq. (17) and Eq. (18), respectively.
(19)
Thus, the average electric field,
from these two points is given by Eq. (17), above. As shown in Diagram 2, the cosine of angle is given by Eq. (20), below.
(20)
Substituting Eq. (20) in to Eq. (17) for the component of the electric field at any point on the surface of the second sphere contributing to the dispersion interaction, E2 gives Eq. (21), below.
(21)
As before, assuming a hollow sphere with an infinitely thin shell (such that there is no need to integrate radially), the total electric field felt due to the interaction of the two spherically distributed dipoles can be obtained by rotating
from 0 to
for all values of
between 0 and
and is given by Eq. (22), below. Integration was performed with Mathematica.39 The output is appended to this work (see Appendix I).
(22)
Finally, the potential energy from the interaction between two spherically distributed dipoles is the integral of the total electric field with respect to the internuclear distance, R, as given in Eq. (23), below. Again, this attractive potential is not valid when the spheres touch or as they unite. Integration was performed with Mathematica.39 The output is appended to this work (Appendix I).
(23)
This potential energy function, Eq. (23) is written as the sum of two terms, the first involving a simplified deviation from the
attraction of two point–dipoles, and the second containing the error terms arising from this simplification, where δ(r1,r2,R) is given by Eq. (24), below.
(24)
In the case of homonuclear diatomics, like Ne2 and He2, Eq. (23) reduces to Eq. (25), where δ(r,R) is given by Eq. (26)
(25)
(26)
The corresponding scaling function,
for strengthening the
attraction of two point dipoles, is given by Eq. (25), where
is given by Eq. (26)
(27)
The behavior of the second, error term, above, is presented in Figure 7a for Ne dimer. Here, the radius of Ne is taken to be half its hard–sphere diameter.
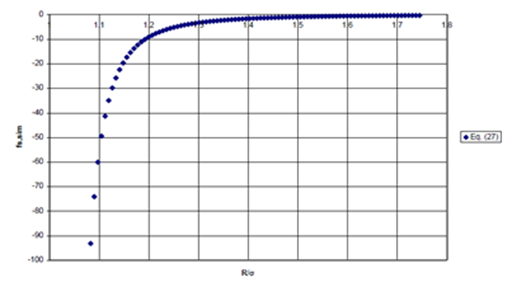
Figure 7a Error_Term of Scaling Function of Eq. (27).
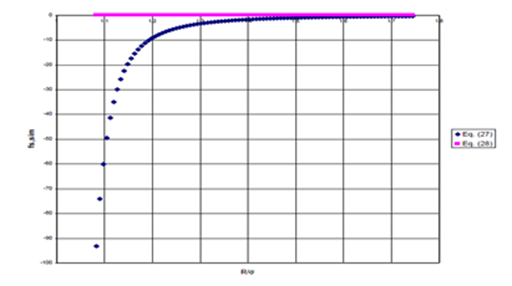
Figure 7bError_Term of Scaling Function of Eq. (27).
Figure 7 (a) Second term (Error Term) of Eq. (27), unphysical divergence as spheres touch; (b) Error term of Eq. (28), preventing unphysical divergence.
Note that the error term approaches negative infinity as the internuclear distance, R, approaches the sum of the radii for the two interacting Ne atoms. However, the potential energy should not diverge when the spheres touch or as they unite. This divergence can be prevented by adding a constant to the denominator of the error term in Eq. (27), to give Eq. (28), again where is given by Eq. (26)
(28)
By increasing the value of the constant, this error term becomes negligible for values of the internuclear distance surrounding the bonding region
as shown in Figure 7b, below.
Therefore, it is reasonable to ignore this second, error term in the scaling function for the interaction of two spherically distributed dipoles. The simplified scaling function is given by Eq. (29), below.
(29)
Note that this simplified scaling function will diverge when the two spheres touch. To prevent this divergence, a constant can be added to the denominator, as shown in Eq. (30)
(30)
By allowing the radius, r to be a multiple (1/n) of
, where is the hard–sphere diameter,
can be parameterized. The radius, r, is then given by Eq. (31)
(31)
The constant, Υ is parameterized by setting fssim at R=σ equal to fsp–p at R=σ and solving Υ as shown in Eq. (32)
(32)
Substituting Eq. (31) for the radius, r, and Eq. (32) for the constant, Υ in Eq. (30), gives Eq. (33), below.
(33)
The Levenberg–Marquardt method.39 of non–linear least squares (please refer to the Fortran code presented in Appendix I) was used to obtain the optimized value for the parameter, n, by fitting Eq. (34), below, for R>σ to the experimental potentials.27 for both He and Ne. These values for n were found to be just above unity, indicating that the optimized radii for He and Ne, as given by Eq. (31), are smaller than their corresponding van der Waals radii, as expected since most of the electron density is contained therein.
(34)
The point–by point scaling functions, simulated scaling functions, as given by Eq. (33), above, and the damping functions employed in previous studies are presented in Figures 8a & 8b for Ne and He dimers, respectively.
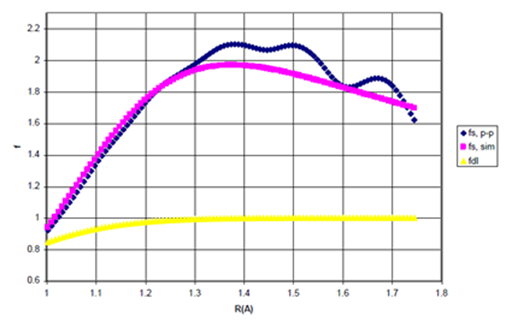
Figure 8a Point-by-Point Scaling fcn (fs,p-p), Simulated Scaling Function (fs,sim), and Damping fcn (fdI) for Ne Dimer
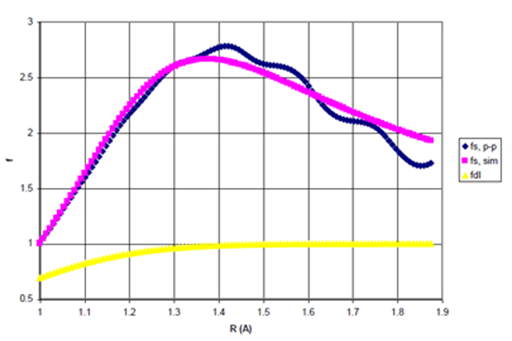
Figure 8b Point-by-Point Scaling Fcn (fs,p-p), Simulated Scaling Fcn (fs,sim), and Damping Function (fdI) for He Dimer
Figure 8 (a) The point-by-point scaling function, fsp-p the simulated scaling function, fssim and Wu and Yang’s damping function I, fdI as functions for R>σ. n=1.35605931.
(b) The point-by-point scaling function, fsp-p the simulated scaling function, fssim and Wu and Yang’s damping function I, fdI as functions for R>σ. n=1.16882509.
Figures 8a & 8b, above, reveal that Ne requires roughly 1.5 times more attraction in the bonding region
in order to induce binding than purely damping functions can provide, while He requires nearly 2 times this amount of attraction. Figures 9 & 10 below, show the interaction potentials obtained using the simulated scaling functions, given by Eq. (33), compared to the experimental.27 interaction potentials for Ne and He, respectively.
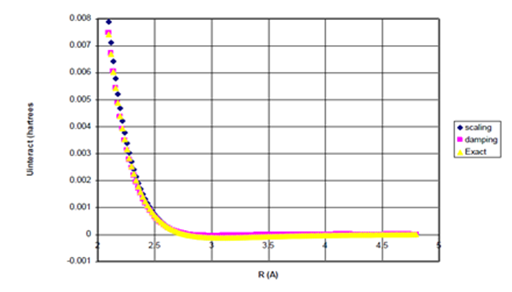
Figure 9a Uinteract=UB3LYP-fC6/R6 for Ne Dimer.
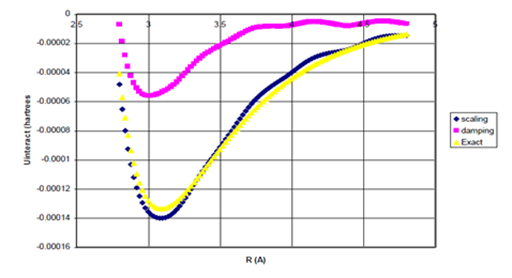
Figure 9b Uinteract=UB3LYP-fC6/R6 for Ne Dimer (Bonding Region).
Figure 9 Uinteract=UB3LYP-fssimC6/R6, Uinteract=UB3LYP-fdIC6/R6 and experimental* potentials for Ne dimer, (b) Enlargement of bonding region in (a) for R>σ. n=1.35605931.
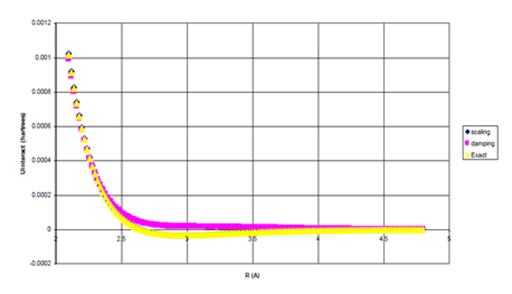
Figure 10a Uinteract=UB3LYP-fC6/R6 for He Dimer.
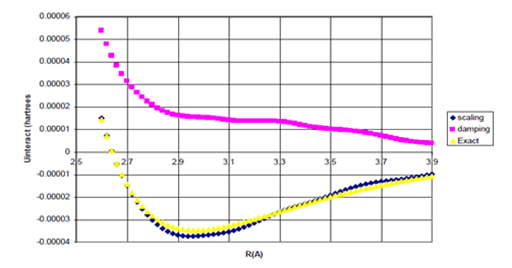
Figure 10b Uinteract=UB3LYP-fC6/R6 for He Dimer (Bonding Region).
Figure 10 Uinteract=UB3LYP-fssimC6/R6, Uinteract=UB3LYP-fdIC6/R6, and experimental* potentials for He dimer, (b) Enlargement of bonding region in (a) for R>σ. n=1.16882509.
The equilibrium internuclear distances and dissociation energies obtained using the simulated scaling function, Wu and Yang’s damping function I, and the experimental.27 values are summarized in Table 1 below.
| |
|
Re (A)
|
De (kcal/mol)
|
% Error in Re
|
% Error in De
|
|
Ne
|
Scaling attraction
|
3.08
|
0.003815
|
0.3
|
0.4
|
|
Damping attraction
|
3.00
|
0.0015
|
2.9
|
60.5
|
|
Experimental
|
3.09
|
0.0038
|
|
|
|
He
|
Scaling attraction
|
2.96
|
0.001019
|
0.0
|
7.8
|
|
Damping attraction
|
No Binding
|
No Binding
|
No Binding
|
No Binding
|
|
Experimental
|
2.96
|
0.000945
|
|
|
Table 1 Equilibrium geometry, Re and dissociation energy, De values obtained from addition of the scaled attractive potential to the repulsive B3LYP density functional potential for Ne and He dimers, according to the equation:
(Figures 9 &10 for graphs).
Although the dissociation energies obtained using the simulated scaling functions for Ne and He dimers are 0.4% (+0.000015 kcal/mol error) and 8% (+0.000074 kcal/mol error) in error, respectively, the dissociation energy of Ne dimer obtained with Wu and Yang’s damping function I is over 60% in error and this damping function cannot give binding for He dimer at all. The equilibrium geometries for Ne and He dimers obtained using the simulated scaling function are within 0.3% (10 mA) of the experimental bond lengths. Therefore, a scaling function of the type presented in Eq. (33) shows promise for improving interaction potentials compared to those obtained using a purely damping function for the B3LYP density functional method.
Although use of the simulated scaling function given in Eq. (33) has been shown to give significantly improved dissociation energies and equilibrium bond lengths (Table 1) compared to the use of a purely repulsive damping function, it is important to note that the model used to derive it not completely general. For example, while the optimized radii for He and Ne dimers are less than their respective van der Waals radii, as is expected since most of the electron density is contained therein, the optimized value of the radius for He, 1.095 A (n=1.16882509), is greater than that of Ne, 1.0136 A (n=1.35605931). Despite this discrepancy, however, the simplicity of the model presented herein affords field and potential integrals that are analytically tractable, and do provide improved dispersion potentials compared to experiment.27
If the shape of the scaling function required to give binding is invariant to differing atom–atom pairs, as is suggested by the systems studied here, then it seems reasonable that an attractive scaling function like that presented in Eq. (33) could be useful for extending these ideas to other systems. In general, however, the exact interaction potentials are only known for the most trivial of chemical systems and since the potential energy function derived in this work must be fit to a known potential, its predictive value is compromised. The potential energy function derived herein is the solution to the six–dimensional volume integral over electron densities, as presented in Eq. (35),
(35)
for the simplified case in which the electron density, is distributed over the surface of a sphere. Here,
is the electric polarization response of the electron density at position i to an applied electric field, such that the atomic polarizability is given as Eq. (36),
(36)
and the
term is defined by Eq. (37)
(37)
The next logical step towards extending these concepts to a complete, predictive theory is to solve the six–dimensional volume integral over electron densities for the general case where is the electron density of an atom or molecular fragment.40 Andersson et al.41 have recently shown that the long range
attractive potential becomes Eq. (38),
(38)
where the electron densities,
have been extracted from Hartree–Fock wave functions with Slater basis sets, and leads to the calculation of significantly improved C6 coefficients.41 The results of the simplified case presented in this work, in which the electron density is distributed over the surface of a sphere, indicate that the strengthening of the
dispersion potential may be achieved by including the
separation term in the integrand, in accord with Eq. (35). Thus, further studies toward this end are worthwhile.


