Journal of
eISSN: 2377-4282


Research Article Volume 4 Issue 4
1Departamento de Ciencias Biologicas e da Saude, Universidade Federal do Amapa, Brazil
2Departamento de Farmacia, Universidad Nacional Autonoma de Mexico, Mexico
Correspondence: Jose Carlos Tavares Carvalho, Departamento de Ciencias Biologicas e da Saude, Universidade Federal do Amapa, Laboratorio de Pesquisa em Farmacos, Curso de Farmacia, Rodovia Juscelino Kubitscheck, km 02, CEP 68902-280, Macapa, Amapa, Brazil
Received: November 17, 2016 | Published: December 7, 2016
Citation: Souza GC, Duarte JL, Fernandes CP, Moyado JAV, Navarrete A, et al. (2016) Obtainment and Study of the Toxicity of Perillyl Alcohol Nanoemulsion on Zebrafish (Danio rerio). J Nanomed Res 4(4): 00093. DOI: DOI: 10.15406/jnmr.2016.04.00093
Introduction: Perillyl alcohol (POH) is a hydroxylated monocyclic monoterpene found in lemon and lavender essential oils, among others. It’s widely recognized by antitumoral activity. Despite the great potential of nanoformulations for pharmaceutics, to the date the obtainment a perillyl alcohol–nanoemulsion (NPOH) and its toxicity investigation were not previously reported. On this context, the present study aim to evaluate the toxicity of NPOH on zebrafish (Danio rerio). Lethal concentration (LC50), effects on behaviour and acute administrations effects (48h) on histopathological parameters of the gills, liver and kidneys were performed.
Results: Exposure to different concentrations of NPOH (25, 35, 50 e 125 µg/L – expressed as POH content) allowed determination of LC50= 33.4 µg/L. Moreover, NPOH at 50 and 125 µg/L induced 100% of mortality, in addition the alterations of behavior. NPOH at 25 and 35 µg/L induced higher damage to gills tissue when compared to remaining concentrations and control group (surfactant at 125 µg/L) (p < 0.001, p < 0.01 and p < 0.05, Anova, Tukey–Kramer test). NPOH at 25, 35 e 50 µg/L induced significative damage to liver tissue, when compared to control (p < 0.01 and p < 0.05). No significant histopathological alterations were observed in kidneys. Thus, our results suggest that NPOH present toxicity pattern in accordance to nanoformulations and xenobiotics.
Keywords: danio rerio, perillyl alcohol, nanoemulsion, toxicity, histopathology
Toxicity is a relative property of a chemical substance that refers to its potential damage to living organisms; it is being related to its concentration and the exposure time.1 The expression of toxicity of a chemical substance depends on exposure characteristics and its behaviour on the organism, associated to transport mechanisms and interaction with target–site and tissues. Thus, toxicity only occurs if the agent is able to reach specific targets at sufficient concentrations in order to induce some effects.2
Danio rerio has been considered a potential model for several human diseases.3,4 Toxicity determination is a critical step for the development of new pharmaceuticals, considering that toxicity has a high impact of clinical trials. Adults and embryos of D. rerio are both used for general and specific tissue toxicity studies.5–7 Rubinstein et al.8 suggest that evaluation of drug toxicity using D. rerio should be included in pre–clinical studies. Based on this context, the application of this model have been increased in the last years, in both phases embryonic and adult many studies, have shown significative alterations of animal development, behavioural and histological aspects.
Histology is considered an important method to diagnose direct and indirect effects that affect animal tissues. Its combination with other analysis allows a better comprehension of several conditions, it is crucial to define target organs in order to obtain relevant results.9
According to Lins et al.10 the main organs affected by the toxic agents are gills, liver and kidneys, this is also useful to indicate alterations induced by chronic exposure to these agents. Liver and kidneys are associated to the metabolism and excretion of xenobiotics. Most of D. rerio model tested nanoformulations which are metal–based (iron, copper, titanium dioxide), indicating the need to increase toxicological studies of other nanoformulations, including those with natural products.11,12 The evaluation of the toxicity of these nanoformulations is extremely important for human health, since its reach to organs in the body is facilitated by its small size, and several studies have shown that nanoparticles can to reach the brain and cause tissue damage.13,14
Limonene is a monocyclic monoterpene that is found in citric fruits, mainly lemon and orange. This low toxic compound has chemo preventive and chemotherapeutic activities against several tumor cell lines, due to its ability to inhibit post–traumatic isoprenylation of GTPase, including Ras family members.15–17 The high dose of limonene required for the beneficial effects have limited their use. For this reason, other mono terpenes began to be investigated, especially its metabolites perillyl alcohol (POH) and perillyl acid (PA).
The POH is isoprenylation inhibitor of Ras protein, act in the control of cell proliferation, in the activation of post apoptotic pathways, and blocking the cell cycle of different tumor cells in vitro.16,18–20 The POH is also found in many essential oils, such as lemon, lavender, spearmint, sage, celery seed, bergamot, ginger and cherry. It has potent antitumor activity, acting in the regression of different tumours, including breast, pancreatic and brain.21–23 It also presents radiosensibilizing effects and significant angiogenic inhibition.24,25 It has already been described several antitumor activities for POH and its ability to block the cell cycle and cause apoptosis in leukemic cells, lung tumor, adenocarcinoma, activate apoptotic proteins, inhibit metastasis in glial cells, inhibit proliferation of lung cancer cells, inhibit migration and proliferation of breast tumor cells.18,20,21,26–31
In a recent study, Salazar et al.32 reported that intranasal administration of 80 μg of POH per day, activates the immune system and no clinical signs of the recurrent gliomas, such as weight loss, convulsions, and diarrheal were observed, and when performing morphological analysis of tissue found that there were no changes in the tissues. Thus, considering previous non–clinical and clinical data of POH, the aim of the present study was to evaluate acute toxicological effects of its nanoemulsion (NPOH) on Danio rerio.
This study was approved by the Ethics Committee for Animal Experimentation of Amapá Federal University (Brazil) under the register number 005/2014.
Perillyl alcohol nanoemulsion (NPOH)
Nano–emulsification method: It was used low energy method for obtainment the nanoemulsions with some modifications.33 Oil phase was constituted by POH and surfactants, while aqueous phase was constituted by deionized water. Oil phase was submitted to magnetic stirring (400 rpm) for 30 min. After this period, aqueous phase was added drop–wise and system was stirred for 60 min. Each nanoemulsion has a final mass of 50g and was constituted by 5% (w/w) of POH, 5% (w/w) of surfactants and 90% (w/w) of water.
Surfactants ratio optimization: Different surfactants ratio was prepared in order to obtain specific Hydrophile–Lipophile Balance values (HLB). Sorbitan monooleate (most hydrophobic, HLB = 4.3) and polysorbate 80 (most hydrophilic, HLB = 15) were employed and three different HLB values were obtained as follows: HLB 7 (3.74% of sorbitan monooleate and 1.26% of polysorbate 80); HLB 8 (3.28% of sorbitan monooleate and 1.72% of polysorbate 80); HLB 9 (2.8% of sorbitan monooleate and 2.2% of polysorbate 80). Total surfactant amount corresponded to 5% (w/w) of each nanoemulsion.
Nanoemulsion characterization: Droplet size and Polydispersity index of the nanoemulsions (NPOH) was determined by photon correlation spectroscopy (Zetasizer ZS, Malvern, UK). Nanoemulsions were diluted with water for injection (1:25). Measurements were made by triplicate and average droplet size was expressed as the mean diameter±
Animals
D rerio were purchased from Aqua New Aquários e Peixes Ltda. ME (PE, Brazil), according to authorization nº 526140011289802 (7 May 2014) under register number nº 82957 obtained from Brazilian Institute of Environment and Renewable Natural Resources – IBAMA.
Evaluation of behavioural parameters under normal conditions
Total of 90 animals were used for behavioural and histological analysis. The experiments were performed with adults (12–14 months age). D. rerio were maintained under controlled conditions (26 ± 10ºC and 10:14 light: dark cycle). Normalized water was employed.34 CaCl2 x 2H2O (117.6 mg/L), MgSO4 x 7H2O (49.3 mg/L), NaHCO3 (25.9 mg/L) and KCl (2.3 mg/L) (Sigma Aldrich Co.) were added to deionized water. They were fed with commercial food twice by day.
Determination of LC50
D rerio were deprived for 24 h with food before the experiment, since nanoemulsion could be adhered to food and faeces, this characteristic minimizes the fluctuations of the NPOH exposure.35 NPOH was diluted on aqueous media (25, 35, 50, 125 µg/L of NPOH, expressed as POH content), which was placed on 1 L beakers in order to determine LC50, the control group only contains the surfactants (125 µg/L) and the blank group (without NPOH nor surfactants. All the experiments were performed by triplicate and 15 animals were used for each exposure concentration. Animals were kept in contact with NPOH aqueous dispersion for 48 h, being observed behaviour and mortality at this period.
Evaluation of behavioural parameters after treatment with NPOH
Once the D rerio were exposed to different levels of NPOH for 48h the behaviour were analyzed as follows:
Three replicates of 15 individuals were used for each experiment. The animal behaviour was recorded by a human observer at times 0, 3, 6, 12, 24, 27, 30 and 48h.
Assessment of mortality
Mortality was continuously monitored and fishes were considered dead when opercular movements and response to mechanical stimulus were not detected. After the end of experiment, remaining animals were submitted to euthanasia in cold water 4oC.
Evaluation of histological parameters
Organs (gills, liver and kidneys) were fixed in Bowin´s solution for 24 h. After this period, fins were removed and tails were sectioned from the anus to the posterior part of dorsal fin. Thus, material was decalcified in 7% EDTA solution for 48 h and then embedded in paraffin (Inlab Co.). Material was stained with HE (Harris hematoxylin from Laborclin and eosin–Inlab Co.). Analysis of organs was performed using optical microscopy (Olympus–micronal BX41) and photographs were obtained using DCE–5C USB 2.0 digital camera and Scanning Electron Microscopy (microscope Hitachi TM3030PLUS).
They were classified according to their gravity and occurrence, allowing determination of Mean Assessment Values (MAV) described by Schwaiger et al.36 and HAI (Histological Alteration Index) based on method described by Poleksic & Mitrovic–Tutundzic.37 Histopathological parameters are show in Tables 1–3.
|
Histological Alterations |
Stage |
|
a) Hypertrophy and hyperplasia of respiratory tissue |
|
|
Hypertrophy of epithelial cells |
I |
|
Thinning of epithelium |
I |
|
Displacement or lifting up of epithelial cells |
I |
|
Epithelial rupture |
II |
|
Hyperplasia of epithelial cells at the basis of secondary lamellae |
I |
|
Hyperplasia of epithelial cells on secondary lamellae |
I |
|
Fusion of secondary lamellae |
I |
|
Complete fusion of some secondary lamellae |
I |
|
Complete fusion of all secondary lamellae |
II |
|
Cellular degeneration |
II |
|
Epithelial leukocyte infiltration |
I |
|
b) Alterations on mucous and chloride cells |
|
|
Hypertrophy and/or hyperplasia of mucous cells |
I |
|
Presence of mucous cells on secondary lamellae |
I |
|
Hypertrophy and/or hyperplasia of chloride cells |
I |
|
Presence of chloride cells on secondary lamellae |
I |
|
c) Alterations on lamellar blood vessels |
|
|
Dilatation of capillaries |
I |
|
Capillary disarrangement |
I |
|
Vascular congestion |
I |
|
Rupture of capillaries with hemorrhage |
I |
|
Lamellar aneurism |
II |
|
d) Terminal stage |
|
|
Fibrosis |
III |
|
Necrosis |
III |
|
e) Gills parasites |
|
|
Presence of parasites |
I |
Table 1 Histological alterations considered for analysis of gills of D. rerio exposed to different concentrations of NPOH.
Stage considered for each alteration indicated in the second column according to Poleksic & Mitrovic-Tutundzic 37.
|
Histological Alterations |
Stage |
|
a) Alterations on hepatocytes |
|
|
Hepatic cordon disarrangement |
I |
|
Outline cell loss or atypia |
I |
|
Outline nuclear loss or atypia |
I |
|
Increase in cell volume |
I |
|
Nuclear atrophy |
II |
|
Intense cytoplasmic vacuolation |
I |
|
Nuclear vacuolation |
II |
|
Decrease in the relative frequency of nuclei |
I |
|
Cytoplasmic degeneration |
II |
|
Nuclear degeneration |
II |
|
Cellular disruption |
II |
|
Glycogen reduction |
I |
|
Biliary stagnation |
I |
|
b) Alterations on blood vessels |
|
|
Increase in the relative frequency of blood vessels |
I |
|
Hyperemia |
II |
|
Disruption of blood vessels |
II |
|
Increase on relative volume of blood vessels |
I |
|
c) Alterations on biliary |
|
|
Degeneration of the bile canaliculi |
II |
|
d) Terminal stage |
|
|
Necrosis |
III |
Table 2 Histological alterations considered for analysis of liver of D. rerio exposed to different concentrations of NPOH.
Stage considered for each alteration is indicated in the second column according to Rigolin-Sá 47.
|
Histological Alterations |
Stage |
|
a) Alterations on lymphoid tissue |
|
|
Loss of cellular outline or atypical cellular outline |
I |
|
b) Alterations on glomerulus and renal tubules |
|
|
Low degeneration of tubular hyaline |
I |
|
Severe degeneration on tubular hyaline |
II |
|
Hypertrophy of tubular cells |
I |
|
Tubular disorganization |
I |
|
Glomerular disorganization |
I |
|
Tubular degeneration |
II |
|
Glomerular degeneration |
II |
|
Increase on Bowman´s capsule space |
I |
|
Decrease on Bowman´s capsule space |
I |
|
Dilatation of glomerular capillaries |
I |
|
Cytoplasmic degeneration of tubular cells |
II |
|
Nuclear degeneration of tubular cells |
II |
|
Presence of regenerated tubules or “new” nephrons |
I |
|
Presence of several granules PAS positive on tubular epithelium |
I |
|
Tubular obstruction |
I |
|
Increase in tubular lumen |
I |
|
Presence of lymphoid tissue on Bowman´s capsule |
II |
|
Decrease in the relative frequency of glomerulus |
I |
|
c) Alterations on blood vessels |
|
|
Dilation of blood vessels |
I |
|
Hyperemia |
II |
|
Rupture of blood vessels |
II |
|
d) Terminal stage |
|
|
Necrosis |
III |
Probit analysis was employed using the Software GraphPad Prism version 5.0 with 95% confidence interval for LC50 determination. The results were expressed as mean ± SD and the histopathologicals data were analyses using one way ANOVA followed by Tukey–Kramer test for comparison between treated and control group and results with p < 0.05, p < 0.01 and p < 0.001 were considered statistically significant.
Three nanoemulsions were obtained by preparing different blends of non–ionic surfactants (sorbitan monooleate and polysorbate 80) in order to achieve different values of HLB (7, 8 and 9). Macroscopic observation indicated that all formulations presented translucent appearance and bluish reflect, in addition mean diameter below 200 nm measured using photon correlation spectroscopy. These characteristics are in accordance to the concept of nanoemulsions, kinetically dispersed systems of small droplets (20–200 nm) containing two immiscible liquids and often stabilized by one or more surfactants.38 Moreover, they presented low Polydispersity index and almost monomodal size distribution. This high homogeneity of particle size is desirable for stable nanoformulations.39 HLB is a semi empirical scale to classify surfactants based on its hydrophile/Lypophile nature.40 Smaller droplet size and most stable system are achieved when required HLB (rHLB) value of oily phase coincides with HLB value of surfactant(s) used in the emulsification. So establish the accurate HLB of pharmaceutical oils is a critical step for the abstention of small droplet emulsions, including nanoemulsions.41 Smallest droplet size was achieved with nanoemulsion at HLB 9, therefore suggesting that this is the rHLB value of POH. We chose the nanoemulsion constituted by 2.8% of sorbitan monooleate, 2.2% of polysorbate 80, 5.0% of POH and 90.0% of water for acute toxicological evaluation. Size distribution with mean droplet size and Polydispersity index values of three POH based nanoemulsions are presented in Figure 1.
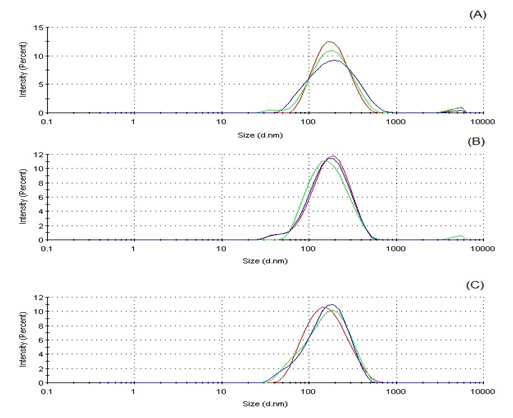
Figure 1 Size distribution for nanoemulsions prepared with POH. Mean droplet size at: HLB 7 (A): 164.8 ± 1.3 nm; HLB 8 (B): 149.7 ± 1.1 nm; HLB 9 (C): 136.7 ± 0.5 nm. Polydispersity index at: HLB 7 (A): 0.242 ± 0.006; HLB 8 (B): 0.215 ± 0.011; HLB 9 (C): 0.225 ± 0.003.
Exposure of D. rerio to different concentrations of NPOH induced several alterations, and they were classified according to stages I, II e III (Table 4). Ribeiro.42 expressed behavioural alterations of D. rerio according to stages I, II and III after exposure of these animals to ethanolic extract of Spilanthes acmella. It was observed that these alterations start with increasing excitability of the animal and culminates with loss of posture, animal deposition in the base of the beaker and death.
|
Time |
25 µg/L of NPOH |
35 µg/L of NPOH |
50 µg/L of NPOH |
125µg/L of NPOH |
125µg/L of Surfactants |
|
|
Stage I |
0’ |
1 and 2 |
1 |
1 and 2 |
1 and 2 |
1 |
|
Stage II |
0’ |
2 |
2 |
1 and 2 |
1 and 2 |
|
|
Stage III |
0' |
1 and 2 |
1 and 2 |
1 and 2 |
1, 2 and 3 |
|
|
Stage I |
3h |
2 |
||||
|
Stage II |
3h |
2 |
2 |
2 |
||
|
Stage III |
3h |
1 and 2 |
1 and 2 |
1, 2 and 3 |
||
|
Stage I |
9h |
|||||
|
Stage II |
9h |
2 |
2 |
|||
|
Stage III |
9h |
1 and 2 |
1 and 2 |
|||
|
Stage I |
24h |
|||||
|
Stage II |
24h |
1 and 2 |
2 |
|||
|
Stage III |
24h |
3 |
1 and 2 |
|||
|
Stage I |
27h |
|||||
|
Stage II |
27h |
2 |
2 |
|||
|
Stage III |
27h |
2 |
1 and 2 |
|||
|
Stage I |
33h |
|||||
|
Stage II |
33h |
2 |
||||
|
Stage III |
33h |
1, 2 and 3 |
||||
|
Stage I |
48h |
|||||
|
Stage II |
48h |
2 |
||||
|
Stage III |
48h |
1, 2 and 3 |
Table 4 Behavioral alterations after treatment with different concentrations of POH and control group on D. rerio at different observation time.
Stage I: 1) increase swimming activity, 2) tail tremors; Stage II: 1) Circular swimming movement, 2) loss of posture; Stage III: 1) Loss of motility; 2) Animal deposition in the base of the beaker, 3) Death.
The behaviour of the animals was recorded every hour for two minutes. Toxic action of NPOH was relatively higher, being observed stress signals just after wards exposure. Higher concentration of NPOH ≥ 50 µg/L induced following signals: increase swimming activity, followed by loss of posture, loss of motility, superficial respiration and animal deposition in the base of the beaker, until opercular movements were not observed indicating death (4 minutes after exposure).
At exposure concentrations of 25 µg/L and 35 µg/L of NPOH, the alterations were related to stages II and III. After 33 h of exposure, it was not observed behavioural alterations on animals exposed to 25 µg/L of NPOH. No behavioural alterations were observed for animals exposed to 125 µg/L of surfactants (HLB 9).
Swimming activity is among the behavioural changes the most important, because it is an indicator that integrates the internal status of the animal.43 According Schreck et al.44 the exposure of fish to a stressful situation, carries in his first defence mechanism, which most often, is the escape behaviour in an attempt to decrease the likelihood of death, or can occur a behaviour economy metabolic cost to maintain physiological homeostasis.
Table 5 shows percentage of death animals after exposure to different concentrations of NPOH. These results indicate increasing susceptibility of D. rerio to different concentrations, being observed that 100% of mortality was achieved at higher concentrations (> 50 µg/L). According to Bilberg et al.45 increasing concentrations of nanoformulations induce higher mortality levels. No mortality was observed in the group treated with 125 µg/L of surfactants, indicating the lethal effects were induced by POH nanoemulsified.
|
Concentration |
0,0µg/L |
25µg/L |
35µg/L |
50µg/L |
125µg/L |
125µg/L of Surfactants |
|
Number of death animals |
0 |
1 |
8 |
15 |
15 |
0 |
|
Percentage |
0% |
6% |
53% |
100% |
100% |
0% |
Table 5 Number and percentage of dead animals after treatments with different concentrations of NPOH on D. rerio (n = 15 animals/group).
Plotting exposure concentrations (25, 35 and 50 µg/L) versus mortality levels it was possible to determine lethal concentration (CL50–48hs) at 34.3 µg/L. Concentrations of 50 and 125 µg/L induced 100% of mortality. Chae et al..46 evaluated toxicity induced by silver nanoparticles during 96h and found LC50 value of 34.6 μg/L, being similar to value found in the present study for NPOH (Figure 2). D. rerio has four branchial, as described for teleost fish, each containing two filament rows that have secondary lamellae. Figure 3 shows normal gill filament of D. rerio. Gills are characterized as potential absorption sites for substances in aqueous media, due to high surface area, small diffusion distance and high counter–current flow between water and blood.2
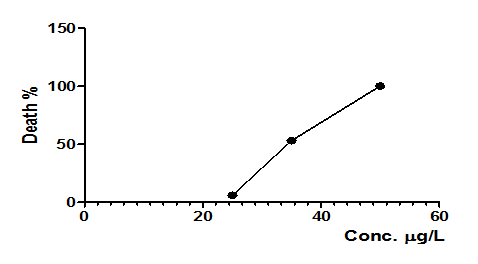
Figure 2 Effects of administration of differents NPOH concentrations (25µg/L, 35µg/L, 50µg/L and 125µg/L) on zebrafish. n = 15 animals/group, LC50(48h) = 34.3µg/L.
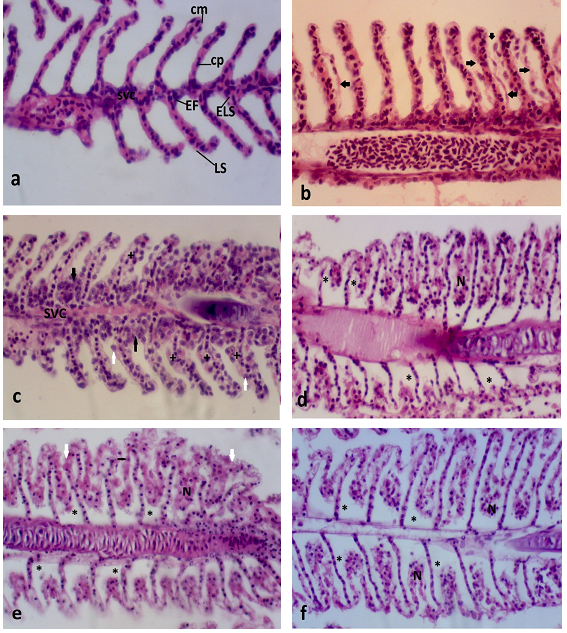
Figure 3 a) Normal gill filament on longitudinal histological sectionof D. rerio. cm–marginal channel; cp–pillar cells; EF– filament stratified epithelium; ELS – secondary lamellar squamous epithelium; LS –secondary lamelae, SVC–central venous sinus; b) Gill filament on longitudinal section of D. rerio exposed to 125µg/Lof surfactants. Detachment of lamellar respiratory epithelium (indicated by arrows); c) Gill filament on longitudinal section of D. rerio exposed to 125µg/L of NPOH. Hypertrophy of epithelial cells (+), hyperplasia of epithelial cells at the basis of secondary lamellae (black arrows) and presence of chloride cells (white arrows). Detail of central venous sinus (SVC); d) Gill filament on longitudinal section ofD. rerio exposed to 50µg/L of NPOH. Displacement of respiratory epithelium (*) and necrosis of respiratory epithelial cells (N); e) Gill filament on longitudinal section ofD. rerio exposed to 35µg/L of NPOH. Displacement of lamellar epithelium cells (*), Mucus secretion (white arrows), degeneration of lamellar epithelium cells (black arrows) and necrosis (N); f) Gill filament on longitudinal section ofD. rerio exposed to 25µg/L of NPOH. Total displacement of respiratory epithelium (*) and necrosis of respiratory epithelium cells (N). (HE, 5 μm).
Most frequent alterations on gills of D. rerio are presented in Table 6. First stage alterations were as follow: hypertrophy of epithelial cells (Figure 3) hyperplasia of epithelial cells (Figure 3), chloride cells on secondary lamellae and dilatation of capillaries. Rigolin–Sá.47 reported that hypertrophy of respiratory epithelium, hyperplasia and other alterations are gill defence mechanisms, promoting increase of water and blood barrier, which reduces and even prevents water flow between secondary lamellae. Further loss of respiratory surface or fusion of lamellae may induce mortality of the animals.1,48 Partial fusion of secondary lamellae will occur if hyperplasia be restricted at the basis ou portion of lamellae, as it was observed with frequency at concentrations of 35 and 50 µg/L of NPOH. However, if hyperplasia occurs through the filaments, total fusion will be observed, considering that hyperplasic cells will fill all interlamellar space. In extreme cases of hyperplasia the lamellae fusion can occur across the gill filament, a situation not observed in any of exposure concentrations.49
|
Replicate |
Blank |
125µg/L of Surfactants |
25µg/L of NPOH |
35µg/L of NPOH |
50µg/L of NPOH |
125µg/L of NPOH |
|
1 |
0 |
8.8 |
53.8 |
44.6 |
28.4 |
10.9 |
|
2 |
0 |
4.6 |
54.2 |
30.8 |
28.6 |
20.6 |
|
3 |
0 |
4 |
54.2 |
26.6 |
28.8 |
19.4 |
|
Mean ± SD |
0.0 ± 0.0 |
5.8 ± 1.51 |
54 ± 3.05 |
34,6 ± 0.11 |
28.6 ± 5.43 |
16.9 ± 0.13 |
Table 6 Mean of Histological Alteration Index (HAI) of D. rerio gills after exposure do different concentrations of NPOH in triplicate (n=15 animals/group).
Total displacement of epithelium on secondary lamellae was observed with greater intensity on animals exposed to concentrations of 25, 35 and 50 µg/L of NPOH (Figures 3 & 4), being considered one of former alterations observed on gills of fishes exposed to toxic agents.50–52 According to Meletti49 mucous cells and chloride cells may become hyperplasic and/or hypertrophic due to toxic agents in water. Presence of chloride cells and mucous cells on fishes exposed to NPOH and surfactants occurred in all groups. However, smaller proportion of this alteration was observed on group treated with 125 µg/L of surfactant (Table 6).
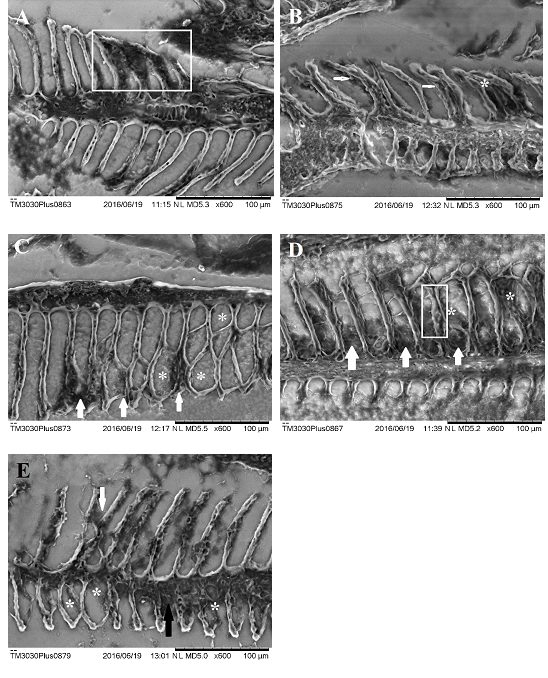
Figure 4 Scanning electron microscopy of the gills of Danio rerio (zebrafish). A) Filament Branchial of Danio rerio exposed to concentration of 125μg/L of surfactant. Observe hypertrophy of the epithelial cells (white marked area). B) Gill filament of Danio rerio exposed to concentration of 125μg/L of NPOH. Note the presence of chloride cells (white arrows) and hyperplasia along some secondary lamellae (asterisk). C) Gill filament of Danio rerio exposed to concentration of 50µg/L of NPOH. Observe displacement and elevation of the epithelium of secondary lamellae (asterisk) and hyperplasia at the top of some secondary lamellae (white arrows). D) Gill filament of Danio rerio exposed to concentration of 35μg/L of NPOH. Observe vascular congestion (marked area), displacement and elevation of the epithelium of secondary lamellae (asterisk) and hyperplasia because of secondary lamellae. E) Gill of Danio rerio filament exposed to concentration of 25µg/L of NPOH. Note hyperplasia some secondary lamellae (white arrows) the epithelium displacement and elevation of the secondary lamellae (asterisk) by hyperplasia and secondary lamellae.
Dilatation of capillaries on secondary lamellae was often accompanied by vascular congestion, characterized by blood stagnation. This alteration is rarely observed in normal conditions and the presence of several erythrocytes may cause aneurism or haemorrhage due to epithelial rupture and extravasations of blood.49 Presence of aneurism was observed more frequently at 35 µg/L of NPOH. On the present study, it was also observed regressive alterations, induced by hypo function of cells and tissues, involving degeneration and necrosis. According to Takashima & Hibiya.52 several pathological agents may cause epithelial edema, vacuolation and necrosis on secondary lamellae. Impairment on blood flow observed for bronchial tissue affects gills function of gas exchange.49
Tables 6 & 7, Figures 3 & 4 shows that NPOH at 25, 35 and 50 µg/mL (Figure 4) induced significative alterations on gills of D. rerio, when compared with the control (surfactants, 125 µg/L). Considering HAI values, it was possible to observe that NPOH at 25 µg/L caused more damage to gill tissue (p < 0.05 and p < 0.001) when compared to other treatments (Figure 4), followed by concentration of 35 µg/L (p < 0.001) (Figure 4). On this context, it is possible to observe that low concentrations of NPOH presented higher HAI values, since exposure time was higher than those observed for the concentrations above of > 50 µg/L. These results are in harmony with previous data obtained by Federici et al.52 which indicated that significative alterations were observed on gill tissue of Oncorhynchus mykiss after treatment with titanium dioxide nanoparticles.
|
Alterations |
Stage |
125µg/L of Surfactants |
25µg/L of NPOH |
35µg/L of NPOH |
50µg/L of NPOH |
125µg/L of NPOH |
|
HTEC |
I |
86.6 |
100 |
100 |
100 |
100 |
|
TEpi |
I |
6.6 |
0 |
0 |
0 |
0 |
|
DEC(LS) |
I |
80 |
100 |
100 |
93.3 |
40 |
|
HECBSL |
I |
73.3 |
80 |
100 |
93.3 |
100 |
|
HECSL |
I |
13.3 |
53.3 |
33.3 |
40 |
33.3 |
|
FPLS |
I |
33,3 |
80 |
93.3 |
93.3 |
33.3 |
|
LeuELS |
I |
0 |
0 |
6.6 |
6,6 |
0 |
|
HP/HTCM |
I |
6.6 |
80 |
93.3 |
86.6 |
60 |
|
HP/HTCC |
I |
20 |
93.3 |
100 |
93.3 |
86.6 |
|
CCSL |
I |
66.6 |
93.3 |
100 |
93.3 |
86.6 |
|
MuLS |
I |
66.6 |
93.3 |
93.3 |
86.6 |
73.3 |
|
DiC |
I |
66.6 |
93.3 |
93.3 |
93.3 |
93.3 |
|
CDe |
I |
80 |
93.3 |
93.3 |
93.3 |
93.3 |
|
VC |
I |
73.3 |
100 |
80 |
80 |
6.6 |
|
Par |
I |
0 |
0 |
0 |
0 |
0 |
|
CFSSL |
I |
20 |
53.3 |
46.6 |
26.6 |
13.3 |
|
CFALSL |
II |
0 |
0 |
0 |
0 |
0 |
|
CD |
II |
0 |
100 |
86.6 |
80 |
0 |
|
ER |
II |
20 |
80 |
73.3 |
60 |
20 |
|
Hem |
II |
0 |
0 |
6.6 |
0 |
0 |
|
Na |
II |
6.6 |
33.3 |
4 |
33.3 |
0 |
|
Fib |
III |
0 |
0 |
0 |
0 |
0 |
|
Nec |
III |
0 |
100 |
93.3 |
93.3 |
20 |
Table 7 Occurrence of alterations in percentage on gills of treated groups exposed to different concentrations of NPOH.
Only group treated with surfactants (125 µg/L) presented organ functionally normal without any alteration (Stage I). NPOH at 125 µg/L induced low and moderate alterations (Stage II) and NPOH at 25, 35 and 50 µg/L induced moderate and severe alterations, widely distributed through organs (Stage III). Statistically significant difference, when compared to control group, may be attributed to exposure time to each NPOH concentration. Thus, higher toxicity observed to lower concentrations (< 35 µg/L) may be due to the fact that most of fishes survived until the end of the experiment (48h). Several studies have shown that nanoscale materials may induce toxic effects on gills of D. rerio, mainly due to small size of particles that which is directly related to morphological alterations due to enhanced absorption.53–57
Liver of D. rerio has typical vertebrate hepatocytes. Table 8 shows alterations on liver of fishes exposed to NPOH. Most frequent stage I alterations were hepatic cord on disarrangement; outline cells loss or atypical, cytoplasm vacuolation (Figure 5) and glycogen reduction (Figure 5). According to Meletti.49 cytoplasmic vacuolation on hepatocytes may be an indirect measurement of glycogen or lipid content at the cells. Rigolin–Sá.47 reported that vacuolation might be due to the reduction of glycogen content on liver and increase amount of lipids, which may combine with toxic agents and accumulate on hepatocytes.
|
Replicate |
Blank |
125µg/L of Surfactants |
25µg/L of NPOH |
35µg/L of NPOH |
50µg/L of NPOH |
125µg/L of NPOH |
|
1 |
0 |
0.6 |
35.6 |
34 |
34.2 |
31,6 |
|
2 |
0 |
2.6 |
33.4 |
31.6 |
56.2 |
32 |
|
3 |
0 |
5 |
33.4 |
55.6 |
31.8 |
12,2 |
|
Mean ± SD |
0.0 ± 0.0 |
2.73 ± 1.27 |
34.13 ± 0.73 |
40.4 ± 7.63 |
40.73 ± 7.8 |
25.26 ± 6.5 |
Table 8 Mean of Histological Alteration Index (HAI) of D. rerio liver after exposure do different concentrations of NPOH in triplicate (n=15 animals/group).
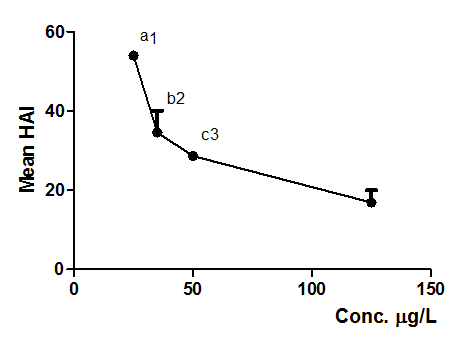
Figure 5 Mean HAI obtained from alterations observed on D. rerio gills exposed to NPOH (25, 35, 50 and 125µg/L). Each point represents mean ± SD (n = 15 animals/group). Anova followed by Tukey–Kramer test, a = p < 0.001, b = p < 0.001 and c = p < 0.01 compared to control group (surfactants at 125 µg/L); 1 = p < 0.05 comparing 25 µg/L to 50 µg/L and p < 0.001 comparing 25 µg/L to 125 µg/L; 2 = p < 0.001 comparing 35µg/L to 125µg/L and 3 = p < 0.01 comparing 50 µg/L to 125 µg/L.
Biliary stagnation was observed in higher proportion on groups treated with NPOH. Stagnated bile appear as yellow–brownish granules or green–brownish granules inside the cells.52,58 This alteration is called cholestasis and it is characterized as a pathophysiological condition attributed to metabolism failure of biliary pigments excretion. It is necessary that bilirubin become solubilised in water in order to be excreted and it involves conjugation to glucuronic acid. Thus, if bilirubin ability to bind to this acid decreases this hepatic dysfunction may occur.58
Hyperemia (Figure 5), cytoplasmic degeneration and nuclear degeneration (Figure 5) were more frequent Stage II alterations, being observed after exposure to NPOH at 50, 35 and 25 µg/L (Figure 6). Takashima & Hibyia.52 suggested that depth studies are need to elucidate if high cytoplasmic vacuolation on liver of D. rerio constitutes a negative histological alteration or if this event should be considered an alteration associated to some degeneration. Nuclear degeneration and cellular disruption on hepatocytes shows high hepatotoxicity of NPOH.
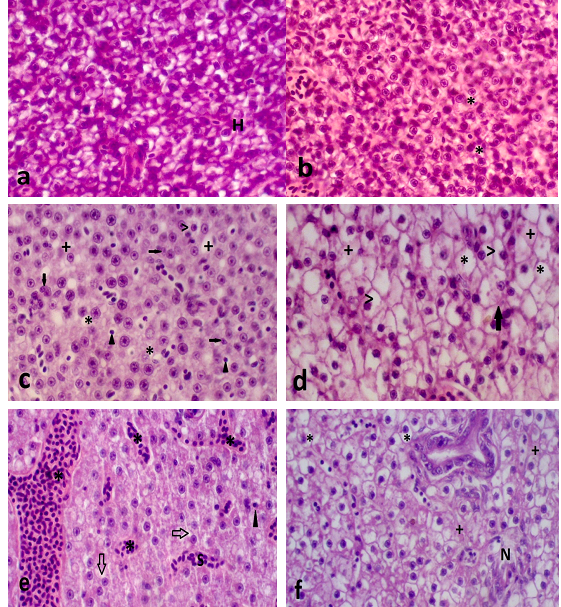
Figure 6 a) Normal liver on longitudinal histological section of D. rerio. Hepatocytes (H); b) Liver on longitudinal section of D. rerio exposed to125µg/mL of surfactants. Cytoplasmic vacuolation (*); c) Liver on longitudinal section of D. rerio exposed to 125µg/L of NPOH. Cytoplasmic vacuolation (>), biliary stagnation (▲), nuclear degeneration (black arrows), cytoplasmic degeneration (*) and glycogen reduction (+); d) Liver on longitudinal section of D. rerio exposed to 50µg/L of NPOH. Intense cytoplasmic vacuolation (>), glycogen reduction (+), outline cell atypia (arrows) and decrease in the relative frequency of nuclei; e) Liver on longitudinal section of D. rerio exposed to 35 µg/Lof NPOH. Cytoplasmic degeneration (arrows), biliary stagnation (▲), presence of sinusoids and intense presence of leukocytes (*) indicating hyperemia; f) Liver on longitudinal section of D. rerio exposed to 25 µg/L of NPOH. Intense cytoplasmic vacuolation (*), cytoplasmic degeneration (+) and focal necrosis (N). (HE, 5μm).
Regarding stage III alterations, only groups treated with NPOH showed focal and total necrosis of hepatic tissue (Figure 5), while none of these alterations were observed on group treated with surfactants (125 µg/L) (Figure 5). According to Castro et al.59 the toxic agents promote enhanced inflammatory response (infiltration of leukocytes) and necrosis areas. Poleksic & Karan.60 observed necrosis on hepatocytes of carps and related the importance of histopathological studies to verify injury induced by toxic agents. Liver is considered the main organ for drug metabolization and exerts an important detoxification function. It bio transforms and eliminates many xenobiotics, mainly as conjugates, with no impairment. However, some of them are concentrated to toxic levels and other are bioactivated to intermediary reactive compounds that may injure liver.61,62
Tables 8 & 9, and Figures 6 & 7 shows that NPOH (25, 35 e 50 µg/L) caused significant alterations on D. rerio, when compared to surfactants (125 µg/L) (p < 0.05, p < 0.01). No statistically significant difference was observed when compared to 125 µg/mL da NPOH. According to Hudes et al.63 and Azzoli et al.64 no evidence of hepatic toxicity of POH was reported. This affirmative shows that NPOH is in accordance with toxicity standards observed for several tested nanoformulations.45,57
|
Alterations |
Stage |
125µg/L of Surfactants |
25µg/L of NPOH |
35µg/L of NPOH |
50µg/L of NPOH |
125µg/L of NPOH |
|
HCD |
I |
26.6 |
100 |
93.3 |
66.6 |
60 |
|
OCLA |
I |
0 |
100 |
93.3 |
93.3 |
46.6 |
|
ONLA |
I |
13.3 |
100 |
100 |
100 |
80 |
|
ICV |
I |
0 |
86.6 |
20 |
46.6 |
40 |
|
INV |
I |
0 |
20 |
6.6 |
33.3 |
26.6 |
|
CV |
I |
40 |
86.6 |
100 |
86.6 |
93.3 |
|
DRFN |
I |
0 |
20 |
33.3 |
20 |
6.6 |
|
IRFBV |
I |
0 |
6.6 |
0 |
33.3 |
33.3 |
|
IRVBV |
I |
0 |
66.6 |
66.6 |
33.3 |
66.6 |
|
GR |
I |
46.6 |
60 |
86.6 |
73.3 |
100 |
|
BS |
I |
13.3 |
40 |
60 |
46.6 |
80 |
|
Hyp |
II |
6.6 |
73.3 |
80 |
86.6 |
80 |
|
DBV |
II |
0 |
0 |
6.6 |
60 |
6.6 |
|
DBC |
II |
0 |
26.6 |
20 |
13.3 |
13.3 |
|
NV |
II |
0 |
66.6 |
93.3 |
33.3 |
46.6 |
|
CD |
II |
26.6 |
100 |
100 |
100 |
100 |
|
ND |
II |
0 |
100 |
93.3 |
100 |
100 |
|
NA |
II |
0 |
33.3 |
20 |
40 |
13.3 |
|
CDis |
II |
0 |
46.6 |
93.3 |
40 |
0 |
|
Necrosis |
III |
0 |
100 |
100 |
93.3 |
26.6 |
Table 9 Occurrence of alterations in percentage on liver of treated groups exposed to different concentrations of NPOH.
Each value represents, in percentage, number of damage fishes in relation to total fishes (N=15) for each concentration. HCD=hepatic cordon disarrangement; OCLA= outline cell loss or atypia; ONLA=outline nuclear loss or atypia; ICV=increase in cell volume; INV= increase in nuclear volume; CV=cytoplasmic vacuolation; DRFN=decrease in relative frequency of nuclei; IRFBV=increase in the relative frequency of blood vessels; IRVBV=increase on relative volume of blood vessels; GR=glycogen reduction; BS=biliary stagnation; Hyp=hyperemia; DBV=disruption of blood vessels; DBC=degeneration bile canaliculi; NV=nuclear vacuolation; CD= cytoplasmic degeneration; ND=nuclear degeneration; NA= nuclear atrophy; CDis=cellular disruption.
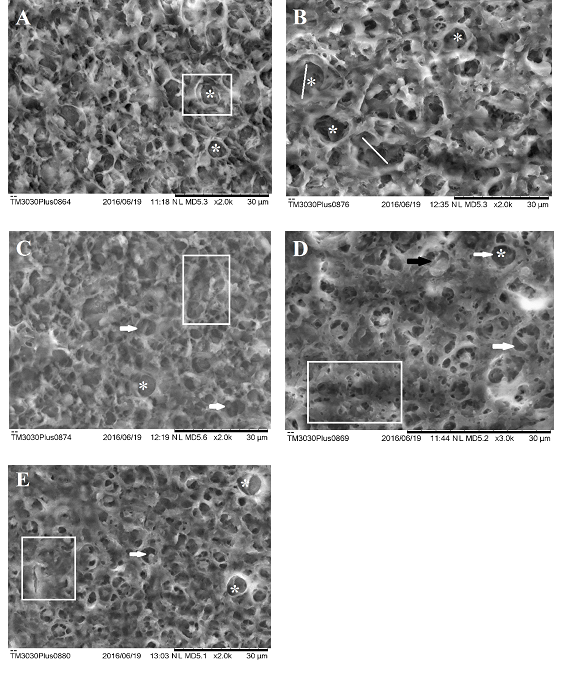
Figure 7 Scanning electron microscopy of liver of Danio rerio (zebrafish). A) Liver of Danio rerio exposed to the concentration of 125μg/L surfactant. Observe degeneration of the cytoplasm (white marked area) and vacuolization of the cytoplasm (asterisk). B) Liver of Danio rerio exposed to the concentration of 125μg/L of NPOH. Observe cytoplasmic degeneration (bars) and intense vacuolation (asterisk). C) Liver of Danio rerio exposed to concentration of 50 μg/L of NPOH. Observe necrosis (marked area), vacuolation of the cytoplasm (asterisk) and decrease in relative frequency nucleus (white arrows). D) Liver of Danio rerio exposed to the concentration of 35μg/L of NPOH. Observe necrosis (marked area), cytoplasmic degeneration (black arrow) vacuolation (white arrow) and absence of nucleus (asterisk). E) Liver of Danio rerio exposed to concentration of 25 μg/L of NPOH. Observe necrosis (marked area), vacuolation (white arrow) and absence of nucleus (asterisk).
Normal functionally liver without histological alterations (Stage I) was observed only for group treated with surfactants (125 µg/L). Concentrations of NPOH (25, 35, 50 and 125 µg/L) induced moderate to severe alterations. Klingelfus.65 observed significative histological alterations on liver of Rhamdia quelen after exposure to titanium dioxide (TiO2) and inorganic lead (PbII). Regarding most frequent stage I alterations (Table 10) on kidneys tissue of D. Rerio exposed to NPOH, special attention is given to tubular alterations on animals exposed to lower concentrations (< 50 µg/L). It was also observed hypertrophy of tubular cells on these animals. According to Meletti.49 these alterations are classified as cloudy swelling type, being characterized by the presence of hypertrophy tubular epithelial cells with fine granules of eosinophils on cytoplasm. It was also observed hyaline degeneration, characterized by presence of great granules of eosinophils on cytoplasm. According to, Takashima & Hibiya.52 and Hinton and Laurén.66 this alteration can be generated inside the cell or caused by reabsorption of an excess of proteic substances filtrated by glomerulus. Most of tubular alterations on kidneys of D. rerio are induced by metabolic disorders caused by toxic agents.49 According to Takashima & Hibiya.52 most of tubular alterations are found on epithelial cells and many of them are degenerative and culminate on necrosis. However, these authors relate that hypertrophy of tubular cells and hyaline degeneration may not always induce necrosis. On the present study, necrosis was classified as a stage III alteration and was observed on all NPOH and surfactant treated groups. It was also observed that necrosis was directly related to hypertrophy of tubular cells and hyaline degeneration (low and severe) (Table 11).
|
Replicate |
Blank |
125µg/L of Surfactants |
25µg/L of NPOH |
35µg/L of NPOH |
50µg/L of NPOH |
125µg/L of NPOH |
|
1 |
0 |
31.8 |
53.8 |
34 |
33.8 |
14 |
|
2 |
0 |
31.8 |
54.2 |
56 |
36.2 |
36 |
|
3 |
0 |
8.2 |
54.2 |
55.4 |
56 |
33.8 |
|
Mean ± SD |
0.0 ± 0.0 |
23.9 ± 7.86 |
54.0 ± 0.13 |
48.4 ±7.23 |
42 ±7.03 |
27.9 ± 6.99 |
Table 10 Mean of Histological Alteration Index (HAI) of D. rerio kidneys after exposure do different concentrations of NPOH in triplicate (n=15 animals/group).
|
Alterations |
Stage |
125µg/L of Surfactants |
25µg/L of NPOH |
35µg/L of NPOH |
50µg/L of NPOH |
125µg/L of NPOH |
|
LCO |
I |
86.6 |
100 |
100 |
100 |
93.3 |
|
LDH |
I |
73.3 |
53.3 |
0 |
0 |
80 |
|
HTC |
I |
33.3 |
100 |
100 |
100 |
86.6 |
|
TDis |
I |
46.6 |
80 |
86.6 |
100 |
46.6 |
|
GD is |
I |
0 |
6.6 |
6.6 |
0 |
0 |
|
IBCS |
I |
6.6 |
33.3 |
33.3 |
26.6 |
13.3 |
|
DBCS |
I |
66.6 |
80 |
60 |
80 |
80 |
|
DGC |
I |
73.3 |
80 |
93.3 |
66.6 |
86.6 |
|
PRT |
I |
0 |
0 |
0 |
0 |
6.6 |
|
DRFG |
I |
20 |
13.3 |
40 |
26.6 |
46.6 |
|
DilBV |
I |
60 |
20 |
46.6 |
46.6 |
0 |
|
ITL |
I |
53.3 |
93.3 |
80 |
86.6 |
53.3 |
|
TO |
I |
60 |
53.3 |
33.3 |
73.3 |
66.6 |
|
SDTH |
II |
33.3 |
93.3 |
100 |
100 |
13.3 |
|
TD |
II |
46.6 |
100 |
100 |
100 |
66.6 |
|
GD |
II |
0 |
46.6 |
73.3 |
80 |
60 |
|
CDTC |
II |
60 |
100 |
100 |
100 |
93.3 |
|
NDTC |
II |
60 |
100 |
100 |
100 |
93.3 |
|
PLTBC |
II |
0 |
0 |
20 |
13.3 |
33.3 |
|
Hyp |
II |
60 |
73.3 |
100 |
86.6 |
93.3 |
|
RBV |
III |
6.6 |
73.3 |
6.6 |
40 |
0 |
|
Nec |
III |
46.6 |
100 |
100 |
100 |
40 |
Table 11 Occurrence of alterations in percentage on kidney of treated groups exposed to different concentrations of NPOH.
Each value represents, in percentage, number of damage fishes in relation to total fishes (N=15) for each concentration.LCO=Loss of cellular outline or atypical cellular outline on lymphoid tissue; LDH= low degeneration of hyaline; HTC=hypertrophy of tubular cells; TDis= tubular disorganization; GDis=glomerular disorganization; IBCS= increase on Bowman´s capsule space; DBCS= decrease on Bowman´s capsule space; DGC= dilatation of glomerular capillaries; PRT= presence of regenerated tubules or “new” nephrons; PSG= presence of several granules PAS positive on tubular cells; DRFG=decrease in the relative frequency of glomerulus; DilBV= dilatation of blood vessels; ITL= increase in tubuar lumen; TO= tubular obstruction; SDTH=severe degeneration on tubular hyaline; TD=tubular degeneration; GD=glomerular degeneration; CDTC= cytoplasmic degeneration of tubular cells; NDTC= nuclear degeneration of tubular cells; PLTBC= presence of lymphoid tissue on Bowman´s capsule; Hyp= hyperemia; RBV= rupture of blood vessels; Nec= necrosis.
Dilatation of glomerular capillaries, glomerular degeneration, increase and decrease on Bowman´s capsule space (Figures 7) were frequent in all NPOH and surfactants treated groups (Table 9). According to Takashima and Hibiya.52 this alteration occurs on pathological conditions due to basal lamina alterations, being often accompanied by alterations on podocytes and endothelial cells, such as hyperplasia. On this case, dilatation of glomerular capillaries occurs increasing its volume and consequently inducing decrease of Bowman´s capsule space (Figure 8). In another cases, dilated capillaries may compress glomerulus, inducing hyperemia. All NPOH treated groups and, with less frequency, surfactant group, presented hyperemy. Decrease on Bowman’s capsule space may affect blood filtration and all renal function. However, opposite effect may occur and Bowman´s capsule space can increase. This alteration was less observed on groups treated with NPOH and surfactants, but maybe attributed to atrophy of glomerular degeneration (Figure 9). Meletti.49 also observed this type of alteration on kidneys of S. notomelas exposed to industrial sediments.
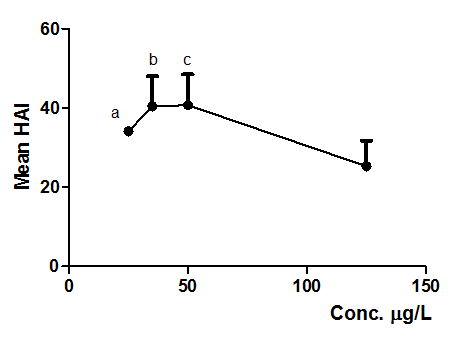
Figure 8 Mean HAI obtained from alterations observed on D. rerio liver exposed to NPOH (25, 35, 50 and 125µg/L). Each point represents mean ± SD (n = 15 animals/group). Anova followed by Tukey–Kramer test, a = p < 0.05, b = p < 0.01 and c = p < 0.01 compared to control group (surfactants at 125 µg/L).
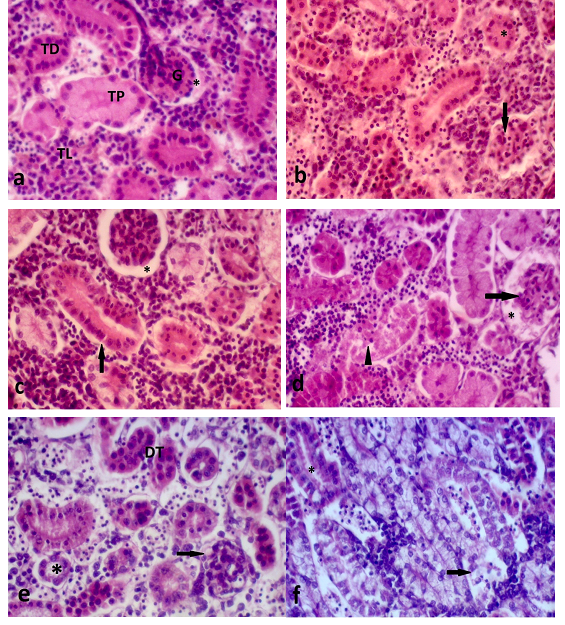
Figure 9 a) Normal kidney on longitudinal histological sectionofD. rerio. Glomerulus (G). Intercapsular space (*). Lymphoid tissue (TL), distal tubule (TD), proximal tubule (TP); b) Kidney on longitudinal section of D. rerio exposed to 125µg/Lof surfactants. Dilated glomerular capillaries (arrows) and tubular obstruction (*); c) Kidney on longitudinal section of D. rerio exposed to 125 µg/L of NPOH. Increase on Bowman´s capsule space (*) and degeneration of hyaline tubular light (arrow); d) Kidney on longitudinal section of D. rerio exposed to 50µg/L of NPOH. Increase on Bowman´s capsule space (*) due to glomerular degeneration (arrow) and degeneration of tubular hyaline (▲); e) Kidney on longitudinal section of D. rerio exposed to 35µg/L of NPOH. Decrease on Bowman´s capsule space (arrow), increase in tubular lumen (*) and tubular disorganization (DT). f) Kidney on longitudinal section of D. rerio exposed to 25µg/Lof NPOH. Tubular degeneration (arrow) and increase in tubular lumen. (HE, 5μm).
Table 11 and Figures 10 & 11 shows that NPOH (25, 35 and 50 µg/L) did not cause significative alterations on kidneys of D. rerio. This result may be associated to different exposure times, since fishes exposed to higher concentrations of NPOH (≥ 50 µg/L) died in the first 3h (Table 4) and not sufficient time to metabolization of NPOH on kidneys, differing from groups treated with other concentrations (< 35 µg/L) that survived until de end of experiment (48h). Srivastava & Gupta.67 also reported similar histological alterations on Channa punctatus renal tissue exposed to zinc and concluded that these alterations are severe enough to cause impairment to kidney functions. The alterations observed on kidneys of D. rerio exposed to NPOH and surfactants were considered moderate and severe and widely distributed through the organ (Table 11).
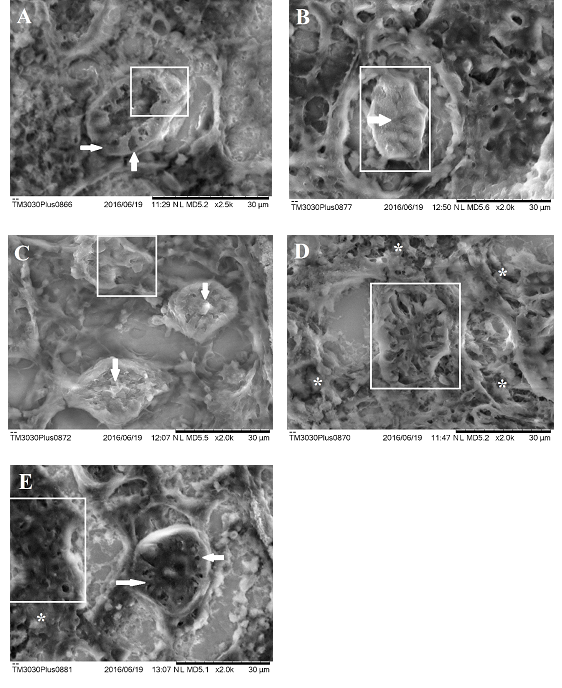
Figure 10 Scanning electron microscopy of kidney of Danio rerio (zebrafish). A) Kidney of Danio rerio exposed to concentration of 125μg/L of surfactant. Observe slight hyaline degeneration (white arrows) cytoplasmic degeneration of tubular cells (white marked area). B) Kidney of Danio rerio exposed to concentration of 125μg/L of NPOH. Observe hypertrophy of tubular cells (white marked area) and tubular obstruction (asterisk). C) Kidney of Danio rerio exposed to concentration of 50μg/L of NPOH. Observe tubular degeneration (white marked area) and tubular obstruction (white arrows). D) Kidney Danio rerio exposed to concentration of 35μg/L of NPOH. Observe severe hyaline degeneration (are marked) and necrosis points (asterisk). E) Kidney of Danio rerio exposed to concentration of 35μg/L of NPOH. Observe severe hyaline degeneration (white arrows) and necrosis (white marked area).
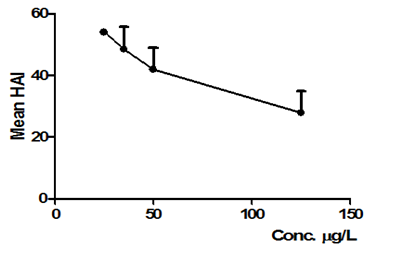
Figure 11 Mean HAI obtained on D. rerio kidneys exposed to NPOH (25, 35, and 50 e 125 µg/L). Each point represents mean ± SD (n = 15 animals/group). Anova followed by Tukey–Kramer test. There were no statistically significant alterations in the kidneys of D. rerio when compared to exposure concentration of 125μg/L of surfactant with exposure concentrations NPOH.
Exposure of D. rerio to different concentrations (25, 35, 50 and 125 µg/L) of NPOH during 48h induced behavioural alterations and LC50 was estimated at 33.4 µg/L. Concentrations of 25 and 35 µg/L of NPOH induced major injury to gills tissue when compared to other NPOH concentrations (50 and 125 µg/L) and surfactants (125 µg/L). Concentrations of 25, 35 and 50 µg/L of NPOH induced major injury to hepatic tissue, when compared to surfactants (125 µg/L), while not significant alteration was observed regarding comparison among theses concentrations. Concentrations of 25, 35 and 50 µg/L of NPOH did not induce any significant alterations on kidneys, when compared to surfactants (125 µg/L) and neither when compared among them. Our data support previous toxicity patterns previously observed for nanoformulations and xenobiotics.
Authors would like to thank CAPES (nº 3292/2013 AUXPE), and CNPq Proc. 402332/2013–0 for the financial support.
None.

©2016 Souza, et al. This is an open access article distributed under the terms of the, which permits unrestricted use, distribution, and build upon your work non-commercially.