Journal of
eISSN: 2376-0060


Research Article Volume 7 Issue 4
1Radiology, Duke University School of Medicine, USA
2Anesthesiology-Gvtu Division, Duke University School of Medicine, USA
3Medicine-Pulmonary, Duke University School of Medicine, USA
4Duke Image Analysis Laboratory, Duke University School of Medicine, USA
5Siemens Healthcare, Duke University School of Medicine, USA
Correspondence: Cecil Charles PhD, 2424 Erwin Road, Suite 301, Hock Plaza, Durham, NC 27701, USA
Received: December 09, 2020 | Published: December 30, 2020
Citation: Mammarappallil J, Moon RE, MacIntyre NR, et al. Cardio-Respiratory tolerability of perfluoropropane-Enhanced MRI of pulmonary ventilation. J Lung Pulm Respir Res. 2020;7(4):107-115. DOI: 10.15406/jlprr.2020.07.00239
Rationale: Recent advances in perfluoropropane magnetic resonance imaging of the lung have provided the means to assess pulmonary ventilation and gas distribution throughout the pulmonary airways and acini in a non-invasive manner.
Objectives: The increased density of the inhaled PFP/O2 gas mixture generates longer wash-in times compared to wash-out while breathing room air and leads to slight increases in airway resistance (Raw) and respiratory effort by the subject during imaging. As a consequence of these gas-related effects, we sought to evaluate the cardio-respiratory tolerability of the PFP/O2 gas mixtures in our sequential breath-hold imaging protocol in normal subjects and subjects with obstructive lung disease.
Methods: Tolerability was determined by evaluation of changes in vital signs (Heart Rate, Systolic and Diastolic Blood Pressure, Respiratory Rate and Temperature (otic)) at 3 time points (screening, pre-imaging and post-imaging)
Measurements and Main Results: Assessment of vital signs before and after the administration of perfluoropropane gas mixture by matched pair analysis demonstrated statistically different values for Heart rate (Mean Difference =-2.417 bpm), Systolic BP (Mean Difference=6.95 mmHg), Diastolic BP (Mean Difference=3.86 mmHg) and SpO2 (Mean Difference=0.56%) even though these do not represent physiologically significant differences compared to activities of daily living such as climbing a flight of stairs.
Conclusions: Our data demonstrate no negative outcomes in using PFP gas to image pulmonary ventilation. The PFP gas mixture is safe, well tolerated, and provides a three dimensional ‘picture’ (representation) of inhaled gas distribution for subject cohorts of normal and obstructive lung disease.
Keywords: 19F Imaging, ventilation, safety, physiology
ATS, american thoracic society; BP, blood pressure; CAMRD, center for advanced magnetic resonance development; COPD, chronic obstructive pulmonary disease; CT, computed tomography; ERS, european respiratory society; FEV1, forced expiratory volume in 1st second; FVC, forced vital capacity; GOLD, global initiative for chronic obstructive lung disease; IND, investigational new drug; IRB, institutional review board; MR(I), magnetic resonance (imaging); PEF, peak expiratory flow; PFP, perfluoropropane; C3F8, octafluoropropane raw, airway resistance; SpO2, peripheral capillary oxygen saturation; VH, ventilatory heterogeneity
Airway diseases, acute and chronic (e.g. chronic obstructive pulmonary disease, and asthma) represent a total economic burden (direct and indirect costs) in the US of nearly $200 billion annually.1–4 An essential clinical need is accessible 3D measures of regional lung function, particularly regional ventilatory heterogeneity (VH) even with approaches relying on applications of ionizing radiation such as planar scintigraphy. However, recent advances in perfluoropropane magnetic resonance imaging of the lung have provided the means to assess pulmonary ventilation and gas distribution throughout the pulmonary airways and acini in a non-invasive manner.5–7 The dynamic nature of the 19F acquisitions gives way to the generation of various spatio-temporal parametric biomarkers of pulmonary ventilation encompassing ventilation distribution, efficiency and the severity, size and persistence of slow filling/emptying compartments8 which have been referred to as gas trapping and ventilation defects by others.9–11 An important issue is subject compliance with such imaging, in particular, the cardio-respiratory impact of the imaging study.
Pulmonary ventilation is a complex, dynamic process controlling for gas exchange and is interdependent with local and regional physiological events. Precision imaging techniques are required for the detection of regional lung changes that occur during normal breathing and are frequently altered at early onset times of both restrictive and obstructive pulmonary diseases. The human lung is comprised of about 500 million alveoli in approximately 30,000 acini with a mean acinar volume of approximately 130 mm.3,12–15 The parenchymal tissue is thin, requiring very high local spatial resolution not practically achievable over the entire lung. Furthermore, the airspaces require some means of detection for changes in both motion and gas exchange with the atmosphere over time. Dynamic evaluation of the pulmonary airways and parenchymal tissues is essential to assess the pathologic consequences and changes not detectable with other imaging modalities such as CT.
In order to visualize and evaluate the lung airspaces, it is necessary to ‘color’ the air in some manner. The use of gaseous agents for imaging lung airspaces has been the mainstay in nuclear medicine (e.g. planar scintigraphy). Advances in hardware and software have allowed perfluoropropane (PFP)-enhanced MRI of the lung to overcome the low signal intensity, susceptibility and motion artifact obstacles arising from the low proton density, numerous air-tissue interfaces and cardiac and respiratory motion, respectively. The ability to dynamically assess the spatio-temporal distribution of an agent such as perfluoropropane gas within the pulmonary airspaces has been recently demonstrated with great success in human subjects with normal and abnormal pulmonary function. Our laboratory has developed a method of imaging gas wash-in and wash-out that evaluates ventilation with both visual and quantitative depiction of slow filling and emptying compartments of the lung analogous to inert gas wash-out techniques while adding 3-dimensional spatial information.5–8,16 The applications of MR imaging of the lungs with PFP gas has a variety of potential applications including pharmacodynamic evaluation of treatment(s). The use of PFP gas would likely have great impact in assessing patient response to therapy in COPD by visually demonstrating areas of the lung that reflect treatment effects. Other chronic pulmonary diseases of a restrictive nature, such as interstitial lung disease may also benefit from MRI examination with such a gas mixture.
We have successfully performed these multi-breath assessments in subjects with normal pulmonary function as well as subjects with a diagnosis of chronic obstructive pulmonary disease (Chronic Obstructive Pulmonary Disease, Global Initiative for Chronic Obstructive Lung Disease, status I-IV). Here we describe the tolerability of breathing the perfluoropropane/oxygen mixture reflected in screening, pre and post imaging cardio-respiratory parameters in a cohort of 213 subjects of which 127 underwent MRI ranging (Consort Diagram in Schema 1) [Funded in part by NHLBI R01-111294]. The increased density of the inhaled PFP/O2 gas mixture generates somewhat longer wash-in times compared to wash-out while breathing room air due to the slightly increased airway resistance (Raw) and thus respiratory effort during the wash-in phase (Raw ~1.89 with PFP/O2 compared to air) which decreases during the wash-out phase while breathing room air.17 For example, in a large animal model study by Drazen et al.,18–20 pulmonary resistance was increased for a mixture of SF6/O2 compared to air (a factor of 2.45 difference in density for a factor of 3.38 increase in pulmonary resistance). In a human study both inspiratory and expiratory airways resistance increased by 0.2cmH2O.L-1.sec-1 for each increment in gas density.17 Since PFP is of similar density to SF6 (about 20% denser) we would expect similar changes in pulmonary resistance. Work by Slutsky et al. 21in humans suggest that increased gas density, as opposed to viscosity, is related to decreased airflow for a given alveolar pressure. Finally, work by Ishikawa and Cherniack22 showed significant increase in non-elastic resistance, airway resistance and tissue viscance in patients with COPD compared to normal values (roughly factors of 3 in all parameters). These observations are consistent with our findings of increases in regional wash-in and wash-out time constants in subjects with COPD vs. normal subjects and reflects sensitivity to small airways compromise due to the use of a gas mixture with increased gas density.6 As a consequence of these physiologic effects we sought to evaluate the cardio-respiratory tolerability of the gas mixtures in our sequential breath-hold imaging protocol. Breath hold strategies are common in many medical imaging procedures and are generally well tolerated and in some cases, multiple breath holds are required.23,24 Sequential breath-holds always require some energy with an expected increase in respiratory effort due to the delivery system (one-way non-rebreathing mask delivery from a non-gas diffusing ‘Douglas’ bag) 7, the increased gas density as well as the delivery tubing diameters (Schema 2). We hypothesized that cardio-respiratory parameters such at heart rate, blood pressure and respiration rate may increase post imaging compared to pre imaging, as well as during screening periods, as a result of respiratory effort during multiple breath holds. However, we did not anticipate or expect a significant change in the subject’s body temperature and/or SpO2.
Subjects were consented per local and federal regulations and presented at the MR imaging suite (Center for Advanced MR Development, CAMRD). To comply with local policies related to incorporating scheduling research studies in EPIC (Duke Maestro Care) a preliminary IRB approved limited verbal consent process was accomplished primarily to rule out any potential subjects with MRI contraindications. After verbal screening a preliminary visit for written consent was scheduled followed by screening per the protocol. This is reflected in the Consort Diagram in Schema 1. Pulmonary function tests (PFT’s) were obtained at Screening in the pulmonary clinic at Duke Health System prior to the imaging studies. Spirometry (in accordance with ATS/ERS guidelines) and clinical referrals were utilized to distinguish between normal pulmonary function and varying states of airflow obstruction. As noted in the Consort diagram, 74 subjects with normal lung function and 53 subjects diagnosed with COPD received the allocated intervention (imaging studies with perfluorinated gases) with vital sign assessment at screening and pre- and post-imaging as a matched pair repeated measures design to evaluate tolerability of the gaseous contrast agent. We note that this study, as an early stage feasibility study had a greater number of younger subjects in the normal group than the number of aged subjects in the COPD group. Consequently we evaluated both within group and between group effects in the matched pair analysis to determine if tolerability was different in the disease (COPD) and older cohort compared to the normal cohort.
Cardio-respiratory vital signs were collected in a room adjacent to the imaging suite with the subject in the sitting position immediately prior to and after the MRI sessions. Vital signs (blood pressure, heart rate, SpO2) were determined using a CareScape V100 Patient Monitor (General Electric Health Systems), temperature (otic) (Braun Thermoscan) and respiration rate (counted breaths per minute). Imaging was performed on a Siemens Trio 3T MRI scanner (Siemens, Erlangen, Germany) and has been described previously.6,7 All breathhold image acquisitions were performed in the supine position at total lung capacity based on the signal from MR safe pneumotachometers utilizing an in-house developed gas delivery and subject monitoring apparatus. Respiratory waveforms and physiological signals of interest (i.e. heart rate, oxygen saturation and inspiratory and expiratory O2 and CO2 concentrations) were monitored throughout the imaging sessions per IND/IRB protocol.7 A total of at least 8 sequential breath holds (6-15 seconds) were performed, interleaved with at least 3 tidal breaths of the O2/PFP mixture (Normoxic, 21% oxygen, 79% PFP) (wash-in phase), or room air (wash-out phase) (Schema 2).
Tolerability was determined by evaluation of changes in vital signs (Heart Rate, Systolic and Diastolic Blood Pressure (BP), Respiratory Rate and Temperature (ear) at 3 time points (screening, pre-imaging and post-imaging) as well as evaluation of any gas related adverse effects. Slight changes in vital signs were anticipated resulting from the repeated breathholds performed during the imaging component of the study.
The increased density of the inhaled PFP/O2 gas mixture as described in the Introduction also initiates an increase in respiratory effort by the subject. Breathing the normoxic PFP mixture via the delivery system requires some additional effort due to a) the density of the gas (~ 5 times that of air) which increases the respiratory effort a factor of about 2, and b) the tubing diameter(s) of the delivery system (35 mm from the Douglas bag to the spirometry filters and 22 mm from the filter to the mask).
Bland Altman Analysis and matched pair analysis of the cardio-respiratory markers were analyzed using the methods comparison accuracy add-in (JMP Pro, V14, SAS, Cary, NC) for the screening, pre and post imaging measurements where the pre-imaging values were selected as the reference measurement.
Data are presented as Bland Altman Plots as well as the results from matched pair analysis. All results are presented both as uncorrected for multiple comparisons, with p-values reported as two-tailed values and where appropriate with Bonferronni corrections (exception in Table 2 where the pulmonary function tests were part of the inclusion criteria). For the across group analysis (within group and between group) only the prescan and postscan values were evaluated. In all cases, a p-value (corrected) of ≤ 0.05 was considered statistically significant.
Demographics are summarized in Table 1 and include Gender, Race, GOLD Status, Age, Height, Weight, BMI, Smoking Status and Pack Years by Status (Normal vs. COPD). Screening pulmonary function tests show the expected differences in FVC, FEV1, FEV1/FVC, PEF and other pulmonary function values in COPD patients compared to normal subjects (Table 2) as PFT’s were a component of the inclusion criteria for each group. Assessment of vital signs during screening and before the administration of perfluoropropane gas mixture by Bland-Altman Plots demonstrated statistically different values (uncorrected) for Heart rate (Mean Difference=-2.126 bpm), Diastolic BP (Mean Difference=1.614 mmHg), Respiration Rate Mean Difference=-0.58 bpm). None of these differences were considered physiologically significant. Assessment of vital signs before and after the administration of perfluoropropane gas mixture by Bland-Altman Plots demonstrated statistically different values for Heart rate (Mean Difference=-2.417 bpm), Systolic BP (Mean Difference=6.95 mmHg), Diastolic BP (Mean Difference=3.86 mmHg) and SpO2 (Mean Difference=0.56%). Further details are shown in Figures 1-6. While statistical significance was obtained for some vital signs only a mild effect was evident on blood pressure after correction, and as originally hypothesized consistent with the increase in respiratory effort during imaging with the multiple breath hold maneuver.
|
Normal Lung Function (N) |
COPD Diagnosis (N) |
Total |
Gender |
|||
Female |
31 |
23 |
54 |
Male |
43 |
30 |
73 |
Total |
74 |
53 |
|
|
|||
Race |
|||
African American |
27 |
10 |
37 |
American Indian |
0 |
1 |
1 |
Asian |
2 |
0 |
2 |
Hispanic |
2 |
0 |
2 |
Moorish American |
1 |
0 |
1 |
White |
42 |
42 |
84 |
|
|||
Smoking Status |
|||
Non Smoker |
33 |
4 |
37 |
Ex-Smoker |
18 |
40 |
58 |
Current Smoker |
23 |
9 |
32 |
|
|||
Pack Years |
|||
0-10 |
16 |
2 |
18 |
11-20 |
12 |
7 |
19 |
21-30 |
4 |
3 |
7 |
31-40 |
5 |
14 |
19 |
41-50 |
1 |
7 |
8 |
51-60 |
0 |
4 |
4 |
61-70 |
1 |
6 |
7 |
71-80 |
1 |
3 |
4 |
81-90 |
0 |
1 |
1 |
91-100 |
0 |
1 |
1 |
|
|||
Age |
|||
18-30 |
20 |
0 |
20 |
31-40 |
11 |
0 |
11 |
41-50 |
12 |
0 |
12 |
51-60 |
22 |
13 |
35 |
61-70 |
8 |
18 |
26 |
71-80 |
1 |
18 |
19 |
81-90 |
0 |
4 |
4 |
|
|||
Height (inches) |
|||
50-60 |
1 |
0 |
1 |
61-65 |
18 |
19 |
37 |
66-70 |
33 |
24 |
57 |
71-75 |
20 |
10 |
30 |
76-80 |
2 |
0 |
2 |
|
|||
Body Mass Index |
|||
15-20 |
2 |
5 |
7 |
21-25 |
22 |
11 |
33 |
26-30 |
29 |
22 |
51 |
31-35 |
14 |
10 |
24 |
36-40 |
6 |
5 |
11 |
>40 |
1 |
0 |
1 |
|
|||
GOLD Status |
|||
I |
3 |
|
|
II |
23 |
|
|
III |
17 |
|
|
IV |
10 |
|
|
Table 1 Demographics including gender, Race, Age, Body Measures (Weight, Height, BMI), Status (COPD vs. Normal Lung Function), GOLD Status, Smoking status (current, Ex, Non) and Pack Years are summarized below
Parameter |
COPD (n=53)* |
Normal (N = 74) |
|||
Mean |
SD |
Mean |
SD |
p-value† |
|
FVC |
2.96 |
1.02 |
4.12 |
-0.97 |
< 0.0001 |
FEV1 |
1.42 |
0.57 |
3.19 |
0.81 |
<0.0001 |
FEV1/FVC |
49.52 |
15.28 |
77.48 |
7.04 |
< 0.0001 |
FEF 25-75% |
0.52 |
0.35 |
2.86 |
1.12 |
< 0.0001 |
PEF |
4.73 |
1.95 |
8.26 |
1.87 |
< 0.0001 |
VC |
3.05 |
1.03 |
4.24 |
1.002 |
< 0.0001 |
TLC |
5.75 |
1.71 |
5.93 |
1.15 |
0.513 |
RV |
2.69 |
1.29 |
1.61 |
0.41 |
< 0.0001 |
DLCO |
12.22 |
4.66 |
23.72 |
16.57 |
<0.0001 |
Table 2 Summary of pulmonary function test parameters by status (COPD vs. Normal). Note that FEV1 was a criterion for definition of Status
*For RV, COPD n=50, Normal n=71; For DLCO, COPD n=50, Normal n=74
† t-test (two tail) unequal variances
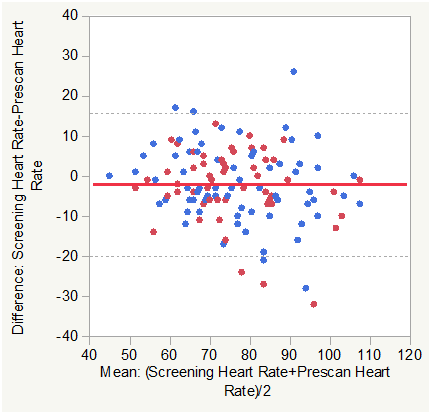
Figure 1B Bland Altman Plots for Heart Rate (HR) Screening vs. Pre Scan. Color Legend for this and subsequent figures are: Solid Red line is the Mean Difference and Dashed Black lines are±1.96 SD of the Difference. Blue markers are normal Subjects and red markers are subjects with COPD.
Matched pair analysis was accomplished for heart rate Post-Pre scan and Screening-Prescan. The Mean difference Post-Prescan was -2.417 beats per minute (N=127, Correlation = 0.8656, prob >|t| = 0.0005 uncorrected, 0.006 Bonferroni corrected). The Mean difference Screening-Prescan was -2.126 beats per minute (N=127, Correlation = 0.7912, prob >|t| = 0.0097 uncorrected, 0.1164 Bonferroni corrected). The mean heartrate was lower post scan than prescan consistent with minimum impact of the effort of multiple breath holds.
Across group analysis (within pairs) for heart rate Post-Pre scan showed a mean difference of -0.132 for subjects with COPD compared to -4.054 for normal subjects (F Ratio = 8.69, Prob>F = 0.0038 uncorrected and 0.0228 Bonferroni corrected).
Across group analysis (among pairs) for heart rate Post-Pre scan showed a mean mean of 76.953 for subjects with COPD compared to 75.338 for normal subjects (F Ratio = 0.3984, Prob>F = 0.5291 uncorrected and 1.0 Bonferroni corrected).
This was also consistent with minimum impact of the effort of multiple breath holds with the mean HR decrease slightly lower in the COPD group. The response difference (mean mean) among pairs was not significant.

Figure 2B Bland Altman Plots for Systolic Blood Pressure (Pre vs. Post scan (left) and Screening vs. Pre-Scan ).
Matched pair analysis was accomplished for systolic blood pressure Post-Pre scan and Screening-Prescan. The Mean difference Post-Prescan was 6.95 mmHg (N=127, Correlation = 0.7236, prob >|t| = 0.0001 uncorrected, 0.0012 Bonferroni corrected). The Mean difference Screening-Prescan was 0.9212 mmHg (N=127, Correlation = 0.5725, prob >|t| = 0.4685 uncorrected, 1.0 Bonferroni corrected). Mean systolic blood pressure was slightly higher post scan than prescan consistent with minimum impact of the effort of multiple breath holds. There was no significant difference between screening and prescan systolic BP.
Across group analysis (within pairs) for systolic BP Post-Pre scan showed a mean difference of 7.207 for subjects with COPD compared to 6.77 for normal subjects (F Ratio = 0.0358, Prob>F = 0.8503 uncorrected and 1.0 Bonferroni corrected).
Across group analysis (among pairs) for systolic BP Post-Pre scan showed a mean mean of 131.45 for subjects with COPD compared to 123.82 for normal subjects (F Ratio = 7.906, Prob>F = 0.0057 uncorrected and 0.0342 Bonferroni corrected).
This was also consistent with minimum physiologic impact of the effort of multiple breath holds on systolic BP in either group.
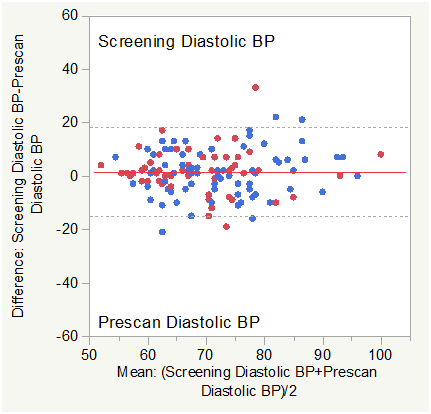
Figure 3B Bland Altman Plot for Diastolic Blood Pressure (Screening vs. Pre-Scan).
Matched pair analysis was accomplished for diastolic blood pressure Post-Pre scan and Screening-Prescan. The Mean difference Post-Prescan was 3.866 mmHg (N=127, Correlation = 0.7657, prob >|t| = 0.0001 uncorrected, 0.0012 Bonferroni corrected). The Mean difference Screening-Prescan was 1.614 mmHg (N=127, Correlation = 0.6696, prob >|t| = 0.035 uncorrected, 0.42 Bonferroni corrected). Mean diastolic blood pressure was slightly higher post scan than prescan consistent with minimum impact of the effort of multiple breath holds. There was no significant difference (corrected) between screening and prescan diastolic BP.
Across group analysis (within pairs) for diastolic BP Post-Pre scan showed a mean difference of 2.6038 for subjects with COPD compared to 4.7703 for normal subjects (F Ratio = 2.9084, Prob>F = 0.0906 uncorrected and 0.5436 Bonferroni corrected).
Across group analysis (among pairs) for diastolic BP Post-Pre scan showed a mean mean of 69.26 for subjects with COPD compared to 73.69 for normal subjects (F Ratio = 6.657, Prob>F = 0.011 uncorrected and 0.066 Bonferroni corrected).
This was also consistent with minimum physiologic impact of the effort of multiple breath holds on diastolic BP in either group.
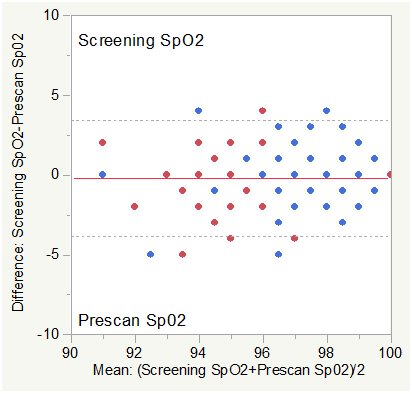
Figure 4B Bland Altman Plot for SpO2 (Screening vs. Pre-Scan).
Note: The study protocol required an SpO2 ≥ 90% for inclusion in the study and during the imaging procedure limiting the available dynamic range of SpO2 for analysis.
Matched pair analysis was accomplished for SpO2 Post-Pre scan and Screening-Prescan. The Mean difference Post-Prescan was 0.559% (N=127, Correlation = 0.599, prob >|t| = 0.0013 uncorrected, 0.0156 Bonferroni corrected). The Mean difference Screening-Prescan was -0.197% (N=127, Correlation = 0.644, prob >|t| = 0.2332 uncorrected, 1.0 Bonferroni corrected). Mean SpO2 was slightly higher post scan than prescan consistent with minimum impact of the effort of multiple breath holds. There was no significant difference (corrected) between screening and prescan SpO2.
Across group analysis (within pairs) for SpO2 Post-Pre scan showed a mean difference of 0.2264 for subjects with COPD compared to 0.7973 for normal subjects (F Ratio = 2.7757, Prob>F = 0.0982 uncorrected and 0.5892 Bonferroni corrected).
Across group analysis (among pairs) for SpO2 Post-Pre scan showed a mean mean of 96.038 for subjects with COPD compared to 97.77 for normal subjects (F Ratio = 31.73, Prob>F < 0.0001 uncorrected and 0.0006 Bonferroni corrected).
See Note above re: SpO2 requirements for inclusion.
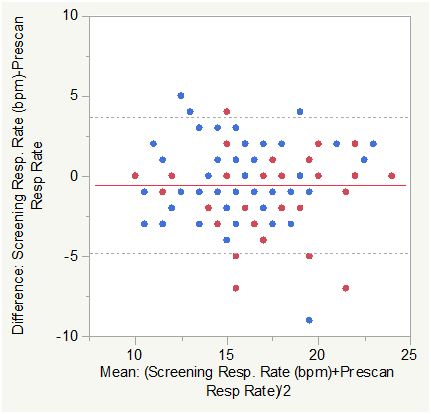
Figure 5B Bland Altman Plot for Respiratory Rate in breaths per minute (Screening vs. Pre-Scan).
Matched pair analysis was accomplished for Respiratory Rate in breaths per minute Post-Pre scan and Screening-Prescan. The Mean difference Post-Prescan was -0.1654 bpm (N=127, Correlation = 0.8518, prob >|t| = 0.2528 uncorrected, 1.0 Bonferroni corrected). The Mean difference Screening-Prescan was -0.583 bpm (N=127, Correlation = 0.7565, prob >|t| = 0.0029 uncorrected, 0.0348 Bonferroni corrected). Mean Respiratory Rate in breaths per minute was slightly lower post scan than prescan consistent with minimum impact of the effort of multiple breath holds. There was a small but significant difference (corrected) between screening and prescan Respiratory Rate in breaths per minute.
Across group analysis (within pairs) for Respiratory Rate Post-Pre scan showed a mean difference of -0.302 for subjects with COPD compared to -0.068 for normal subjects (F Ratio = 0.6426, Prob>F = 0.4243 uncorrected and 1.0 Bonferroni corrected).
Across group analysis (among pairs) for Respiratory Rate Post-Pre scan showed a mean mean of 17.396 for subjects with COPD compared to 16.331 for normal subjects (F Ratio = 4.6134, Prob>F =0.0337 uncorrected and 0.2022 Bonferroni corrected). This was also consistent with minimum impact of the effort of multiple breath holds in either group.
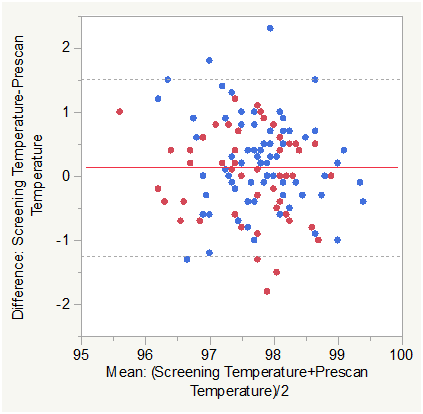
Figure 6B Bland Altman Plot for Temperature (otic, °F) (Screening vs. Pre-Scan).
Matched pair analysis was accomplished for Temperature Post-Pre scan and Screening-Prescan. The Mean difference Post-Prescan was -0.0465 °F (N=127, Correlation = 0.725, prob >|t| = 0.3594 uncorrected, 1.0 Bonferroni corrected). The Mean difference Screening-Prescan was 0.133 °F (N=127, Correlation = 0.5817, prob >|t| = 0.0345 uncorrected, 0.414 Bonferroni corrected). Mean Temperature was marginally lower post scan than prescan and not significant either statistically or physiologically. There was a small difference between screening and prescan Temperature that was not significant (corrected).
Across group analysis (within pairs) for Temperature Post-Pre scan showed a mean difference of -0.183 for subjects with COPD compared to 0.0514 for normal subjects (F Ratio = 5.4203, Prob>F = 0.0215 uncorrected and 0.129 Bonferroni corrected).
Across group analysis (among pairs) for Temperature Post-Pre scan showed a mean mean of 97.554 for subjects with COPD compared to 97.715 for normal subjects (F Ratio = 1.6050, Prob>F = 0.2075 uncorrected and 1.0 Bonferroni corrected). This was also consistent with the lack of any expected temperature differences.
Comparisons within and between groups for the pre-scan and post-scan values are summarized in Figures 1-6 and briefly, changes in HR were lower post-scan in both groups with a smaller decrease in the COPD group and changes in blood pressure were slightly different (COPD was higher than Normals for systolic BP, and COPD was lower than Normals for diastolic BP) between the groups.
Matched pair analysis was accomplished for heart rate Post-Pre scan and Screening-Prescan. The Mean difference Post-Prescan was -2.417 beats per minute (N=127, Correlation=0.8656, prob >|t|=0.0005 uncorrected, 0.006 Bonferroni corrected). The Mean difference Screening-Prescan was -2.126 beats per minute (N=127, Correlation=0.7912, prob >|t|=0.0097 uncorrected, 0.1164 Bonferroni corrected). The mean heartrate was lower post scan than prescan consistent with minimum impact of the effort of multiple breath holds.
Across group analysis (within pairs) for heart rate Post-Pre scan showed a mean difference of -0.132 for subjects with COPD compared to -4.054 for normal subjects (F Ratio=8.69, Prob>F=0.0038 uncorrected and 0.0228 Bonferroni corrected).
Across group analysis (among pairs) for heart rate Post-Pre scan showed a mean mean of 76.953 for subjects with COPD compared to 75.338 for normal subjects (F Ratio=0.3984, Prob>F=0.5291 uncorrected and 1.0 Bonferroni corrected).
This was also consistent with minimum impact of the effort of multiple breath holds with the mean HR decrease slightly lower in the COPD group. The response difference (mean mean) among pairs was not significant.
Matched pair analysis was accomplished for systolic blood pressure Post-Pre scan and Screening-Prescan. The Mean difference Post-Prescan was 6.95 mmHg (N=127, Correlation=0.7236, prob>|t|=0.0001 uncorrected, 0.0012 Bonferroni corrected). The Mean difference Screening-Prescan was 0.9212 mmHg (N=127, Correlation=0.5725, prob>|t|=0.4685 uncorrected, 1.0 Bonferroni corrected). Mean systolic blood pressure was slightly higher post scan than prescan consistent with minimum impact of the effort of multiple breath holds. There was no significant difference between screening and prescan systolic BP.
Across group analysis (within pairs) for systolic BP Post-Pre scan showed a mean difference of 7.207 for subjects with COPD compared to 6.77 for normal subjects (F Ratio=0.0358, Prob> F=0.8503 uncorrected and 1.0 Bonferroni corrected).
Across group analysis (among pairs) for systolic BP Post-Pre scan showed a mean mean of 131.45 for subjects with COPD compared to 123.82 for normal subjects (F Ratio=7.906, Prob> F=0.0057 uncorrected and 0.0342 Bonferroni corrected).
This was also consistent with minimum physiologic impact of the effort of multiple breath holds on systolic BP in either group.
Matched pair analysis was accomplished for diastolic blood pressure Post-Pre scan and Screening-Prescan. The Mean difference Post-Prescan was 3.866 mmHg (N=127, Correlation=0.7657, prob>|t|=0.0001 uncorrected, 0.0012 Bonferroni corrected). The Mean difference Screening-Prescan was 1.614 mmHg (N=127, Correlation=0.6696, prob>|t|=0.035 uncorrected, 0.42 Bonferroni corrected). Mean diastolic blood pressure was slightly higher post scan than prescan consistent with minimum impact of the effort of multiple breath holds. There was no significant difference (corrected) between screening and prescan diastolic BP.
Across group analysis (within pairs) for diastolic BP Post-Pre scan showed a mean difference of 2.6038 for subjects with COPD compared to 4.7703 for normal subjects (F Ratio=2.9084, Prob>F=0.0906 uncorrected and 0.5436 Bonferroni corrected).
Across group analysis (among pairs) for diastolic BP Post-Pre scan showed a mean mean of 69.26 for subjects with COPD compared to 73.69 for normal subjects (F Ratio=6.657, Prob>F=0.011 uncorrected and 0.066 Bonferroni corrected).
This was also consistent with minimum physiologic impact of the effort of multiple breath holds on diastolic BP in either group.
Breathing the normoxic PFP mixture via the delivery system requires some additional respiratory effort due to the density of the gas and the tubing diameter of the delivery system. Given the mild increase in effort, we expected and observed (comparable with general activities of daily living, e.g. climbing stairs) some change in both systolic and diastolic BP. We also note that while not expected somewhat smaller changes in diastolic BP were observed between screening and pre-imaging measures which could occur up to several days apart. Finally, no adverse events, nor safety concerns were noted or reported at any point during or after imaging with the PFP/oxygen mixture.
This study demonstrates no negative outcomes in using PFP gas to image pulmonary function. The PFP gas mixture is safe, well tolerated, and provides a precise three dimensional representation of the distribution of inhaled gas in our Normal and COPD subject cohort. Overall, dynamic and physiologic MRI dynamic assessment of pulmonary ventilation is safely possible with PFP gas and its application with MRI has high potential for early assessment, and follow-up in the treatment of pulmonary disease.
This study was supported by NIH/NHLBI R01-HL111294 (NCT 01640288). The imaging data used in this project was obtained from subjects scanned associated with NHLBI R01-HL111294.
None.

©2020 Mammarappallil, et al. This is an open access article distributed under the terms of the, which permits unrestricted use, distribution, and build upon your work non-commercially.