Journal of
eISSN: 2376-0060


Research Article Volume 4 Issue 4
TheraTactics Inc, USA
Correspondence: Eddie Bebout, Chief Science and Technology Officer, TheraTactics Inc, 440 East A St #119, Casper WY 82601, USA, Tel 510 504 6890
Received: September 01, 2017 | Published: September 12, 2017
Citation: Bebout E, Bebout DE, Bednarski BL (2017) Physiologic Considerations in Detection of Hypoxemia during Vasoconstriction: Radial Artery Compared to Various Pulse Oximeter Sensor Sites. J Lung Pulm Respir Res 4(4): 00137. DOI: 10.15406/jlprr.2017.04.00137
Previous studies have shown that the forehead circulation lacks vasoconstrictor reflexes during sympathetic stimulation. Other studies have shown significant delays for finger sensors in detection of hypoxemia, especially during vasoconstriction or hypotension. The purpose of this study was to compare pulse amplitude, time to detect hypoxemia, accuracy and performance of forehead, ear and finger sensors during peripheral vasoconstriction. We hypothesized that forehead sensors would show little change in pulse amplitude, rapid detection of changes in oxygenation and show best accuracy and performance during peripheral vasoconstriction. Following IRB approval and informed consent, we studied two groups of subjects during a model of peripheral vasoconstriction induced by exposure to an environmental temperature of 58-62°F. We made measurements of pulse amplitude, accuracy and performance during stable hypoxemia and measurements of time to detect rapid hypoxemia. Statistical analyses were performed using two tailed Student’s t test and repeated measures analysis of variance. Significance was accepted at the P<0.05 level. For Group 1 (N=10), pulse amplitude of forehead sensors was not significantly affected byvasoconstriction. However, the pulse amplitude of ear sensors was significantly reduced by 55% (P<0.01) and finger sensors by 89% (P<0.001). For Group 2 (N=9) during rapid desaturation, mean lag times were not different between the radial artery and forehead (10.7±7.6 versus 10.1±5.4 seconds). However, mean lag times were significantly greater for sensors placed on the ears (25.6±8.5 seconds; P<0.001) and fingers (77.5±28.4 seconds; P<0.0001). We conclude that forehead sensor pulse amplitude was not affected during peripheral vasoconstriction. The forehead sensors also showed significantly faster times for detecting hypoxemia, better accuracy and best performance. We suggest that forehead sensors may offer significant advantages when monitoring patients with peripheral vasoconstriction or in situations where rapid detection of hypoxemia is critical.
Keywords: pulse oximetry, vasoconstriction, hypoxemia, arterial saturation, forehead sensor, pulse amplitude
°C, degree centigrade; °F, degree fahrenheit; FIO2, fraction of inspired oxygen; IR, infra-red; IRB, internal review board; mm Hg, millimeters of mercury; SaO2, arterial blood oxygen saturation; SpO2, arterial saturation by pulse oximetry
Health Care Providers have multiple choices of sensors and sensor sites when monitoring arterial oxygen saturation non-invasively with pulse oximetry. The most common sites have been the digits for adults and foot or hand for neonates. However, there are alternatives including sensors for the ear, nose and forehead. These sites may offer advantages when there is trauma to the extremities or during cases of low perfusion or peripheral vasoconstriction. It was the purpose of this study to investigate the effects on pulse amplitude, time to detect rapid hypoxemia, accuracy and performance of various sensor sites during a laboratory model of peripheral vasoconstriction. Specifically, we developed a simple model to induce peripheral vasoconstriction by exposing subjects to an environmental temperature of 58-62°F for 45 minutes prior to study.
In the first group of subjects we measured pulse amplitude during normal room temperature (above 70°F) and after 45 minute exposure to 58-62°F. In the second group of subjects, we investigated the effects of peripheral vasoconstriction on detection of hypoxemia for forehead, ear and finger sensors compared to radial artery oxygen saturation (SaO2) measured by hemoximeter. Furthermore, we investigated the accuracy and performance of pulse oximetry arterial saturation (SpO2) compared to SaO2 measurements during the challenging conditions of low perfusion and peripheralvasoconstriction induced by the cooled room. We hypothesized that pulse amplitude would be least affected during peripheral vasoconstriction at the forehead compared to the other sites. Furthermore, radial arterial blood and forehead sensors would detect central hypoxemia sooner than sensors placed on the appendages of the ears and fingers and that the least vasoconstrictive sites would exhibit the best accuracy even during conditions of stable saturation.
Why monitor on the forehead? In 1942 Hertzman et al.,1 published a study looking at the vasoconstrictive properties of fingers versus the forehead.1 They used single wavelength photo plethysmography (as opposed to two wavelengths used in pulse oximetry) to measure pulse amplitude during four conditions known to stimulate the sympathetic nervous system. The four conditions were rapid awakening, loud noise, placing opposite hand in ice water and deep breath. All four conditions produced major reductions in pulse amplitude in the fingers while the forehead showed no effects.
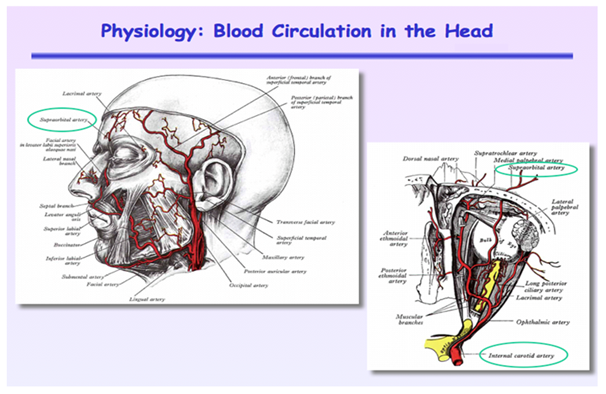
To better understand these results, one just needs to apply a little anatomical and physiological knowledge. The forehead has a very unique microcirculation that is supplied from the internal carotid artery that has no vasoconstrictive properties in response to sympathetic stimulation. Recall that brain blood flow is highly auto-regulated and is the last organ to vasoconstrict during stress and sympathetic stimulation. If you think about it, it is a design that makes complete sense. The rest of the head skin is supplied by the external carotid artery that does have vasoconstrictor properties. In fact, the forehead circulation is the only microcirculation in the entire skin that has no vasoconstrictor properties and is supplied from the internal carotid artery. Figure 1 shows that almost all of the skin on the head is supplied from the external carotid artery except the small area above the eyebrow which is fed by a branch of the internal carotid called the supraorbital artery. The supraorbital artery exits the brain circulation via the supraorbital notch above the eye and feeds the forehead skin directly above the eyebrow.

Figure 1 Arterial blood supply to the head. Note that most of the skin is supplied from the external carotid artery except for the small area above the eyebrow that is fed from the internal carotid artery via the supraorbital artery that exits skull above the eye through the supraorbital notch.
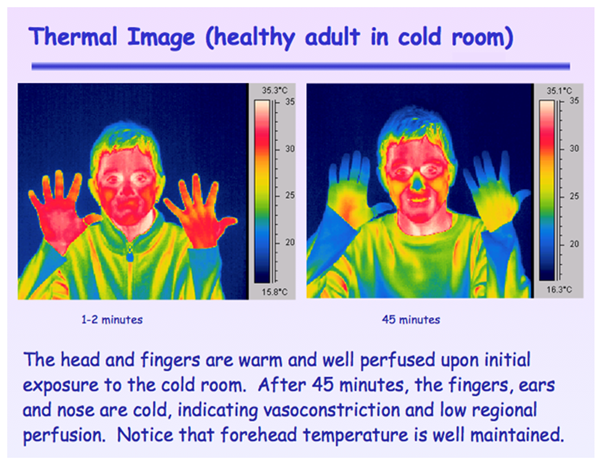
Another advantage of monitoring on the forehead is that it provides a direct measure of brain or central arterial oxygenation as opposed to other sites that are far removed from vital organs and are the first sites to vasoconstrict when the body is faced with hypoxic stress, cold or vasoactive drugs. During extreme cold and frostbite, the forehead is unaffected while fingers, toes, extremities, ears and nose are the first to be compromised. Figure 2 taken in the Nellcor clinical laboratory shows the degree of vasoconstriction that occurs after a subject is exposed to a 58°F room for only 45 min. Note that while the fingers, ears and nose are vasoconstricted, the forehead is warm and well perfused because of the lack of vasoconstrictor reflexes. Also note that the site of vasoconstriction in the fingers is just distal the digital artery.

Figure 2 Thermal Image taken with an Infra-Red (IR) camera of a healthy subject exposed to a 58°F room for 45 min.
A third advantage of monitoring on the forehead is the rapid response to changes in arterialoxygenation. Because the supraorbital microcirculation is supplied from the internal carotid artery, it directly reflects changes in brain or central arterial oxygenation. We previously reported that the mean lag time to detect hypoxemia was about 90 seconds greater for finger versus forehead sensors during peripheralvasoconstriction with the longest delay being 183 seconds.2
Following internal review board (IRB) approval and informed consent, two groups of healthy adult volunteers were studied (Group 1 N=10; Group 2 N=9). All subjects were studied in the supine position. The fraction of inspired oxygen (FIO2) was controlled by mixing nitrogen and oxygen with rotameter flow meters. Inspired and expired oxygen, carbon dioxide and nitrogen were monitored by a mass spectrometer. Continuous carbon dioxide measurements were used to calculate respiratory rate and to assess respiratory pattern. Heart rate and rhythm was measured and assessed by electrocardiography. A board certified anesthesiologist was present in the laboratory throughout the experiments. All experiments were conducted in the clinical laboratory at the Nellcor facility when located in Pleasanton, CA.
Group 1 subjects were studied under two conditions. First condition was at normal room temperature above 70°F and second was during cold room conditions of 58-62°F after 45 minutes of exposure. The pulse oximetry systems consisted of monitors (Nellcor N-595) and sensors placed on the fingers (Nellcor MAX-A), ear (Nellcor D-YSE) and forehead (Nellcor MAX-FAST). Pulse amplitude was measured as the % change in infra-red (IR) light measured by the photodetector (% IR modulation). Statistics were assessed using a two-tailed Student’s t-test and significance was accepted at P<0.05.
Group 2 subjects underwent radial artery cannulation and were acclimated to 58-62°F for 45 minutes to induce peripheral vasoconstriction. Subjects were asked to dress lightly and studies were conducted in the same cold room after the 45 minute acclimatization period. Pulse oximeter response times were adjusted, where available, to be equivalent. Radial artery SaO2 values were compared to simultaneous SpO2 readings from two forehead sensors (Nellcor MAX-FAST, with and without ahead band), two earsensors (Masimo LNOP EAR) andeight finger sensors (Nellcor MAX-A). Measures were obtained at saturation levels between 100 to 70%. Time to detect hypoxemia was measured as the lag time from the initial rapid change in FIO2. Accuracy measures were assessed from simultaneous SaO2 and SpO2 readings that were obtained during steady-state conditions at stable saturations of about 100%, 85% and70% (n=4 at each level).
Accuracy was assessed by calculating the root mean square of the differences (Arms) between the paired SaO2 and SpO2 values. Error was calculated as the percent time SpO2 values were > 4 points different from the SaO2 measurements during stable conditions. Dropout rate was calculated as the percent time that the pulse oximeter systems did not provide any values. Statistical analyses were conducted using repeated measures analysis of variance with Tukey’s adjustment for multiple comparison testing.
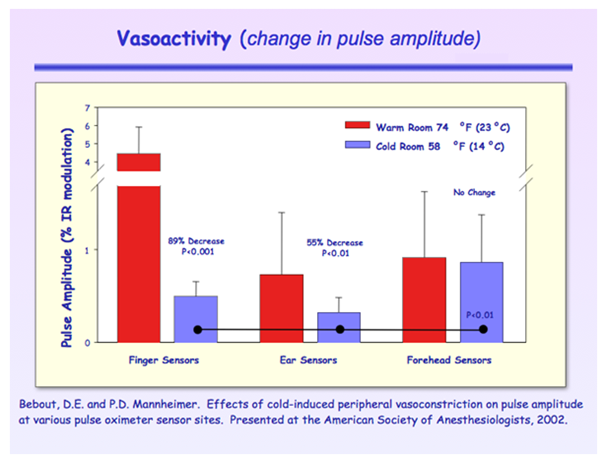
For Group 1, pulse amplitude of forehead sensors was not significantly affected by cold-induced vasoconstriction.3 Figure 3 however, pulse amplitude of ear sensors was significantly reduced by 55% (P<0.01) and finger sensors by 89% (P<0.001). Pulse amplitude of the forehead sensor (0.87±0.51%) was significantly greater than sensors on the ears (0.33±0.16%) and fingers (0.50±0.16%) during cold room conditions (P<0.01).

Figure 3 Pulse amplitude reduced most in finger sensors while ear sensors had the lowest values. The forehead was not affected by cold induced vasoconstriction.
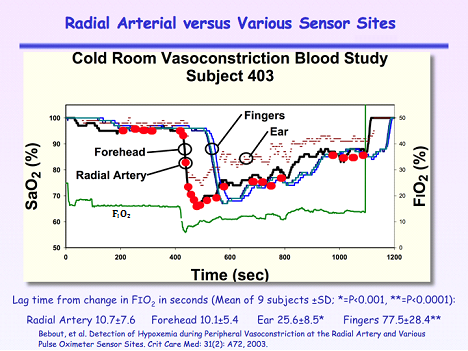
For Group 2 during rapid desaturation Figure 4, mean lag times were not different between the radial artery and forehead (10.7±7.6 versus 10.1±5.4 seconds).4 However, mean lag times were significantly greater for sensors placed on the ears (25.6±8.5 seconds; P<0.001) and fingers (77.5±28.4 seconds; P<0.0001). Note that the ear sensor had the smallest pulse amplitude, did not provide continuous readings and dropped out repeatedly.

Figure 4 Arterial oxygen saturation measurements compared to continuous SpO2 measurements from the forehead, ear and fingers during hypoxia after a 45 minute exposure to a 58°F room. FIO2 is the fraction of inspired oxygen.
Table 1 show that the forehead sensor with headband exhibited the best accuracy, least error, no drop outs and highest pulse amplitude during stable hypoxemia and peripheral vasoconstriction. In contrast, the ear sensors showed the worst performance with the poorest accuracy, highest error, greatest dropout rate and lowest pulse amplitude.
|
Radial Arterial Versus Various Sensor Sites |
|||||
|
Variable |
Finger |
Forehead w/HB |
Forehead w/HB |
Ear Lobe |
Ear Pinna |
|
RMSD |
2.1 |
1.8 |
2.2 |
5.2* |
5.0* |
|
Error > 4 (%) |
6.9* |
3.7 |
7.4* |
13.1* |
18.1* |
|
Drop Out (%) |
0 |
0 |
0 |
8.1* |
2.9* |
|
Pulse Amplitude (%) |
0.70* |
1.6 |
0.60* |
0.29* |
0.14* |
Table 1 Effects of cold induced vasoconstriction on accuracy measured as the root mean square of the differences between SaO2 and SpO2 (RMSD), error, drop out and pulse amplitude
*: p < 0.05 Compared to Forehead w/headband.4
Our pulse amplitude results supported the findings of Hertzman et al.,1 that published their manuscript in 1942, some 60 years earlier.1 Delays in detection of hypoxemia have also been observed by others. Severinghaus and Naifeh reported delays of 14-24 seconds between ear and finger sensors during rapidly induced hypoxemia.5 In a later study, Severinghaus and Spellman reported a single case of delayed hypoxia detection of 6 minutes during gravitational hypotension, induced by holding the hand well above the head.6 Arterial blood pressure dropped to 55/5 mm Hg measured near the sensor site.
In another study, a group of anesthesiologist and researchers from the pharmacology laboratory and department of Anesthesiology at Duke University Medical Center were interested in our results and proposed a different model for inducing vasoconstriction. In their study they cooled core temperature by first having the subject lie on a cooling blanket (normothermic vasoconstriction) and compared paired SaO2 and SpO2 values.7 The second condition was the addition of cold saline (4°C) by intravenous infusion and administration of nitroglycerin, a vasodilator (hypothermic vasodilation). The third was the discontinuance of the nitroglycerin administration (hypothermic vasoconstriction).
We were invited to attend and observed these studies. Figure 5 is an IR photograph we took of the first subject 20 minutes prior to hypothermia and then during an arterial blood draw while in the hypothermic vasodilation hypoxic challenge. Everyone was dismayed that the vasoconstriction appeared to be worse and the finger delays longer compared to the other conditions. In Figure 5, observe the degree of cooling all the way down to the base of the hand, even while administering nitroglycerin. Again, one must apply physiologic principles to the observations to better understand the observations. The researchers were administering intravenous nitroglycerin which effects the entire circulation and causes a significant drop in blood pressure. The body’s baroreceptor reflex control system then tries to maintain blood pressure by further vasoconstriction to non-vital areas, thus more peripheral vasoconstriction. Figure 6 depicts the three hypoxic challenges in subject 5. The hypothermic vasodilation epoch is highlighted and it shows the longest finger delays that averaged about 2 minutes. Mild hypothermia similar to the protocol used in the MacLeod et al. study is common place during cardiac surgeries. One has to question the safety of monitoring on the fingers during hypothermia and the administration of vasoactive drugs.
We conclude that pulse amplitude from forehead sensors are not affected by peripheral vasoconstriction. Forehead pulse amplitude has the strongest signal and is most accurate when compared to the other sensor sites. Furthermore, blood SaO2 and forehead SpO2 were in complete agreement during rapid hypoxemia compared to ear and finger sites that were significantly delayed. Lastly, the forehead sensor with headband showed the best accuracy, least error and highest pulse amplitude compared to ear and finger sensors. The ear sensors had the worst performance with poorest accuracy, highest error, greatest dropout rate and lowest pulse amplitude compared to the other sites.
Radial arterial blood (proximal the digital arteries) and forehead sensors (fed by the supraorbital artery arising from the internal carotid) are rapid indicators of central hypoxemia during peripheral vasoconstriction. Ear sensors (fed by branches of the external carotid) and finger sensorsare susceptible to peripheral vasoconstriction and are slower to respond to changes in central oxygenation. Furthermore, pulse oximetry as measured at the forehead most accurately reflects blood hemoximetry values during vasoconstriction. We suggest that forehead sensors may offer significant advantage over ear and finger sensors when monitoring patients with peripheral vasoconstriction or in situations whererapiddetection of hypoxemia is critical. The diminished performance of finger and ear sensors likely results from the physio-optical effects of reduced tissue blood volume in combination with small pulse amplitude.
We acknowledge the Nellcor clinical staff that provided assistance for these studies. Both Eddie Bebout and Bill Bednarski were employees at Nellcor during development and testing of the forehead sensor.
There are no conflicts of interest.
None.

©2017 Bebout, et al. This is an open access article distributed under the terms of the, which permits unrestricted use, distribution, and build upon your work non-commercially.