Journal of
eISSN: 2373-4469


Research Article Volume 4 Issue 2
1Department of Biological Sciences, Yarmouk University, Jordan
2Department of Nephro-Urology, Jordan
3Department of Pathology and Microbiology, King Abdullah University Hospital, Jordan
4Department of Applied Biology, Jordan University of Science and Technology, Jordan
Correspondence: Ahmad Khalil, Department of Biological Sciences, Yarmouk University, Irbid, Jordan, Postal Code: 211-63, Tel 00962799923290, Fax 96227211117
Received: May 08, 2017 | Published: September 12, 2017
Citation: Alghadi AY, Khalil AM, Alazab R, et al. Unique expression of the xbp1 gene correlates with human prostate cancer. J Investig Genomics. 2017;4(2):47-53 DOI: 10.15406/jig.2017.04.00064
Unlike most of solid tumors, which have a range of molecular and/or immunological markers to help define prognosis and treatment options, prostate cancer (PCa) still mainly relies on histological grading and clinical parameters. Early detection of PCa is problematic due to the lack of a marker that has high diagnostic sensitivity and specificity. The X-box DNA binding protein 1 (XBP1) is a transcription factor that regulates expression of genes essential to appropriate functioning in the cellular stress response; yet little is known about the role of XBP1 in the progression of PCa. In the present study, we investigated the role of spliced XBP1 (S) and un-spliced XBP1 (U) in formalin-fixed paraffin embedded PCa tissues and PCa cell lines by using reverse transcription-quantitative polymerase chain reaction (RT-qPCR) and western blot analysis. Results showed low expression of XBP1 (S) and XBP1 (U) isoforms both in vivo and in vitro. Moreover, there was no association between the developmental stages of PCa and expression of the two isoforms of the XBP1gene. The results may suggest initial evidence that XBP1 gene expression in human PCa is unique compared to other types of cancer, so could be used as a predictor marker for PCa. This may allow for hypothesis claiming apoptotic-escape mechanism underlying maintenance of malignant phenotype.
Keywords: biomarkers, ER stress, gene expression, prostate cancer, xbp1 gene
Endoplasmic reticulum (ER) stress including glucose deprivation, hypoxia, and chemotherapeutic treatment induces unfolded protein response (UPR) to restore the normal cell function through three mechanisms; attenuation of protein translation, degradation of mal-folded proteins, and correction of folding by encouraging downstream signaling pathway to increase the production of protein chaperone that assists in the proper folding of other proteins.1,2 Induction of UPR triggers an adaptive pathway to ultimately regain ER homeostasis mediated by three UPR sensors. In the absence of ER stress, these sensors are maintained in an inactive state. However, under ER stress conditions, they become activated and induce the downstream targets. The sensors are
Inositol-requiring enzyme 1α (IRE1α) is the most conserved of all ER stress sensors in all eukaryotes.4 The endonuclease activity of IRE1 is involved in removal of a 26 intronic nucleotides from the un-spliced XBP1 [XBP1 (U)] mRNA by unconventional splicing reaction. As a result of this IRE1α-mediated XBP1 splicing, the link between activation domain (AD) and basic leucine zipper (bZIP) domain causes a frame-shift in the C-terminal region of XBP1 coding sequence. This produces a 261 amino acid polypeptide from XBP1 (U) mRNA and a 376 amino acid polypeptide from spliced XBP1 [XBP1(S)] mRNA.5‒8 The high level of dominant-negative XBP1 (U) favors apoptosis of cancer cells and high level of XBP1 (S) increases cancer cell survival.9 Uncontrolled chronic ER stress is increasingly being recognized as a factor in the pathology that underlies a wide variety of acute and chronic diseases such as diabetes mellitus, neurodegenerative diseases, prion diseases, ischemia/reperfusion injury, fibrosis, metabolic diseases, and cancers.3,10‒12 Prostate cancer (PCa) is the most men malignancy after skin cancer in United States. It represents the second most common cancer that is responsible for death around the world.13 In an attempt to describe auspicious proteins that can be used as a predictor marker for PCa, the present study was designed to investigate association of the expression of the two isoforms of the XBP1 gene; XBP1(S) and XBP1 (U), with PCa development, metastasis and tumor stage. A better understanding of these issues may provide new insights into the pathogenesis of PCa, which would give rise to a more effective therapeutic approach.
Patient samples and clinical data abstraction
Tissue collection, acquisition and processing were allowed by the Institutional Review Board (IRB) at King Abdullah University Hospital, Jordan University of Science and Technology, Irbid, Jordan (Permit Number: 24/89/2015). The research project was approved by the Deanship of Research and Graduate Studies at Yarmouk University, Irbid, Jordan. All participants provided verbal informed consents for the use of their tissue samples. Forty five formalin-fixed paraffin embedded (FFPE) tissue blocks without cut faces were used in this study tominimize possible damage from exposure to atmospheric oxygen, water, and other environmental factors such as light and infestation (fungus, insects, etc.). The blocks were divided into three groups: thirty contained prostate malignant tissues; ten had benign prostate tissues and five with normal prostate tissues. The PCa samples were obtained from patients who underwent radical prostactomy or cystoprostactomy. Each tissue sample was assayed in triplicate. The pertinent clinical information was abstracted from the patients' charts including: age, Gleason score, pathological stage, volume of tumor, metastasis, as well as level of prostate-specific antigen (PSA), chemo/hormonal therapy (Table 1).
Sample |
Age |
Gleason score |
Pathological stage |
Volume of tumor |
PSA level |
Chemo/hormonal therapy |
Metastasis |
1 |
65 |
3+3=6 |
pT2a |
3% |
3.44 |
No |
Lung Metastasis |
2 |
71 |
4+5=9 |
pT3a |
80% |
1.79 |
- |
- |
3 |
81 |
3+4=7 |
pT3a |
10% |
-* |
No |
No Metastasis |
4 |
56 |
3+3=6 |
pT2a |
55% |
4.35 |
No |
No Metastasis |
5 |
56 |
3+3=6 |
pT2a |
55% |
1.13 |
No |
No Metastasis |
6 |
77 |
3+3=6 |
pT2c |
55% |
16.6 |
- |
- |
7 |
71 |
3+3=6 |
pT3c |
<1% |
29.11 |
Hormonal therapy |
No Metastasis |
8 |
65 |
3+4=7 |
pT2c |
5% |
4.75 |
No |
No Metastasis |
9 |
67 |
3+4=7 |
pT3a |
43% |
2.38 |
Hormonal therapy |
No Metastasis |
10 |
65 |
3+4=7 |
pT2a |
<5% |
- |
No |
No Metastasis |
11 |
54 |
3+4=7 |
pT3a |
26% |
8.64 |
No |
No Metastasis |
12 |
77 |
3+4=7 |
pT3a |
15% |
6.24 |
No |
No Metastasis |
13 |
69 |
3+3=6 |
pT3a |
22% |
7.4 |
No |
No Metastasis |
14 |
69 |
4+3=7 |
pT2c |
20% |
30.1 |
No |
No Metastasis |
15 |
73 |
5+5=10 |
pT3b |
30% |
6.55 |
Hormonal therapy |
No Metastasis |
16 |
69 |
4+5=9 |
pT2c |
40% |
9.97 |
No |
No Metastasis |
17 |
56 |
5+5=10 |
pT3b |
70% |
3.61 |
Chemotherapy |
Bone Metastasis |
18 |
74 |
3+3=6 |
- |
4% |
29.28 |
Hormonal therapy |
Bone Metastasis |
19 |
72 |
3+3=6 |
pT3a |
20% |
10.89 |
No |
No Metastasis |
20 |
61 |
4+3=7 |
pT2 |
3% |
0.83 |
Hormonal therapy |
No Metastasis |
21 |
57 |
3+3=6 |
pT2a |
5% |
4.09 |
No |
No Metastasis |
22 |
61 |
3+4=7 |
pT2c |
7% |
6.62 |
No |
No Metastasis |
23 |
68 |
3+4=7 |
pT2c |
40% |
24.88 |
No |
No Metastasis |
24 |
68 |
3+4=7 |
pT2c |
10% |
8.06 |
Hormonal therapy |
No Metastasis |
25 |
71 |
3+3=6 |
- |
- |
1.72 |
No |
No Metastasis |
26 |
49 |
4+5=9 |
- |
70% |
10.72 |
Hormonal therapy |
No Metastasis |
27 |
84 |
4+5=9 |
- |
96% |
3322 |
Hormonal therapy |
No Metastasis |
28 |
74 |
4+4=8 |
- |
28% |
142.7 |
Chemotherapy |
Lung Metastasis |
29 |
60 |
3+3=6 |
pT2a |
- |
- |
No |
No |
30 |
79 |
4+4=8 |
- |
80% |
- |
Chemotherapy |
Bone Metastasis |
Table 1 Abstracted clinical data of prostate cancer patients from whom specimen was taken
PSA, prostate-specific antigen *Data not available
Cell lines and cell culture
The human PCa cell lines (PC3, DU145 and LNCaP) were purchased from American Type Culture Collection (ATCC, Manassas, VA, USA). The breast cancer cell line (MCF-7) was a generous gift from Professor Khaled Al-Qauod, Department of Biological Sciences at Yarmouk University. The cells were maintained and cultured in DMEM/F12 (Dulbecco’s modified Eagle’s medium; Hyclone, Logan, UT, USA) medium supplemented with 10% heat inactivated fetal bovine serum (FBS), 100 units/ml of penicillin, 100μg/ml of streptomycin and 1% amphotericin B(25µg/ml) (WelGENE Inc.). Cells were cultured in a humidified atmosphere with 5% CO2 at 37˚C.
Total RNA extraction from FFPE tissues
Total RNA was isolated from deparaffinized tissues as reported previously14 with some modifications. Tissue sections (5μm) were deparaffinized in sterile 1.5ml tubes by 1ml 100% xylene. Tubes were vortexed vigorously for 10s and incubated at 56˚C for 3min. Samples were centrifuged at 14,500 rpm for 3min, and these steps were repeated twice. The pellet was washed with 1ml of 100% ethanol, and contents were vortexed vigorously for 10s and centrifuged at 14,500rpm for 30min. Finally, ethanol was removed carefully using a pipette tip. Washing steps were repeated twice and pellets left at 35˚C for 10min to evaporate ethanolic remnants. Proteinase K buffer (200μl) was added to each sample, vortexed, and centrifuged for 10s at 10,000 rpm. Another 400μg/ml proteinase K were added to each tube, mixed well by pipetting, and incubated at 55˚C for 1 to 3h. After that, 1ml of Bio-ZolTM-G (bioWORLD, USA) was added to each sample followed by incubation at room temperature (RT) for 10min to ensure that nucleoprotein complexes were completely dissociated. Then, 200μl were added to each tube and then mixed gently by inverting the tubes for 20s, and then the tubes were immediately centrifuged at 6000 rpm at 4˚C for 15min. The upper phase containing total RNA was transferred to a new sterile tube and the RNA was precipitated by adding 1ml of 100% ethanol and 5μg glycogen to each sample followed by incubation at –20˚C overnight. Then, the tubes containing RNA were centrifuged at 8000 rpm for 15min at 4˚C, and the RNA pellet was washed with 1ml of 75% ethanol. The centrifugation step was repeated under the previous conditions and pellets left for 10min to air dry. Finally, the RNA pellets were re-suspended in 50μl RNase-free water and incubated at 56˚C for 10min.
Total RNA extraction from cell lines
Total RNA will be extracted from the cells using ReliaPrepTM RNA Cellminiprep System Kit (Promega, USA) as recommended by the manufacturer manual.
Total RNA quantitation
Total RNA concentration was quantified by QuantusTM Fluorometer (Promega, USA), according to the manufacturer’s instructions, and then stored at -80˚C until needed. Prior to RT-qPCR reaction, RNA samples were normalized in nuclease free water to a concentration of 20ng/μl.
Sequence analysis
All the primers and probes used in this study were designed manually (Figure 1). The location and fidelity of primers and probes sequence were checked using the following software:
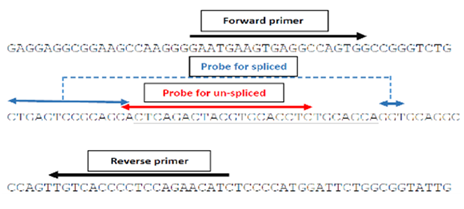
Figure 1 Sequences of designed primers and probes of spliced and un-spliced XBP1 mRNA used for quantitative analysis by RT-qPCR. Single headed arrows refer to forward and reverse primers and underlined sequence refer to spliced sequence or (26 base pair intron that is removed by IRE1). Double headed arrows refer to FAM-TAMRA labeled probes for spliced and un-spliced sequences.
https://www.ncbi.nlm.nih.gov/CCDS/CcdsBrowse.cgi;
https://genome.ucsc.edu/;
http://www.ensembl.org/Homo sapiens/Gene/;
http://primer3.ut.ee/.
Reverse transcriptase and real time PCR
Total RNA extracted from respective tissue source was converted to cDNA and analyzed to evaluate expression levels of XBP-1 gene by quantifast probe RT- PCR plus kit (Qiagen, Germany) according to the manufacturer’s instructions. To avoid false positive amplification by contaminant genomic DNA (gDNA), the gDNA was effectively removed from RNA samples through incubation with gDNA Wipeout buffer before the PCR step. In each reaction, several RNA samplesminus reverse transcriptase were applied as control to be examined for DNA contamination in the RT-qPCR reaction. The PCR reactions were applied in triplicates using CFX96™ Real-Time System machine (Bio-Rad, USA).
Absolute quantification (Standards Curve)
A standard curve was generated using 10-fold serially diluted pure total RNA (human placenta 1μg/μl; Takara, Japan). Each dilution was done in triplicate. The efficiency of amplification for two standard curves was calculated using the following formula:
Sensitivity of the standard curves in quantitative-PCR: The standard curves were constructed independently by preparation a 6-point, 10-fold serial dilution from (10-1 to 10-5) of pure total RNA.
Western blot and protein expression analysis
Total protein was isolated using Qproteome FFPE Tissue Kit (Qiagen, Germany) as recommended by the manufacture’s manual. Protein concentration was measured according to Bradford method.15
Purified XPB1 protein (sc-4445) (Santa Cruz, USA) was used as a positive control for the XPB1 protein analysis. Diluted positive control and isolated protein (15µg) from each tissue sample or cell line were denatured and resolved by 12% SDS -polyacrylamide gel electrophoresis (SDS-PAGE) and then transferred to polyvinylidene fluoride (PVDF) membrane (Santa Cruz, USA). The blotted membranes were blocked for 1h at 37˚C in a solution of 5% BSA diluted in TBS and incubated for 2 h at 37˚C with indicating primary antibodies XBP1 (sc-7160) or GAPDH (sc-47724) (Santa Cruz, USA) followed by washing with TTBS three times. The membranes were subsequently incubated with horseradish peroxidase-conjugated goat anti-rabbit IgG (sc- 2004) or goat anti-mouse IgG secondary antibodies (sc-2005) (Santa Cruz, USA) for the detection of XBP-1 and GAPDH proteins, respectively. After that, membranes were washed for 15min at RT with 1ml of substrate solution (60 mg 4-chloro-1-Naphthol, 20ml methanol, 80ml TBS and 60μl H2O2). Following development of color, the molecular weight of each band was determined and compared with protein standards. Images were captured, and intensity of scanned bands was assessed visually.
The correlation coefficients (R2) of the analysis were 0.9948 and 0.9947, and y-intercept values were 42.5 and 42.7 for spliced XBP1 and un-spliced XBP1 probes respectively. The slopes were -3.118 and -3.108 for spliced and un-spliced xbp1, respectively, marking an amplification efficiency of 109.2% and 109.7%. These results were very close to maximum efficiency (100%=-3.32 slope).The standard curves displayed a high linear relationship between the quantification cycle (Cq) and serially diluted of pure total RNA for spliced and un-spliced XBP1 plots (Figure 2) (Figure 3). Real time PCR and Western blotting were used to determine the expression level of both spliced and un-spliced XBP1 in human prostate cancer samples and control. Expression of serial dilution of external control was displayed as shown in Figure 4. Low or no expression of the spliced and un-spliced XBP1 gene was detectable by real time PCR (Figure 5). Similarly, low XBP1 gene expression was observed in the PCa cell lines; PC3, DU145 and LNCaP compared to a well expressed gene in the MCF-7 breast cancer cell line (Figure 6). When GAPDH was applied to show equal amount of protein in the lanes, it resulted in sharp protein bands. However, no bands were detected for spliced and un-spliced XBP1 in western blots (Figure 7). Moreover, in contrast to the presence of a protein band demonstrated by western blot in the hXBP 1 positive control, the PC3, DU145 and LNCaP cell lines did not exhibit any clear XBP1 protein band (Figure 8).
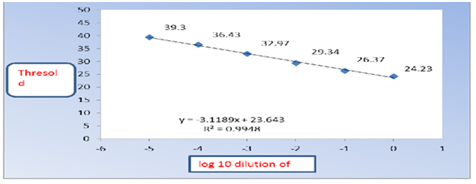
Figure 2 Standard curve for absolute quantification cycles (Cq) and the serially diluted pure total RNA for spliced XBP1. A high linear relationship between log of the template quantity and Ct values is displayed.
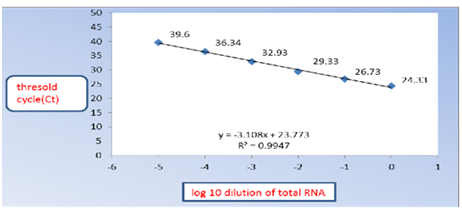
Figure 3 Standard curve for absolute quantification cycles (Cq) and serially diluted pure total RNA for un-spliced XBP1. A high linear relationship between log of the template quantity and Ct values is displayed.
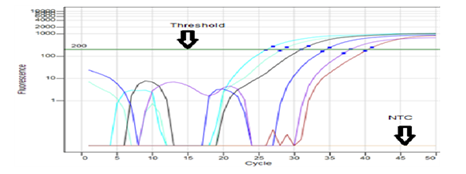
Figure 4 Expression level of the serially diluted pure total RNA (as external control) for XBP1 gene. The Cq value indicate the crossroads of each curves with threshold. NTC: no template control.
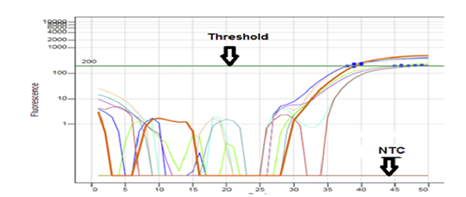
Figure 5 Expression level of the spliced and un-spliced Xbp1. When the Cq>35, the level of XBP1 mRNA is neglected. The Cq value indicate the crossroads of each curves with threshold. NTC, no template control.
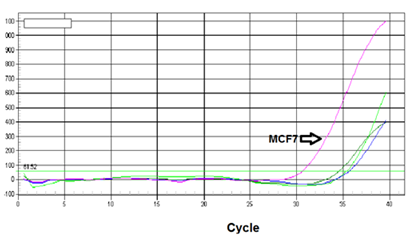
Figure 6 Expression levels of the spliced XBP1 mRNA from the PCa cell lines; PC3, DU145, LNCaP compared to the breast cancer cell line (MCF-7). The MCF-7 cells demonstrate higher expression levels of the gene. The Cq value indicate the crossroads of each curves with threshold.

Figure 7 The protein expression of GAPDH and XBP1 in prostate cancer samples and normal were subjected to western blot. GAPDH was applied to show equal amounts of proteins were used in the lanes. Bands for spliced and un-spliced XBP-1 were not detected in prostate cancer tissue (malignant and benign) and normal prostate tissue N, normal tissues, B, benign cancer tissues, M, malignant cancer tissues. Data represent two independent experiments.
XBP1 gene plays a critical role in progression, metastatic, and chemotherapy resistance of cancer.16 Each isoform of the XBP1 gene has different function in cancer cells; while up-regulation of spliced isoform of XBP1 seems to prolong survival of cancer cells, up-regulation of un-spliced isoform enhances apoptosis of these cells.9 High correlation between XBP1(S) over expression and overall survival of breast cancer cells (MCF-7 cell line) in vitro has been reported.17 Recent studies, demonstrated up-regulation of spliced XBP-1 in PCa when compared with normal tissue. Over expression of XBP1 has been correlated to poor prognosis and up-regulation of PI3K/mTOR in human osteosarcoma,18 PCa,11 fibro sarcoma and lung carcinoma,19 hepatocellular carcinoma,20,21 breast cancer,22,23 colorectal cancer,24,25 as well as myeloma.26‒28 Additionally, up-regulation of XBP1 in tumor cell has promoted vascular endothelial growth factor receptor-2 (VEGFR2) expression. VEGFR2 plays a critical role in angiogenesis and it could be responsible for cancer cell metastasis.25 In contrast, XBP1 silenced glioma cells showed a decreased capacity of tumor formation.29 Moreover, several studies demonstrated that the knock-down of XBP1 gene expression promotes impairment of tumor growth and tumor cell invasion.24,30 Similarly, low expression of UPR including (XBP1) in PCa may permit cancer cells to escape apoptosis and support tumorgenesis.31 A more recent study showed no significant differences in XBP1 (U) and XBP1(S) gene and protein expression between human colorectal cancerous tissues and the adjacent normal tissues.32 Only one study has shown low expression of XBP1 in human prostate cancer.33 However, the study did not differentiate between XBP1 (S) and XBP1 (U) mRNA expression levels.
In the current study, XBP1 (U) and XBP1(S) gene expression levels were evaluated in 30 cases of clinical PCa samples. Our data suggest that there is no association between expression of spliced and un-spliced XBP1gene and developmental stage of prostate cancer. This is contrary to the data of Takahashi group33 which confirmed an inverse relationship between expression of XBP1 and histological development in PCa. In agreement with our study, Sheng et al.11 have reported that there was no XBP-1(S) gene expression in LNCaP PCa cell line in vitro. Our results give strong evidence that XBP1 gene expression in human PCa is unique compared to other types of cancer, and this might permit prostate tumor cells to evade apoptosis. Moreover, solid tumor such as prostate cancer are characterized by hypoxic microenvironments that acts as a selective stress factor affecting tumor cell proliferation and enhancing metastatic potential.34,35 The variability expression of XBP-1 among studies might be due to various degrees of hypoxia experienced in different cellular populations. Additionally, different XBP1 expressions may reflect various potentials for accommodation with oxygen and nutrients shortages among different tumor tissue and types of cell lines. There are several mechanisms by which a malignant cell can acquire reduction in apoptosis or apoptosis resistance; disruption of balance of pro-apoptotic and anti-apoptotic proteins, reduced caspase function, and impaired death receptor signaling.36
Under present experimental conditions, no bands were detected for pXBP 1 (U) by western blot. In fact, Corazzari et al.37 reported that XBP1 (U) is usually non- or poorly translated, depending on cell type. Alternatively, the absence of pXBP 1 (U) bands may reflect a highly ubiquitinated C terminal region of this protein. In other words, there is no mutation in XBP 1 (U) that changed lysine to arginine and making it more stable and more resistance to proteasomes.5,6 Therefore, it is immediately degraded through the ubiquitin-proteasome pathway. The XBP1 (U) form has been reported to be short lived and rapidly degraded by the proteasome.38 The undetectable expression of XBP1 gene in prostate cancer tissues might be a result of a regulatory role of specific miRNA that affect expression of this gene. In conclusion, our results exhibited low XBP1 (U) and XBP1 (S) gene expression might be a useful marker for PCa compared to other types of cancer. The association between the change in XBP1 (U) and XBP1 (S) gene expression and the tumorigenesis of prostate still requires an intensive effort to elucidate and identify novel therapeutic targets for this type of cancer. Some experiments are being carried out in our laboratory, for example, the relevance of the role of some specific miRNA in regulation of XBP1 expression in human PCa.
This work was financially supported by the Deanship of Research and Graduate Studies at Yarmouk University (Grant number 28/2015).
Author declares that there is no conflict of interest.

©2017 Alghadi, et al. This is an open access article distributed under the terms of the, which permits unrestricted use, distribution, and build upon your work non-commercially.