Journal of
eISSN: 2377-4312


Research Article Volume 4 Issue 3
1Department of Large Animal Clinical Sciences, University of Tennessee, USA
2Zoetis, USA
3Department of Veterinary Clinical Sciences, Louisiana State University, USA
4Department of Biomedical and Diagnostic Sciences, University of Tennessee, USA
Correspondence: Sarel R van Amstel, Department of Large Animal Clinical Sciences, College of Veterinary Medicine, University of Tennessee, Knoxville, TN, USA, Tel 186 5755 8245
Received: October 03, 2016 | Published: December 7, 2016
Citation: Amstel SR, Young C, Scully C, et al. Rate of horn growth, wear and sole thickness of dairy cattle in a free stall barn with concrete and rubber flooring. J Dairy Vet Anim Res. 2016;4(3):305-310. DOI: 10.15406/jdvar.2016.04.00120
To compare horn growth, wear and sole thickness, twenty-four mature dairy cows were ranked in order according to lactation number and calving date. Using a randomized block design, each group of two cows was randomly assigned in ranked order to either the experimental group (housed on rubber mat, group R) or the control group (housed on concrete, group C). The 12 cows in each group were selected to achieve equal parity. The two groups were examined at 2week intervals over a 12week period. Cows in group had a significant increase in claw horn growth over the study period compared to the group R. There was a non-significant difference in wear between cows in the 2 groups at the end of the study, with cows in the group C showing most wear. These findings suggest that there was a compensatory increase in horn production in response to accelerated claw horn wear in group C. This was further supported by the fact that there was only a small but not significant difference in sole thickness between the 2 groups at the end of the study with the cows in group C having slightly thinner soles. Within group comparison of claw measurements recorded at the beginning (week0-2) and end (week10-12) of the trial, cows in both groups showed significant increases in claw length indicating that overall growth exceeded wear in both groups. Results of the study indicate a possible protective effect of a rubber walking surface (versus concrete) against claw horn wear. Cows on concrete showed accelerated growth that did not fully compensate based on a tendency for increased wear and slightly thinner soles.
Keywords: dairy cows, housing, claw, sole
Lameness has a multi-factorial etiology in dairy cattle. Some of the factors affecting claw health and locomotion score in dairy cattle include season, housing type, stall and walking surface, claw horn quality and hardness, claw trimming method, use of a trimming chute and footbaths, and feeding silage.1,2 Walking on concrete surfaces, in particular, has been identified as a cause of lameness in dairy cattle because it results in thin soles and toe ulcers with complications.3,4 One method used to prevent the adverse effects of concrete on sole horn is the placement of rubber matting on walkways in free-stall and tie-stall dairies.5‒9 Several studies have investigated the effects of concrete versus rubber on claw horn growth and claw lesions. One study found an increase in net horn growth in cows kept on rubber.7 In that study, cows on rubber flooring showed an increase in overall activity and an increase in the incidence of sole ulcers. An increase in net horn growth was likewise found in another study comparing rubber versus concrete walking surfaces.10 Jungbluth, Benz & Wandel,11 on the other hand, found no differences in claw horn growth when comparing cows kept on rubber versus concrete. Two additional studies found that cows kept on rubber showed decreased horn growth.6,12 Some of the conflicting results of the afore-mentioned studies may be due to differences in study design and different measurements for calculation of growth and wear. Also none of the studies specifically measured sole thickness to evaluate the possible protective effect if any of rubber flooring.
The objectives of this study were
Experimental design
The use of the animals in this study was approved by the Institutional Animal Care and Use Committee (IACUC 1974) of the College of Veterinary Medicine, University of Tennessee. Twenty-four mature dairy cows were ranked in order according to lactation number and calving date. Using a randomized block design, each group of two cows was randomly assigned in ranked order to either the experimental (rubber mat, group R) or the control group (housed on concrete, group C).
Sample size was calculated based on prevalence studies of thin soles in dairy cattle housed on concrete flooring in large free stall dairies.13,14 Based on these findings and lack of growth versus wear studies it was assumed that one of 10 cows on rubber mats will have claw growth exceeding wear and eight of 10 cows on concrete will have wear exceeding growth. Given that changes in growth relative to wear presents the true effect of concrete versus rubber mats in the population, we had a 90% probability of finding a statistically significant difference between the study groups with 10 cows per group at the level of p<0.05. Four cows were added to each group in order to compensate for the possibility that cows may be culled or die for reasons unrelated to the experimental procedure during the 12week (84day) study period. Two cows, from each group, was removed prior to the start of the study due to illness leaving 12 cows per group.
Animals
Two groups of 12 adult dairy cows each were housed at the University of Tennessee Dairy. Group C on concrete consisted of four cows at parity 1, four cows at parity 2, two cows at parity 3, and two cows at parity 4. The four cows from parity 1 had the most number of days in milk in the herd irrespective of milk production. The remaining eight cows had the fewest number of days in milk (most recently calved) irrespective of milk production. Cows in group R (rubber mat) were selected on the same basis as group 1 cows. All cows were kept on concrete walking surface with sand bedded stalls prior to the study
Feeding and housing
Twice daily, lactating cows were fed ad libitum a total mixed ration balanced to meet the nutritional requirements for mature Holstein cows. Both groups consisted of 12 cows, and cows in each group were housed in separate pens. Pens consisted of 24 sand-bedded free-stalls and 30 self-locking head gates. The pen for group 1 consisted of grooved concrete flooring. The pen for group 2 consisted of rubber flooring mechanically anchored to grooved concrete. Rubber mats1 were 1.83m (6 feet) wide behind the self-locking head gate feeding area and1.22m (4 feet) wide behind each row of free stalls and near an outside alley. Matts were interlocking and consisted of revulcanized rubber with burls to improve friction and traction. All matts were supplied by the same company.1 Cows not assigned to either one of the 2 groups were housed in a separate section of the dairy no comingling of cows between groups occurred during the course of the study.
Movement of animals
All cows were milked twice daily in a double 8 milking parlor with a solid concrete surface. Cows in both groups entered the milking parlor via an alley 31.70m (104 feet) long and 2.74m (9 feet) wide. This drover’s alley entrance was equipped with a 1.22m (4 feet)-wide rubber mat extending the length of the alley and placed centrally. Cows from both groups exited the parlor via a return lane 31.70m (104 feet) long with no rubber mat. Cows in the rubber treatment group were always milked first and placed directly without waiting into the milking parlor to limit their time on concrete. Cows in the concrete control group were milked after the rubber treatment group which required a 20-30-minute waiting period in the holding area with concrete flooring.1(Animat InterlockTM rubber mats, Sherbrooke, Canada). Both groups were returned to their respective pens immediately following milking to limit excessive standing on concrete.
Data collection
At week 0, cows were restrained in a mobile, stand-up leg chute and their claws checked for lesions and overgrowth (toe length>7.5cm) based on the Dutch trimming method.15 Determination of dorsal wall length is best accomplished by using a 7.5cm gauge which is placed on the dorsal wall (toe) from just below the coronary band. However, since the average toe length of the cows in the study was less than 7.5cm. None of the cows needed the toe length reduced. Only back claws were used for measurements since it has been shown that the sole horn of back feet wear more quickly than those of front feet and are thus more prone to increased wear with resulting lameness.16 Front claws were not used because of logistical problems in lifting the front feet. Except for interdigital dermatitis, none of the cows in the study had claw horn lesions (sole ulcers or white line disease) at the beginning or at the end of the study. As a preventative cows walked through a 5% formaldehyde footbath each week for four consecutive milkings, which followed a water prebath. Each claw on the back feet was grooved horizontally and vertically using a power file (Figure 1). A 1mm mark on the blade was used as a guide to ensure that the depth of the groove did not extend through the full thickness of the hoof wall. The horizontal line was made below the skin/horn junction (dotted line) of the coronary band (Figure 1). The first vertical groove was made from just below the coronary band across the horizontal line to the weight-bearing surface, midway between toe and heel (caudal wall segment), and the second was made in a similar manner midway between the first vertical line and the toe (cranial wall segment) (Figure 1).
At 2week intervals over 84days, observers blinded to treatment group evaluated cows as a comingled group. After grooving, the following measurements, using digital calipers (accurate to 0.1mm), were taken at 2week intervals on days 1, 14, 28, 42, 56, 70, and 84: from the skin/horn junction (coronary band) to the horizontal groove at the junction of each vertical groove (Figure 1) (Figure A1) (Figure B1) and from the top horizontal groove along each vertical groove to the edge of the bearing surface (Figure 1) (Figure A2) (Figure B2). Sole thickness was measured by means of ultrasound using a Aloka SSD-900V, distributed by Aloka Com Ltd, Connecticut using a 7.5-MHz probe at each examination, as previously described.16 Since thickness is variable in different anatomical locations within the sole, measurements were taken at a specific area which is the outside part of the sole area at the toe.16 Following measurements, cows were returned to their respective pens.
Calculations
See Figure 1
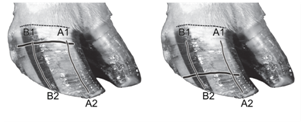
A1 and B1 represents the distance from the skin/horn junction (dotted line) at the coronary band to the horizontal groove (represents as a black line) (A1 = cranial and B1 = caudal areas of the wall)
A2 and B2 represents the distance from horizontal groove (black line) to the bearing surface ((A1 = cranial and B1 = caudal areas of the wall)
Sole thickness was determined using a 7.5-MHz probe at each examination, as previously described.16
Statistical methods
Data were analyzed sequentially, and the experiment terminated after 84days. Data are expressed as the adjusted least squares means±1 standard error of the mean (SEM). A mixed-model analysis of variance was used to evaluate the effect of group on length of claw, growth, and wear and sole thickness over the 12week observation period. Cow, group, leg, location, week, and lactation, number were included as class variables in the model. Treatment, week, lactation number days in milk, weight, and the interaction between group and week were included as independent variables in the model. Week was treated as a repeated measure with subject equal to location within leg, cow, and group. The fit of the model to data was evaluated using the –2 log likelihood ratio, and the assumption that the residuals from the model conform to a normal distribution was assessed using the test statistic of Shapiro-Wilk. A p-value <0.05 was used to determine statistical significance in all tests. The proportion of cows exhibiting wear that exceeded growth among treatment groups were compared using the Fisher exact test
Claw length
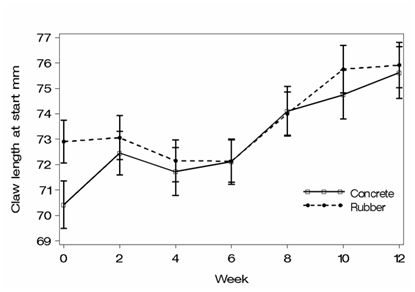
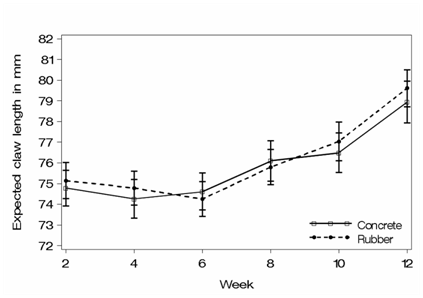
The average claw length of hind claws at the first measurement (was 72.9 mm for group R and 70.4 mm for group C, p= 0.55 (Table 2 & Figure 2). The average claw length at the end of the study was 75.9 mm and 75.6 mm for group R (rubber) and group C (concrete), respectively, p= 1.000 (Table 2 & Figure 2). The expected length (defined as length at the previous interval plus growth at the current interval) was also not significantly different among groups with an average length of 75.87mm for group C (concrete) and 76.11mm for group R (rubber), p = 0.84 (Table 1 & Figure 3).
Measurement |
Concrete |
Rubber Mat |
P value |
Observed length of claw++ |
73.03 + 0.77^ |
73.70+ 0.77 |
0.55 |
Growth^^,* |
3.26 + 0.14 |
2.78 + 0.14 |
0.02 |
Expected length^^, ** |
75.87 + 0.80 |
76.11 + 0.80 |
0.84 |
Wear† |
2.42 + 0.09 |
2.25 + 0.09 |
0.2 |
Sole thickness |
9.59 + 0.24 |
9.78 + 0.24 |
0.59 |
Table 1 Average of claw measurements+ in millimeters among a group of cows (n=12) kept on concrete verses a group (n=12) maintained on rubber mats taken at two-week intervals over a twelve week period
Measurements in millimeters at 2 week intervals and adjusted for treatment, week, treatment X week interaction, lactation number, days in milk and cow weight.
++measured at weeks 0, 2, 4, 6, 8, 10 and12
^Least squares mean (LSM) + 1 Standard error of the mean (SEM)
^^measured at weeks 2, 4, 6, 8, 10 and 12
*Growth = current measurement from coronary band to horizontal groove in hoof wall - measurement from beginning of 2 week interval.
**Expected length = (Measurement of length of claw at the end of the previous interval) + (growth of claw during current interval)
†Wear = [(Observed length at beginning of each interval) + (growth during current interval)] - [Observed length at end of current interval]
Claw horn growth
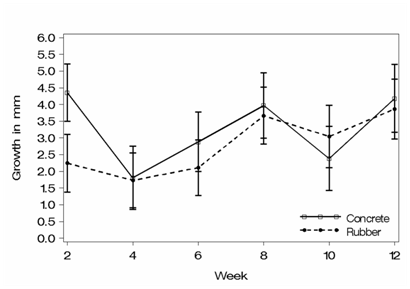
When claw horn growth was compared among groups at week 2 of the study, a statistically significant difference was found in group R(rubber) 2.25mm and group C (concrete) 4.35 mm growth, p= 0.001 (Table 2 & Figure 4). However, when measurements for growth during the last 2-week interval were compared, there was no difference in growth between the 2 groups with group R (rubber) at 3.86 mm and group C (concrete) at 4.18 mm, p= 0.99 (Table 2 & Figure 4).
Measurement* |
Week |
P value |
||
0 |
2 |
12 |
||
Concrete |
||||
Length of claw |
70.4±0.8+ |
-- |
75.6 ± 0.8 |
<0.0001 |
Wear |
-- |
2.3 + 0.2 |
3.3 + 0.2 |
0.2244 |
Growth |
-- |
4.3 + 0.2 |
4.1+ 0.2 |
1.000 |
Sole thickness |
8.6 ± 0.3 |
-- |
10.9 + 0.3 |
<.0001 |
Rubber Mat |
||||
Length of claw |
72.9 ± 0.8 |
-- |
75.9 + 0.8 |
<.0001 |
Wear |
-- |
2.0+ 0.2 |
3.6 + 0.2 |
0.0008 |
Growth |
-- |
2.2 + 0.2 |
3.8 + 0.2 |
0.017 |
Sole thickness |
9.1 + 0.3 |
-- |
11.1 + 0.3 |
<.0001 |
Table 2 Comparison of claw length, wear, growth and sole thickness in millimeters at the beginning and end of 12-week study period among a group of cows (n=12) kept on concrete and a group (n=12) kept on rubber mats
*See Table 1 for definitions of measurements.
+ Least squares mean (LSM) + 1 standard error of the mean (SEM) in millimeters, adjusted for week, interaction between treatment and week, lactation number, days in milk and cow weight.
Claw horn wear
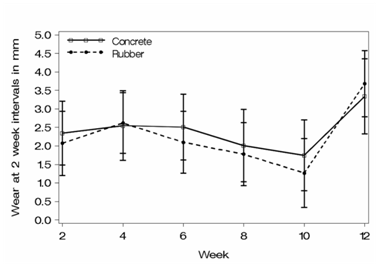
There was no significant difference in average wear at each 2-week interval (defined as claw length at the previous interval plus growth minus claw length at the current interval) with an average wear of 2.25 mm among cows on rubber mats compared with cows on concrete at 2.42 mm, p = 0.20 (Table 1 & Figure 5).
Sole thickness
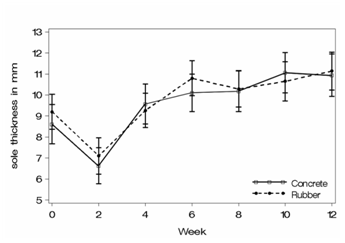
The average difference in sole thickness over the observation period was non-significant. Average sole thickness of cows in group R (rubber) was 9.78 mm, and 9.59mm among cows in group C (concrete), p = 0.59 (Table 1 & Figure 6).
Comparisons within groups
Within group comparison of claw measurements recorded at the beginning (week 0-2) and end (week 10 -12) of the trial, cows in group R exhibited significant increases in all parameters (claw length, wear, growth and sole thickness) whereas cows in group C showed a significant increase in claw length and sole thickness (Table 3). No claw horn lesions such as sole ulcers or white line disease were found in any of the cows in both groups
Measurement* |
Week |
P value |
||
0 |
2 |
12 |
||
Concrete |
||||
Length of claw |
70.42±0.83+ |
75.62±0.83 |
<0.0001 |
|
Wear |
2.34±0.26* |
3.34±0.26 |
0.2244 |
|
Growth |
4.35±0.28 |
4.18±0.28 |
1.000 |
|
Sole thickness |
8.61±0.32 |
10.94±0.32 |
<.0001 |
|
Rubber Mat |
||||
Length of claw |
72.90±0.83 |
75.91±0.83 |
<.0001 |
|
Wear |
2.07±0.26 |
3.68±0.26 |
0.0008 |
|
Growth |
2.24±0.28 |
3.86±0.28 |
0.0017 |
|
Sole thickness |
9.190.32 |
11.13 |
0.32 |
<.0001 |
Table 3 Comparison of claw length, wear, growth and sole thickness at the beginning and end of 12-week study period among a group of cows (n=12) kept on concrete and a group (n=12) kept on rubber mats
+measurements adjusted for week, lactation number, days in milk and cow weight.
This study found that cows on concrete had significantly more average claw horn growth (measured at 2week intervals), compared to those on rubber over the course of 12weeks. The biggest difference in growth between the groups occurred during the first 2weeks of the experiment. Accelerated horn growth is often associated with increased rates of wear.16 Adaptation within the 2 groups such as may have been expressed by increased activity, standing time or decrease stall occupancy were not quantitatively measured through the use of pedometers or video recording but was not observed. Observed occupancy of sand bedded stalls was good in both groups. In addition, the composition of both groups based on parities were evenly distributed thus social interaction should have been similar. If there was in fact an adaptation period (first 2weeks) which resulted in increased activity within the 2 pens then that would provide more evidence of the role of the concrete flooring in the significant difference in horn growth observed during the first 2weeks of the study.
There was a small but non-significant increase in average wear in the cows kept on concrete compared to those kept on rubber both at 2weeks and at the end of the study, which represents the average wear over the entire study (weeks 2-12). Accelerated horn growth may occur under circumstances where there is increased mechanical removal of sole horn, such as with concrete walking surfaces or foot trimming.17 Increased sole wear may increase pressure caused by weight bearing. The increased pressure can activate mechano (pressure) receptors in the epidermis, which can result in accelerated horn growth through the release of epidermal growth factors.18 This may have contributed to the accelerated horn growth seen in this study which may explain the discrepancy between horn growth and wear found in group C(concrete). This accelerated horn growth will thus compensate for the increase rate of wear resulting in the non-significant changes in wear and sole thickness found in this study.
Various other factors apart from wear, such as age, breed, season, nutrition, environment and laminitis, have been reported to influence growth rates of claw horn.17 However, based on the selection, nutrition, and environment, except for the walking surface of cows in the study, it seems unlikely that any of those factors could have played a role in the observed difference in growth rate between the rubber and concrete groups.
Increased rates of wear have been associated with concrete walking surfaces, poor cow comfort commingling of animals,19 poor horn quality,17 poor stockmanship, and claw horn moisture.16 In the current study, cow comfort (lying down time), stockmanship, claw horn quality, and exposure of horn to external moisture were the same between both groups. It therefore seems likely that the small difference in wear could be related to the walking surface in both groups. This difference may have been greater if cows in the rubber group had access to rubber matting in the return lane from the milking parlor which amounted to 208feet/day. Another factor which may have influences the rate of wear in this study is the presence of sand on walkways particularly within the pens. This may account for the wear observed in cows on rubber. Since the free stalls for both groups were bedded with sand, wear caused by sand on walkways should have been similar between the groups. The pens for both groups were cleaned by means of a water flush system which meant that both groups would have been exposed to the same amount of residual sand as well as moisture.
Measurement of sole thickness standardize previously was used in this study.16 Sole thickness can also correlate with the degree of wear.16 Similar to wear, there was only a slight difference in sole thickness between the two groups, with the cows on concrete being slightly more thin-soled. This could also indicate that there is compensatory sole horn growth, which corresponds to the findings in other studies.6,12
When claw measurements of cows within the same groups were compared, several statistically significant differences were found between results at the start (0-2weeks) and end (10-12weeks) of the experiment. For cows on rubber, all measurements were statistically different between those taken at the start and those at the end of the experiment. For cows in the concrete group, only length and sole thickness were significantly different. This appears to demonstrate fluctuations in claw horn over time and thus the necessity to use multiple measurements at given time intervals as was done in this study (Table 2). Both groups showed similar increases in toe length and sole thickness, emphasizing the fact that cows on concrete may also have to be trimmed periodically. Overgrowth at the toe and an increase in sole thickness can lead to changes in weight bearing, within the claw predisposing to sole ulceration.15
The results of this study suggest that claw horn wear of cows on concrete was slightly faster than the rate of compensatory growth (faster growth but slightly thinner sole). Distance of travel to the milking parlor, abrasiveness and moisture of concrete flooring, number of times a day milking, and standing time are all factors that can determine the rate of claw horn wear.20 In this study, cows were milked twice daily, had only a short distance to walk on concrete to the milking parlor, and had good stall occupancy due to the stall size and sand bedding.
Results of the study indicate a possible protective effect of a rubber walking surface (versus concrete) against claw horn wear. Cows on concrete showed accelerated growth that did not fully compensate based on a tendency for increased wear and slightly thinner soles. Had the study continued longer or the walking distance to the milking parlor been greater, horn wear for cows on concrete could have been greater as compared to those on rubber.
None.
Author declares that there is no conflict of interest.

©2016 Amstel, et al. This is an open access article distributed under the terms of the, which permits unrestricted use, distribution, and build upon your work non-commercially.