Journal of
eISSN: 2377-4312


Research Article Volume 8 Issue 5
1Animal Science and Veterinary Technology, Tarleton State University, USA
2Agricultural and Consumer Sciences, Tarleton State University, USA
3Texas A&M AgriLife Extension, USA
4Animal Science and Veterinary Technology, Tarleton State University, USA and Texas A&M AgriLife Research, USA
Correspondence: Barbara Jones, Tarleton State University, Box T -0070 Stephenville, TX, USA
Received: August 23, 2019 | Published: November 18, 2019
Citation: Reuscher KR, Willits AL, Jordan ER, et al. Calf hutch style effects on temperature humidity index and calf performance. J Dairy Vet Anim Res. 2019;8(5):185?188. DOI: 10.15406/jdvar.2019.08.00266
The study objective was to evaluate the difference in calf weight gain and temperature humidity index (THI) in four hutch styles. Holstein calves (n = 120) were housed in four styles of hutches. No significant differences (P ≥ 0.05) existed for calf weight gain between hutches A, B, C, and D (60.32 ± 1.76, 59.93 ± 1.93, 57.09 ± 1.95, and 57.31 ± 1.98 kg, respectively). When outside THI was above 25 oC, the THI varied (P < 0.05) between hutches A, B, C, and D (26.88 oC ± 0.06, 25.99 oC ± 0.09, 26.23 ± 0.06, 25.74 ± 0.07, respectively).
Keywords: heat stress, hutch, calf, performance, Temperature humidity index
A major factor that affects calf performance is the environmental temperature. If the environmental temperature exceeds the thermal neutral zone, the calf can experience heat stress, which can negatively affect the calf’s welfare. The thermal neutral zone is the environmental temperature range in which the least effort is required by an animal to regulate body temperature. In the thermal neutral zone, an animal is most comfortable, has the fastest growth rate, and achieves the most efficient feed-to-gain ratio.1 The upper critical temperature marks when calves start to experience heat stress. Calves located in the western region are often exposed to temperatures greater than the upper critical temperature of the thermal neutral zone. In one study, calves showed signs that indicated heat stress when the environmental temperature reached 26 oC.2 In another study, calves showed signs of heat stress when environmental temperatures reached 32 oC.3
In the Western portion of the United States (Texas, New Mexico, Arizona, and California), 50.1% of dairies house preweaned heifers in individual hutches outside.4 Hutch style can affect the temperature within the hutch. Preliminary data presented by researchers indicated that the temperature inside the polyethylene hutches, in the Panhandle of Texas, reached temperatures between 45 to 47 oC when the ambient temperature was 36 to 40 oC.5 In Ohio, researchers reported that polyethylene hutches had an average temperature 2 oC higher than the environmental temperature.6 This indicates that calves located in the region are prone to experiencing heat stress in the summer months. Whereas hutches provide shade for the calves, hutches can have a higher temperature than the ambient temperature.
Previous researchers have studied a variety of methods to reduce the heat inside the hutches. One method is putting shade cloths over the hutches. This reduces the amount of radiation received by the hutches. Researchers in Alabama studied the effects of putting shade cloths over hutches to reduce the amount of radiation on hutches. An 80% shade cloth was placed 1.5 meters above the calf hutches. Researchers reported that the temperature inside the shaded and unshaded hutches averaged 25.1oC and 27.3oC, respectively.7 Additional research was conducted to determine the effects of covering polyethylene hutches with insulated reflective material. Researchers found that when temperature humidity index (THI) reached 33oC, temperature in insulated hutches was 33.7 oC compared to 34.9 oC in non-insulated hutches.5 Similarly, investigators8 found that hutches covered with an aluminized polyester film had significantly lower interior temperatures than hutches that were not covered in the material. In fact, during a 21 day sampling period, the highest recorded temperature in the covered hutch was 43.5 oC compared to 50.5 oC in the control hutch.
Researchers have also looked at the structural design of the hutch and its effect on internal hutch temperature. Studies to determine whether raised hutches lowered hutch temperature yielded varied results. The investigators reported that air flow through hutches increased from 0 km/hr to six km/hr when hutches are raised 20 cm. During the late afternoon, the respiration rates of the calves were significantly lesser in those housed in the raised hutches, compared to the calves in hutches that were not raised.9 However, other investigators found that no significant differences existed in interior temperature of the hutches that were raised 10cm compared to the hutches that were not raised.8
The objective of this study was to evaluate four different calf hutch designs to determine the difference in calf hutch THI and its effect on calf performance under summer conditions.
This study was conducted on a commercial calf ranch in the panhandle of Texas from July 10, 2017 to October 12, 2017. Calves (n = 120) were sourced from three dairy operations located within 35 miles of the calf ranch. However, eleven calves initially enrolled were removed due to death. Final data was calculated using calves that completed the entirety of the study (n = 109).
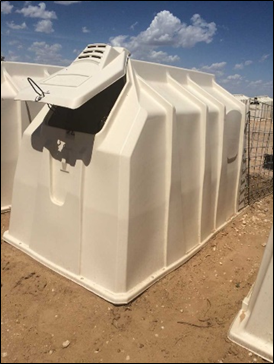
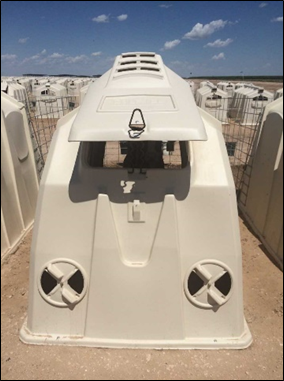
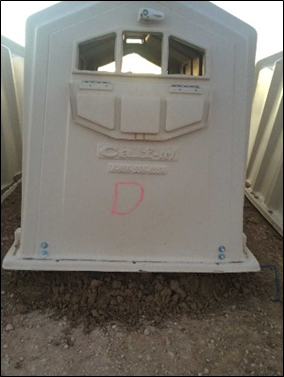
Calves were randomly assigned, one of four styles of hutches (Figure 1), within seven days of the start of the study. Hutch A (Pro Hutch, Calf-Tel Hampel Corp., Germantown, WI; Figure 2; n = 31) had vents on the top of the rear wall and was 219.7 cm X 121.9 cm X 1359 cm. Hutch B (Pro II Hutch, Calf-Tel Hampel Corp., Germantown, WI; Figure 2, n = 27) had an adjustable rear ventilation door and was 220cm x 122cm x 138cm. Hutch C (Pro II Hutch with lower vents, Calf-Tel Hampel Corp., Germantown, WI; Figure 2, n= 25) was the same dimensions as Hutch B but had two added circular vents on the rear wall of the hutch. Hutch D (Pro Hutch, Calf-Tel Hampel Corp., Germantown, WI; Figure 2, n = 26) was the same dimensions as Hutch A but was raised 15.24 cm in the rear by a custom bar lift. All hutch vents were open for the duration of the study. Hutches were bedded with fresh sand at the beginning of the study and then re-bedded with straw at day 47 and day 54 (Figure 1&2).

1Hutch A (Pro Hutch, Calf-Tel Hampel Corp., Germantown, WI; n = 31)
2Hutch B (Pro II Hutch, Calf-Tel Hampel Corp., Germantown, WI; n = 27)
3Hutch C (Pro II Hutch with lower vents, Calf-Tel Hampel Corp., Germantown, WI; n= 25)
4Hutch D (Pro Hutch, Calf-Tel Hampel Corp., Germantown, WI; n = 26)
Figure 1 Four calf hutch style1–4 placement assignments used in an experiment to determine differences among the calf hutches.


1Hutch A 2Hutch B


1Hutch C 2Hutch D
1Hutch A (Pro Hutch, Calf-Tel Hampel Corp., Germantown, WI; n = 31)
2Hutch B (Pro II Hutch, Calf-Tel Hampel Corp., Germantown, WI; n = 27)
3Hutch C (Pro II Hutch with lower vents, Calf-Tel Hampel Corp., Germantown, WI; n = 25)
4Hutch D (Pro Hutch, Calf-Tel Hampel Corp., Germantown, WI; n = 26)
Figure 2 Four different hutch styles used to determine if differences existed in calf performance.
Calves were given INFORCE 3 (Zoetis Services LLC, Parsippany, New Jersey) and Excede (Zoetis Services LLC, Parsippany, New Jersey) upon arrival to the farm. At the beginning of the study, a serum sample was taken from each calf. Calves with a serum total less than 5.5 mg/dL were replaced with another calf from the same source farm. Initial weights were taken for each calf using a portable TRu Test xr5000 scale (TRU- Test Group Limited, Auckland, New Zealand). Only calves between 32 to 42 kg were used for the study. Throughout the study calves had ad libitum access to water. On day one calves were given a handful of 20% crude protein calf starter. For the first eight to 10 days calves were fed 2.84 L of whole milk twice a day and each calf received Dairy Keep 2 (SCG-Solutions, LLC. De Pere, WI) in their water. On day three, calves were dehorned with dehorning paste. On days four to 15, calves were fed electrolytes at noon. On day 10, Calves were switched to a 24-17 milk replacer (Provimi North America Inc., Brookville, Ohio). They were fed 2.84 L a day, twice a day. On day 47 the amount of 24-17 milk replacer calves received was reduced to two quarts twice a day. On day 54, the amount of 24/17 milk replacer fed was adjusted to 1.89 L, once a day and calves were given a shot of titanium. On day 61 calves were weaned off milk completely.
Calf starter was collected by the herd manager at fourteen random times throughout the study. Composite samples were sent to Cumberland Valley Analytical Services (Waynesboro, PA) for analysis of crude protein. Average crude protein of the calf starter was 20.67±0.74% (Table 1).
Analysis performed |
Mean ± standard deviation |
Acid detergent fiber |
9.62 ± 0.71 |
ASH |
8.09 ± 2.11 |
Calcium |
1.076 ± 0.09 |
Chloride |
0.58 ± 0.03 |
Crude Protein |
20.67 ± 0.74 |
Crude Fat |
2.79 ± 0.49 |
Ethanol Soluble |
8.26 ± 0.33 |
Lignin |
3.37 ± 0.50 |
Magnesium |
0.62 ± 0.08 |
Neutral detergent fiber Protein |
1.37 ± 0.46 |
Non Fiber Carbohydrates |
51.07 ± 3.62 |
Phosphorus |
0.67 ± 0.03 |
Potassium |
1.54 ± 0.04 |
Sodium |
0.24 ± 0.02 |
Starch |
33.63 ±1.51 |
Sulfur |
0.41 ± 0.02 |
Total digestible nutrients |
74.81 ± 2.36 |
Dry Matter |
85.96 ± 0.68 |
Table 1 Nutrient composition (dry matter basis) of calf starter
Temperature and humidity data loggers (HOBO U23 Pro v2 External Temperature/Relative Humidity Data Logger U23-001, Onset, Bourne, MA) were placed inside each style of hutch as well as one outside the hutches at calf level to record ambient temperature and relative humidity. Temperature humidity index was determined using the following formula:10 THI = temperature (F) - [0.55 – (0.55 × relative humidity/100)] × [temperature (F) – 58.8]. Calf hutch THI was only evaluated when outside THI was > 25°C. A dearth of recent research stating when calves start to experience heat stress exists in the literature. The THI cutoff of 25°C was chosen based on information from The Pennsylvania State University (Table 1).11
Statistical analysis was performed in SAS (version 9.4, SAS Institute Inc., Cary, NC). The MEANS procedure was used to evaluate the mean, minimum, maximum, and SE of THI for each calf hutch design, each month. The MIXED procedure was used to evaluate fixed effects of hutch style, farm origin, and initial calf weight and their two-way interactions on weight gain. The GLM procedure was used to evaluate the fixed effect of hutch style on THI. The two-way interaction was tested and stepwise backward elimination was used to remove non-significant interactions (P ≥0.05). All main effects were kept in the model regardless of significance.
Calf performance of the calves housed in the four hutch styles is highlighted in Table 2. No significant weight change between the four hutch styles existed. Although, when the outside temperature humidity index was above 25oC, the THI between all hutches significantly differed (Table 3). Table four shows calf weight gain based on source farm. No significant differences existed in weight gain between calves sourced from different farms (Table 4).
|
Hutch style |
Weight gain, kg |
|
A1 |
60.32 ± 1.76a |
|
B2 |
59.93 ± 1.93a |
|
C3 |
57.09 ± 1.95a |
|
D4 |
57.31 ± 1.98a |
Table 2 Calf weight gain between four different calf hutch styles1–4
a,b denotes significant differences (P < 0.05)
1Hutch A (n = 31) had vents on the top of the rear wall
2Hutch B (n = 27) had an adjustable rear ventilation door
3Hutch C (n = 25) was similar to Hutch B but had 2 added circular vents on the rear wall of the hutch
4Hutch D (n = 26) was the same design as Hutch A but was elevated 15.24 cm in the rear by a custom lift
|
Hutch type |
Temperature humidity index |
|
A1 |
26.88 ± 0.06a |
|
B2 |
25.99 ± 0.09b |
|
C3 |
26.23 ± 0.06c |
|
D4 |
25.74 ± 0.07d |
Table 3 Temperature humidity index between four different calf hutch types 1–4 when temperature humidity index was > 25 oC
a,b,c,d denotes significant differences (P < 0.05)
1Hutch A (n = 31) had vents on the top of the rear wall
2Hutch B (n = 27) had an adjustable rear ventilation door
3Hutch C (n = 25) was similar to Hutch B but had 2 added circular vents on the rear wall of the hutch
4Hutch D (n = 26) was the same design as Hutch A but was raised 15.24 cm in the rear by a custom lift
|
Farm1 |
Weight gain, kg |
|
1 |
59.69 ± 1.39a |
|
2 |
58.58 ± 2.79a |
|
3 |
58.01 ± 1.28a |
Table 4 Calf weight gain between three different farms calves were sourced
a,b,c,d denotes significant differences (P < 0.05)
1Calves were sourced from 3 different farms located within 35 miles of the calf ranch
The results in this study align with results in similar studies. A study focused on calf performance based on hutch style, stated that the study yielded varied effects in weight gain12. In study group one the average daily gain was greater for calves in hutches covered in reflective material compared to calves in hutches without reflective material: 0.58 kg/d and 0.54 kg/d respectively. However, in the second study group there was not a difference in average daily gain between the two hutch styles. Weight gain similarities across the three different source farms was to be expected as we did not anticipate source farm would affect weight gain. The weight requirement for the study may have unintentionally caused no differences in weight gain for calves sourced from the different farms.
One reason significant differences did not exist in the current study may be due to management. Management on the calf ranch is rigid and all calves received the same care. Additionally, only calves within a certain weight range, at the beginning of the study, (32 to 42 kg) were used. The similar starting weight combined with consistent care may have caused calves to experience similar growth rate.
Hutch D had the lowest THI. Hutch D had the same rear ventilation design as hutch A, but was raised from the ground with a custom lift bar. The lower THI in Hutch D may have been a result of increased air flow through the hutch from the custom lift. The data indicates that hutch design does have an effect on the THI of the hutch. These differences are important for animal welfare. If hutches have increased air flow, resulting in a lesser THI, then animals may have increased welfare. Although differences existed between all hutch styles, the differences may only be statistically significant and not biologically significant as the differences did not vary drastically. Additional research is needed to determine the effect that THI has on the individual calf.
This study examined three main factors; impact of hutch type on calf performance, effect of hutch style on THI, and weight gain based on source farm. It was concluded that neither hutch type or source farm had a significant effect on calf performance. However, researchers found that the hutch type does have an effect on the THI of the calf hutch. Lesser THI was measured on the hutch design that had vent doors compared to rear wall vents. Additionally, the lowest THI was measured in the hutch that was raised. The research concluded that hutch design affects the THI of the hutch. It is believed that raised hutches allow for more air flow; therefore, lowering the THI within the hutch. Additional research is needed to determine the effect that THI has on the individual calf.
We send our sincerest thanks to the producer of the heifer grower operation for the use of his facilities and calves.
The authors declare that no conflicts of interest exist.

©2019 Reuscher, et al. This is an open access article distributed under the terms of the, which permits unrestricted use, distribution, and build upon your work non-commercially.