Journal of
eISSN: 2373-4345


Research Article Volume 8 Issue 5
1Department of Stomatology (Oral Pathology), Federal University of Goias, Brazil
2Department of Prevention and Oral Rehabilitation, Federal University of Goias, Brazil
Correspondence: Thiago Oliveira Sousa, Department of Stomatology (Oral Pathology), School of Dentistry, Federal University of Goias, Goiania, Brazil
Received: October 17, 2017 | Published: October 23, 2017
Citation: Sousa TO, Leles CR, Mendonca EF. Detection of bone mineral density changes by subtraction of cone-beam computed tomography images: a pilot study. J Dent Health Oral Disord Ther. 2017;8(5):575-580. DOI: 10.15406/jdhodt.2017.08.00295
The objective in this study was to investigate the feasibility of digital subtraction technique using cone beam computed tomography (CBCT) images to assess mineral density changes in dry mandibular bone tissue. A simulated procedure to mimic periapical bone loss was performed in 12 alveolar sockets of a dry mandible by controlled application of 0.1ml of a 70% perchloric acid solution. Digital periapical radiographs and CBCT exams were taken at baseline and after 2, 4 and 24hours. Simulated mineral gain was also performed in four alveolar sockets using a bone substitute in differing amounts (baseline, 0.07 and 0.14g) aggregated in a wax medium. All images were subtracted from baseline, resulting in four subtracted images (S0‒ S1‒ S2‒S3) for simulated bone loss and three subtracted images for mineral gain (S0‒ S1‒ S2) from periapical radiographs and CBCT. Quantitative analysis of mineral density was performed to assess pixel value changes in a grey scale ranging from 0 (black) to 255 (white) pixels. A gradual decrease in pixel values from S0 to S3 was observed in all images (p<0.001). Pairwise comparison between periapical radiographs and CBCT slices showed no significant differences, although the subtle changes in the S1 images (after 2hours) were less apparent in the periapical radiographs. A continuous progressive gain in mineral bone was also observed from baseline to S1 and S2. The results suggest that subtracted CBCT images can be used to monitor mineral bone changes based on the pixel grey values of images, with potential application for evaluation of bone repair.
Keywords: subtraction technique, cone‒beam computed tomography, bone repair
Bone repair is expected to occur as a consequence of treating bony lesions and after surgical procedures that result in different degrees of bone injury. This is a dynamic inflammatory process that involves both mineral bone loss and gain, resulting in continuous bone remodelling at the cellular level. This process consists in the removal of mineralized bone by osteoclasts followed by formation of new bone matrix through osteoblasts that subsequently become mineralized.1‒16 Subtle mineral bone changes are difficult to observe by visual analysis, thus changes in bone are usually monitored using sequential images taken by conventional radiograph methods or computerized tomography at different follow‒up periods. Other alternative method to monitor bone healing is the utilization of digital subtraction radiography (DSR) associated to computer‒assisted image processing. DSR has been used both in vitroand in clinical studies as a sensitive tool to monitor minor bone changes, including mineral loss and gain.9‒18 The DSR method is based on the digital alignment and superimposition of two radiographs of the same region obtained at different time.19 A subtracted image is produced using a specific software system algorithm that converts the two radiographic images into a homogeneous grey background of 128 pixels. Unchanged regions present grey pixel values close to 128, while higher values indicate mineral density gain and lower values are compatible with density loss.17‒20 DSR is commonly used for different purposes in dentistry and subtracted images can be obtained from conventional or digital radiographs. These two‒dimensional images of three‒dimensional structures can provide only limited information about a region of interest, due to superposition, inherent to bi‒dimensional radiographs, which leads to a limited three‒dimensional visualization at different depth levels. This fact has been a limitation of the routine use of subtraction technique in the clinical practice, once the evaluation of volumetric differences in three dimensions would be the ideal when monitoring bone repair. The use of CBCT allows three‒dimensional multiplanar sectional imaging and is increasingly used in dentistry due to its advantages such as the relatively low radiation dose, high‒resolution images, technical simplicity, and the good visualization of hard tissues.15‒22 However, subtraction technique has not been applied regularly to CBCT images in order to quantify mineral density changes. This new application would potentially increase the use of the subtraction technique by being associated with the higher image resolution provided by CBCT scans. Hence, the aim of this study was to investigate the feasibility of applying DSR to sectional images obtained by CBCT in order to evaluate changes in bone density by means of pixel value quantification.
Following local ethics committee approval (protocol number 225/12) a dried edentulous mandible was used. The regions of interest (ROI) corresponded to sixteen alveolar sockets with no teeth and presenting an uninjured bone surface. Two experimental assays were tested:
Four alveolar sockets (premolars) were used for induction of mineral gain and the remaining 12 alveolar sockets (molars, canines and incisors) were used to induce bone loss in the apical region. Digital periapical radiographs and CBCT images were obtained according to the experimental conditions of the study.
Induction of mineral density loss
After the baseline periapical radiography and CBCT were taken (T0), mineral density loss was induced by applying 70% perchloric acid on a cotton pellet inserted into each of the 12 alveolar sockets containing 0.1mL of the acid.14 Subsequently, the alveolar sockets were sealed with wax. After 2hours (T1), the pellet was removed, the alveolar sockets were thoroughly washed with distilled water and new radiographic and CBCT acquisitions were taken. The same procedures were repeated after 4 (T2) and 24hours (T3). Different times were chosen to test subtle density changes (T1 and T2) and the maximum bone loss possible (T3). Duplicate acquisitions were obtained at baseline in order to verify the reliability of the subtraction technique.
Induction of mineral density gain
In order to simulate mineral density gain, the alveolar sockets were initially filled with wax (baseline). In the subsequent image acquisitions, the alveolar sockets were filled with a biosynthetic bone substitute (composite osseous graft of bovine origin) (GenMix, Baumer, Mogi Mirim, São Paulo, Brazil) aggregated in wax. The grain size of the bone substitute ranged from 0.25 to 1.0mm, dosed in different quantities weighed on an electronic precision balance (BD‒300, Instrutherm, São Paulo, Brazil). Each quantity of bone was mixed with a melted wax matrix and added to each alveolar socket after complete removal of the wax of the first acquisition (baseline). Differently than in the loss induction, in which the alveolar sockets could lose mineral gradually, in the induction of mineral density gain, they were then classified according to the bone substitute quantity in grams: baseline (wax only ‒ Q0), 0.07g (Q1) and 0.14g (Q2).
Radiographic and tomographic acquisitions
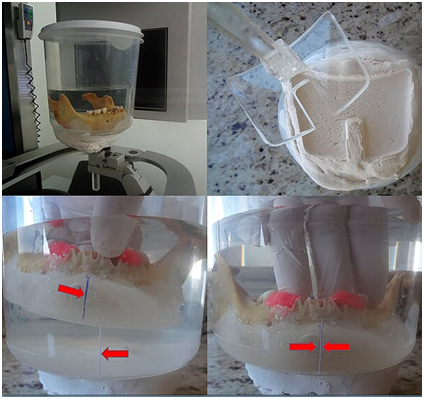
All radiographic images were taken using a periapical x‒ray device (Focus Cone 50540, Instrumentarium Dental, Tuusula, Etelä‒Suomi, Finland), 70 kVp, 7 mA, 0.16 s. A digital phosphor plate system (Dürr Dental, Bietgheim‒Bissingen, Ludwigsburg, German) was used for visualization, with sensors (dimensions 3x4cm) positioned within a radiography holder kit (Indusbello, Indústria de Instrumentos Odontológicos Ltda., Londrina, Paraná, Brazil) and a polyvinyl siloxane guide (Re'Cord, Harry J. Bosworth Company, Skokie Illinois, USA) to ensure geometric reproducibility. Image plates were scanned immediately after exposure and saved as uncompressed TIFF format. The CBCT images were acquired using the i‒CAT® unity (Imaging Sciences International, Hatfield, Pensylvannia, USA) set with the following protocol: 6cm field of view, 0.25mm voxel size and 40s, tube voltage 120 KVp and tube current 3.8mA. For reliable spatial positioning of the mandible, an acrylic resin base was constructed to allow it to fit into a plastic container. In order to simulate soft tissue and the influence of the scatter radiation, the plastic container was filled with distilled water,6‒13 and placed at the base of the CBCT device guided by a base made of gypsum (Figure 1).

Figure 1 Spatial stabilization of the mandible with acrylic resin, inside a container filled with distilled water and the detail of the gypsum base, used to stabilize the mandible and permit the same geometrical position. The lower images show how the acrylic base was aligned at the same position.
Image subtraction and quantitative analysis
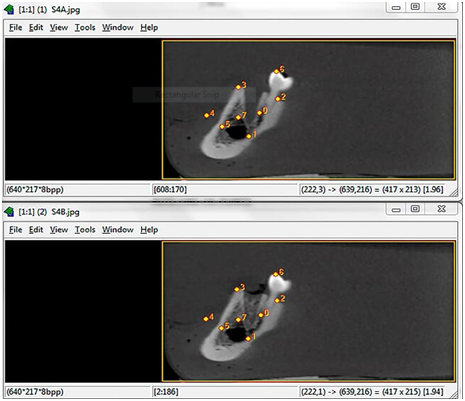
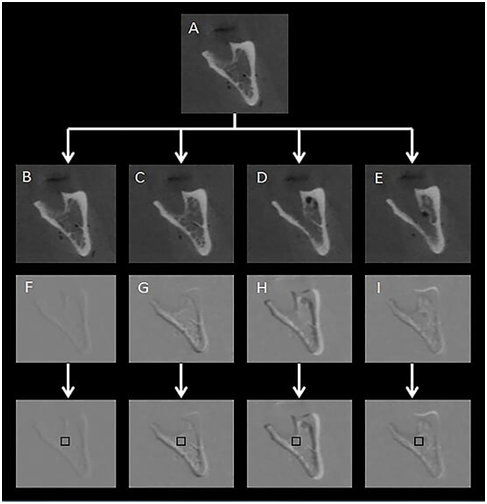
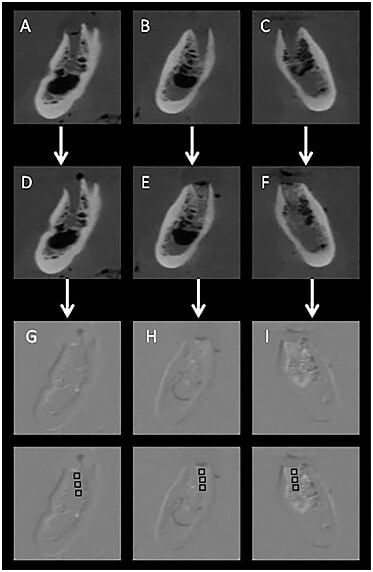
In order to detect loss or gain in mineral density in radiographs of chemically created but visually undetectable periapical lesions, the follow‒up images were subtracted from their respective baseline image. For mineral density loss, the subtraction procedure was as follows: T0‒T0, T1‒ T0, T2‒ T0 and T3‒ T0, resulting in four groups of subtracted images (S0, S1, S2 and S3). The ROI corresponded to the central region immediately below the periapical space in the apex of each alveolar socket, 1 mm below the periodontal cortical bone. Mean pixel values were measured in a 10 × 10 pixel area in the central part of the induced lesion as established in previous studies.17,18 For mineral density gain, subtraction was performed as follows: Q1‒Q0, Q2‒Q0. The 10x10pixel region of interest (ROI) was measured in the central portion of each of the three thirds of the alveolar socket (cervical, central and apical). All the digital periapical radiographic images were saved in tagged image file format (TIFF) 8‒bit. The tomographic images were saved in DICOM format and opened using ImageJ® software (ImageJ 1.37v, National Institute of Health, Bethesda, MD, USA). The most representative slices (central slice in each alveolar socket) from each previously determined region were selected and also saved in TIFF 8‒bit format in three projections: axial, coronal and sagittal. The slice number was identified on ImageJ® software and immediately registered. For the subsequent images of the same region, the volume was scrolled to the registered coordinates, to guarantee slices from the same region and in the respective projection. The Regeemy Image Registration and Mosaicking software (version 0.2.43‒RCB DPI‒INPE, São José dos Campos, São Paulo, Brazil) was used to perform the digital subtraction of the images. The software system algorithm converts unchanged pre‒ and post‒treatment images into a homogeneous grey background of 128pixels (subtracted image). Assessment of changes in the subtracted images permits a quantitative analysis of bone changes using pixel values in a grey scale ranging from 0 (white) to 255 (black). A cut‒off value of 128pixels, located midway between white and black, which discriminates mineral bone density loss (<128pixels) and gain (<128pixels).17,18 The software enables gamma correction in order to compensate for small changes in contrast and density, as well as anatomical alignment of the two images.23 The selection of the points was made based on anatomic marks (Figure 2). After subtraction, the subtracted images were also saved in the TIFF format (8‒bit). For analysis of subtle changes in mineral bone density the histogram tool in the software was used to provide a quantitative measure of the pixel grey values in each region of interest ROI, considering a grey scale of pixels. The X/Y coordinates were used to reproduce the same position of the ROI in all subtracted images. All the images were analysed by one experienced Radiologist, previously calibrated. Figures 3&4 illustrate the image sequence for assessing changes in pixel grey values in the areas of simulated mineral density loss and gain, respectively, using CBCT subtracted images. Mineral density variation on the radiographs can be observed in the Figures 5&6.

Figure 2 Screen capture of Regeemy Image Registration and Mosaicking software showing the automatic alignment process of 2 sagittal images from the same alveolar socket, which is based in landmarks precisely detected and confirmed numerically by the software. The upper slice shows an alveolar socket filled with wax only and the lower a Q2 concentration.

Figure 3 Coronal slice through the alveolar socket of the left second molar. A: Sequence of CBCT images of simulated periapical bone loss by controlled application of 0.1 ml of a 70% perchloric acid solution at baseline; B: after 2, 4 and 24hours (C to E). The subsequent subtracted images S0 (F), S1 (G), S2 (H) and S3 (I) and the corresponding ROIs for quantitative pixel grey value evaluation are also presented.

Figure 4 Coronal CBCT images of 3 different alveolar sockets (premolar regions from the same specimen) showing the progressive mineral gain in terms of pixel grey values from baseline (A,B,C) and after filling with different quantities of bone substitute: D: baseline-no filling; E: 0.07g; F: 0.14g, followed by the respective subtracted images; G,H & I: ROI schemes for measuring the increase in mineral density in the center of each third of the alveolar socket (cervical, central and apical).
MedCalc Software version 12.4.0 (MedCalc Software, Ostend, Belgium) was used for statistical analysis. Data are expressed as the mean and standard deviation of the pixel values and the confidence interval was set at 95%. The subtracted digital periapical images (periapical digital radiography) were considered as the reference method for comparison with CBCT subtracted images (CBCT axial, coronal and sagittal slices). The comparison of different types of images and different subtracted images (S0, S1, S2, S3) for simulated bone loss was performed using repeated‒measures ANOVA to test within‒group and between‒groups effects. The Bonferroni test was used for between‒groups contrasts. The level of significance for rejecting the null hypothesis was 0.05.
There were marked changes in both mineral loss and gain under the tested experimental conditions. Figure 7 shows the measures of pixel grey values in the experimental mineral density loss test, according to the subtracted images (S0 to S3) in periapical radiography and CBCT images in sagittal, axial and coronal slices. There was a significant decrease in mineral density (from S0 to S3) for the subtracted radiographs and CBCT scans (p<0.001). The image versus method interaction was also statistically significant (p=0.003). The between‒groups comparison (p=0.023) showed significant difference between the subtracted radiograph and the coronal slice (mean difference=5.87 pixels; p=0.033). Figure 8 depicts the values of the induction of mineral density gain in pixel grey values measured in the subtracted images (S0, S1 and S2), according to the image type and the bone substitute quantity in grams (Q0, Q1 and Q2). In all imaging methods there was an increase in mineral density in Q1 and Q2 compared to the homogeneous grey background of 128 pixels (Q0). Higher Q1 and Q2 values were observed in the axial and coronal CBCT scans.

Figure 7 Mean and 95%CI of pixel grey values in the simulation of mineral density loss according to the subtracted images (S0 to S3). The solid lines represent the periapical radiographic image values and the dashed lines represent the CBCT measurements for sagittal (left), axial (centre) and coronal (right) slices.
Several in vitro and in vivo studies have focused on monitoring bone healing. However, to the best of the authors’ knowledge, this is the first study to assess pixel values from sectional images from CBCT obtained by DSR. Our results show that experimentally induced mineral density changes can be quantitatively measured using DSR under controlled conditions. Earlier studies have shown that chemically induced lesions can be detected in periapical images, even in the case of short‒term acid exposure.7‒14 Our study proposed a method that permitted the detection of the progression of incipient lesions with subtle mineral loss, as well as subtle changes in mineral bone gain that would be detectable in remodelling bone repair process. These slight changes, which could be hardly detected in visual analysis by the naked eye,24 were identified and quantitatively measured by means of pixel grey values using both CBCT and digital periapical images. The patterns of mineral changes detected in both CBCT and periapical images were similar, which may be justified by the fact that CBCT is a type of exam that produces minimal distortion in the final image.25 and is a suitable option for analysing bone mass, being as feasible as periapical radiographs for the DSR technique.17,18 Economomopoulos et al.26 presented a method for automatically aligning 3D CBCT dental data sets. This proposed method was able to evaluate volumetric differences between data sets. In our study it was possible to detect subtle changes in bone density at the periapical region using quantitative pixel measurement in CBCT images, and periapical radiography as reference method. In this study, when analysing the decrease in pixel values throughout the sequential subtractions, CBCT values were slightly lower than those from periapical radiographs, possibly due to the fact that conventional digital radiographic images show bone structures overlapping (sound and injured bone). Considering that the CBCT slices were obtained from the central regions of alveolar sockets (coronal and sagittal) and immediately below (in axial slices), the second image tended to record the central portion of the lesion in 0.25mm thick slices, with no superimposition of intact bone and consequent lowering of the pixel grey values. This feature is in accordance with Sogur et al,27 who compared CBCT and periapical (conventional and phosphor plate system) images in order to investigate the detectability of chemically induced lesions. They concluded that a larger volume of bone loss is required before periapical radiolucency becomes evident on a radiographic film or digital periapical image. The homogeneity in pixel grey values at baseline (for both bone gain and loss) occurred because the initial subtracted image was obtained from specimens without any bone substitute or acid exposition. Conversely, greater variability was observed in the subsequent subtracted images. Haiter‒Neto & Wenzel.2 pointed out that the more shades of grey there are in a histogram, the more noise there will be in the subtracted radiographic image and the larger the standard deviation. Hence, the highest variability in the values in induced bone loss were found in groups of radiographs, probably due to the size of the images: a single radiographic image has greater resolution than a CBCT slice and, consequently, a greater number of pixels and a larger range of pixel values. Bornstein et al.28 compared the efficacy of periapical radiography and CBCT imaging in detecting periapical lesions in mandibular molars referred for apical surgery. The study showed that 25.9% of lesions detected by sagittal CBCT sections were not detected by periapical radiography. It was also concluded that periapical radiography underestimates the true extent of lesions compared with coronal and sagittal CBTC slices. Estrela et al.29 also observed that CBCT was a more reliable diagnostic method to identify apical periodontitis. Accuracy analysis showed that periapical lesions were correctly identified in 54.5% of the cases with periapical radiographs and in 27.8% of the cases with panoramic radiographs; in most cases, they were correctly identified using conventional methods only when in an advanced stage. In order to obtain a grey scale in CBCT, several studies.9‒14 have tried to correlate.4‒11 or derive.2‒30 Hounsfield Units (HU) values in CBCT exams. Considering the larger amount of scattered X‒rays in CBCT compared to CBCT acquisitions, it was stated that HU values in CBCT cannot be considered a valid method for quantifying mineral density.31 In our study it was not used a large grey scale such as the HU scale. An 8‒bit scale was used instead, which means that all images were converted into a smaller range pixel gray scale, containing 256 shades of grey, ranging from 0 (black) to 255 (white).28 However, even not using HU measurements, it is important to consider the instability of grey values when dealing with CBCT acquisitions. Nevertheless, we found a satisfactory correspondence for measurements of mineral bone changes when converting the images into 8‒bit system images from both CBCT exams and periapical radiographs. The improved diagnostic performance of CBCT exams observed in clinical studies emphasizes the relevance of exploring different strategies using 3‒dimensional evaluation with the DSR technique. DSR has already been reported previously in the context of bidimensional examinations, being considered a non‒invasive method to evaluate longitudinal mineral changes.17‒32 For patients with extensive bone lesions in which bone repair is expected to occur, CBCT is frequently used as a tool in monitoring bone healing and new methodology has been proposed to obtain a satisfactory alignment between structure to be monitored.27‒33 however, more studies are needed to strengthen the use of DSR in CBCT images. There is no doubt that visual image analysis presents some disadvantages like the inability to detect initial bone loss.19 and misinterpretation due to the subjectivity inherent in image interpretation,7‒12 which can be overcome by an objective quantitative assessment using pixel grey values.
In conclusion, this exploratory in vitro study showed promising results concerning the quantification of pixel values during bone repair processes using DSR on CBCT sectional images. However, although this pilot study provided support for new studies using subtracted CBCT images to monitor bone repair in clinical situations, it is important to recognize that the results of in vitro studies cannot be extrapolated uncritically to in vivo situations, which emphasizes the need for further clinical studies.
None.
The author declares that there is no conflict of interest.
None.

©2017 Sousa, et al. This is an open access article distributed under the terms of the, which permits unrestricted use, distribution, and build upon your work non-commercially.