Journal of
eISSN: 2373-4396


Research Article Volume 7 Issue 3
Division of Pediatric Cardiology, National Cerebral and Cardiovascular Center, Japan
Correspondence: Masaki Nii, Division of Cardiology, Shizuoka Childrens Hospital, 860 Urushiyama, Aoi-ku, Shizuoka 420-8660, Japan, Tel +81-54-247-6251, Fax +81-54-248-4763
Received: December 02, 2016 | Published: December 6, 2016
Citation: Masaki N, Soumura J, Kitano M, Yazaki S, Kurosaki K, et al. (2016) Intrinsic Diastolic Function Determines Left Ventricular Volume Increment after Transcatheter Atrial Septal Defect Occlusion. J Cardiol Curr Res 7(3): 00249 DOI: 10.15406/jccr.2016.07.00249
Background: Transcatheter atrial septal defect occlusion (ASO) results in increased end-diastolic and stroke volume of left ventricle (LV), thereby improving exercise capacity in the chronic phase. However, not all patients demonstrate LV volume dilation after ASO. The aim of this study is to assess the change of LV volume after ASO and the relationship between the diastolic LV function and the grade of LV volume expansion after ASO.
Methods: Thirty-five patients (median, 19.2 years; range, 6.9–67.5) who underwent successful ASO and sequential LV volume analyses using real-time three-dimensional echocardiography were included in this study. LV volume and LV diastolic function were assessed at baseline, at 48 hours, and at 3 months after ASO. Serum concentrations of natriuretic peptides were measured simultaneously.
Results: LV end-diastolic volume index was 40.8 (25.6–62.9) ml/m2 at baseline, 45.5 (26.1–72.5) (p<0.05) at 48 hours and 53.4 (36.9–70.9) at 3 months (p<0.001). Group#1 (n=18) included those with significant increase of LV volume after ASO at 48 hours, while Group#2 (n=17) included those without LV volume change. LV inflow-E/A was significantly lower and pulmonary venous-S/D was significantly higher in Group#2 (E/A: 1.9 (0.8-3.6); S/D: 1.2 (0.9-1.8)) than in Group#1 (E/A: 2.9 (1.4–4.3); S/D: 0.9 (0.7–1.3)), and this difference persisted in the chronic phase after ASO. Serum atrial natriuretic peptide at 48 hours was significantly higher in Group#2 (25.6 (12.0–54.0) pg/ml) than in Group#1 (18.1 (7.1–33.1)). These results suggest the acute response of LV volume is significantly influenced by the intrinsic LV diastolic function, and the significantly high serum atrial natriuretic peptide concentration in Group#2 at acute phase might be caused by the increased left atrial pressure after ASO due to relatively reduced diastolic function of LV in this group.
Conclusion: Nearly half patients after ASO showed no LV expansion in the acute phase, and the intrinsic diastolic LV function determines the acute response in LV volume after ASO.
Keywords: Real-time three-dimensional echocardiography; Left ventricular inflow; Pulmonary venous flow; Natriuretic peptide; Atrial septal defect; Transcatheter atrial septal defect occlusion; Diastolic function
Left ventricular (LV) end-diastolic volume and stroke volume is subnormal in patients with atrial sepal defect (ASD) [1-4]. However, the etiology of abnormal LV function associated with ASD and/or right ventricular (RV) volume overload, which is referred as a reversed Bernheim effect [1-3] is not known yet. Satoh et al. postulated that left to right shunt at the atrial level during early diastole shifts the interventricular septum leftward, resulting in impaired decline of the early LV diastolic pressure (i.e., prolongation of Tau) [5]. However, Ewert et al. [6] reported that some patients develop an acute increase in left atrial pressure during balloon ASD occlusion, suggesting that the ventricular septal shift due to atrial shunt is not the only cause of LV diastolic dysfunction [6,7], and the chronic LV underfilling may cause intrinsic diastolic dysfunction in some patients with ASD.
The increment of end-diastolic LV volume (LVEDV) and stroke volume (LVSV) after transcatheter ASD occlusion (ASO) is the main determinant of improvement in exercise tolerance after ASO [8]. However, the degree of expansion in LVEDV and LVSV may be limited in patients with intrinsic diastolic dysfunction of LV. Thus, this study assessed the change in LV volume and plasma natriuretic peptides after transcatheter ASO and determined the influence of LV diastolic function on LV volume expansion after ASO. This study utilized real-time three-dimensional echocardiography (RT3DE), which enables more accurate measurement of LV volume than conventional two-dimensional methods and thereby detects subtle changes in LV volume [9].
Study population
Thirty-eight consecutive patients with ASD underwent ASO using the Amplatzer septal occluder (AGA Medical, Plymouth, MN, USA) at the National Cerebral and Cardiovascular Center of Japan between November 1st, 2005 and December 31st, 2006. All patients underwent chest radiography, 12-lead electrocardiography, and transthoracic and transesophageal echocardiography before device closure to confirm the diagnosis and indication. Patients with other congenital cardiac anomalies or renal dysfunction were excluded from this study. ASO was performed under general anesthesia in all patients, and the hemodynamic data were obtained with standard fluid-filled catheters before closure. The pulmonary to systemic flow ratio was calculated using the Fick principle. Written informed consent was obtained from all patients, and the study protocol was reviewed and approved by the institutional committee on human research at the National Cerebral and Cardiovascular Center.
Echocardiography
Participants underwent two-dimensional echocardiography, pulsed Doppler, and RT3DE on the day before ASO, and at 48 hours and 3 months after ASO. All echocardiographic determinations were performed by a single observer (M.N.) using a commercially available machine (IE33; Philips Medical Systems, Andover, MA, USA). A 2-5 MHz transducer was used for two-dimensional and pulsed Doppler study, and a X4 matrix-array probe was used for RT3DE study. Images were stored on the hard disk of the echocardiographic machine for later analysis.
Two-dimensional, M-mode and pulsed Doppler echocardiographic examinations were carried out according to the guidelines of the American Society of Echocardiography [10]. Pulsed Doppler velocity recordings from three consecutive cardiac cycles were used to derive measurements as follows: trans-mitral LV-E and LV-A velocity was the peak value reached in early diastole and after atrial contraction, respectively, and deceleration time was the interval from the LV-E wave peak to the decline of the velocity to baseline. In addition, pulmonary venous systolic and diastolic wave velocities were obtained as the maximal values reached during the respective phase of the cardiac cycle, and the pulmonary venous atrial-reversal was the maximal velocity of retrograde flow into the pulmonary vein after the P wave of the electrocardiogram. Flow velocities of RV inflow, main pulmonary artery and ascending aorta were also recorded. Tei-indices for RV and LV were calculated from the average values as per the formula: Tei = (isovolumic contraction time + isovolumic relaxation time) / ejection time [11]. RT3DE image acquisition was performed from an apical window with the LV as a region of interest. To encompass the complete LV into the 3D dataset, a full volume (93° ´ 84°) scan was acquired in harmonic mode from four R-wave triggered subvolumes (93° ´ 21°) during an end-expiratory breath hold. The 3D data saved on the hard disk was transferred to a separate workstation for off-line analysis. Semi-automated border detection LV volume analysis was performed using QLAB version 4.2 (Philips Medical Systems), where volume quantitation starts by defining the proper four-chamber view and adjusting orthogonal views to avoid foreshortening of the LV cavity [12]. Then, it was assured that the intersection point of the displayed horizontal and vertical lines was in the middle of the LV cavity, and the end-diastolic and end-systolic frames were identified. By setting the five points (septal, lateral, anterior, and inferior mitral annulus and the apex) manually on end-diastolic and end-systolic frames, this software automatically delineates the LV endocardial border and sequentially creates a LV mathematical model and calculates LV volume throughout one cardiac cycle. Unsatisfactory delineation of the endocardial border was manually adjusted.
The following formulae were used for calculations:
Blood tests
All patients underwent blood test sampling for measurement of plasma concentrations of natriuretic peptides at the time of the echocardiographic examinations. The brain natriuretic peptide (BNP) and atrial natriuretic peptide (ANP) were measured by enzyme-linked immunosorbent assay using commercially available kits.
Reproducibility
Intraobserver variability was assessed in a randomly selected subset of 10 patients by repeating RT3DE measurements on separate occasions. To test the interobserver variability, all RT3DE measurements of 10 randomly selected patients were performed by a second observer (J.S.) who was blinded to the results of the initial echocardiographic results. Inter- and intraobserver variability was expressed as the percentage of difference between two measurements divided by the average of the two measurements.
Statistical analysis
Results are expressed as median (range). Statistical analyses were performed with the Statistical Package for Social Science (SPSS Inc., Chicago, IL, USA). The Mann-Whitney test was used for statistical analysis between groups, and the Kruskal-Wallis test was used to compare differences between baseline, 48 hours after ASO, and 3 months after ASO. Univariate comparisons for categorical variables were calculated with Fisher’s exact test. P<0.05 was considered statistically significant.
Patients and measurements
Thirty-eight devices were successfully deployed in 38 patients, of whom 35 patients with appropriate RT3DE image quality were enrolled in this study for analysis (12 men, 23 women; mean age, 19.2 years; age range, 6.9–67.5 years). All subjects enrolled in this study had no significant aortic or mitral valve insufficiency. The exclusion criteria in regards to the RT3DE data set included evidence of multiple LV segments that could not be well visualized or the presence of significant translational artifact. Demographic and cardiac catheterization data of the study patients are summarized in Table 1.
Male/Female |
12/13 |
Age |
19.2 (6.9–67.5) |
Weight (kg) |
53.0 (20.4–83.3) |
Height (cm) |
156.0 (124.5–183.0) |
BSA (m2) |
1.51 (0.85–1.84) |
HR (bpm) |
65 (50–94) |
Qp/Qs |
2.46 (1.24–4.00) |
RVSP (mmHg) |
26 (20–46) |
RVEDP (mmHg) |
8 (2–11) |
LVSP (mmHg) |
89 (70–112) |
LVEDP (mmHg) |
10 (6–13) |
Table 1: Demographic and Catheterization Data at Baseline (n=35).
Data are presented as number or median value (range).
bpm: Beats Per Minute; BSA: Body Surface Area; HR: Heart Rate; LVEDP: Left Ventricular End-Diastolic Pressure; LVSP: Left Ventricular Systolic Pressure; Qp/Qs: Pulmonary to Systemic Flow Ratio; RVEDP: Right Ventricular End-Diastolic Pressure; RVSP: Right Ventricular Systolic Pressure
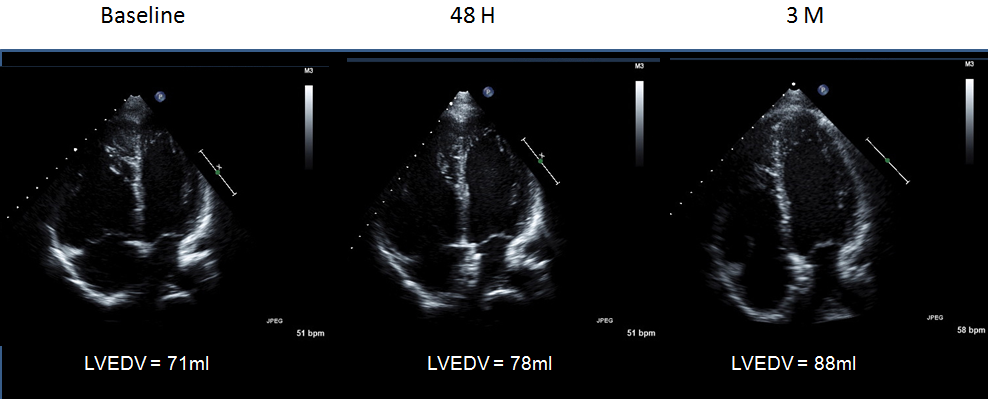
All patients completed the 48-hour follow-up study, and 26 patients completed the 3-month follow-up study. A representative four-chamber view image from a patient with ASD after ASO is shown in Figure 1. Intraobserver variability was 8.2%, and interobserver variability was 11.7%.
Left ventricular volume by RT3DE
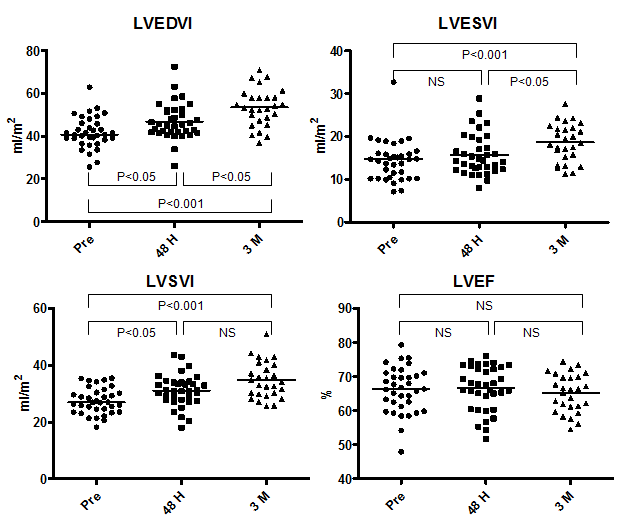
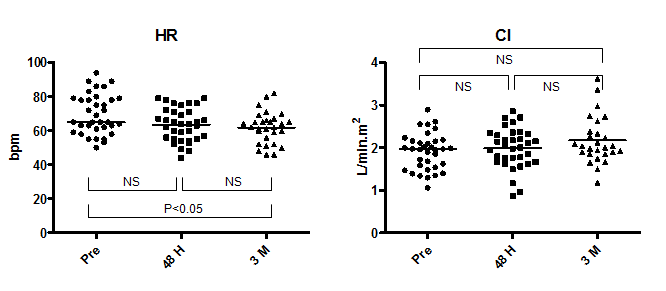
The median LVEDV index and LVESV index before ASO was 40.8 ml/m2 (range, 25.6–62.9 ml/m2) and 14.7 ml/m2 (range, 7.1–32.7 ml/m2), respectively (Figure 2). The median LVSV index and LVEF before ASO was 27.0 ml/m2 (range, 18.2–35.5 ml/m2) and 66.4% (range, 48.0–79.4%), respectively. There was a significant increase in LVEDV index and LVSV index (LVEDV index, 45.5; range, 26.1–72.5) and in LVSV index (31.0; range, 18.1–43.6) at 48 hours after ASO; the average increment was +13.0% and +13.5%, respectively. During the chronic phase, LVEDV index increased further to 53.4 ml/m2 (range, 36.9–70.9 ml/m2) with an average increment of +17.0% from the 48-hour time point and a total increment from baseline of +28.9%. As LVESV index showed a significant increase during the chronic phase from 14.4 ml/m2 (range, 8.0–28.9 ml/m2) at 48 hours to 18.5 ml/m2 (range, 11.2–27.6 ml/m2) at 3 months, the change in LVSV index (34.1 ml/m2; range, 25.6–50.9 ml/m2 at 3 months) during this phase was not significant, but the increment from baseline was significant (P<0.001). The median LVEF remained unchanged during follow-up (66.4% (range, 48.0–79.4%) at baseline, 67.5% (range, 51.6–76.0%) at 48 hours, and 66.3% (range, 54.5–74.5%) at 3 months. In contrast, heart rate (HR) decreased from 65 bpm (range, 50–94 bpm) at baseline to 64 bpm (range, 44–79 bpm) at 48 hours (P=NS) and to 62 bpm (range, 46–82 bpm) at 3 months (48 hours vs. 3 months: P=NS; baseline vs. 3 months: P<0.05) (Figure 3). Despite the increase in LVSV index after ASO, the simultaneous decline of HR resulted in maintenance of CI during the follow-up period (2.0 L/min.m2 (range, 1.1–2.9 L/min.m2) at baseline, 2.0 L/min.m2 (range, 0.9–2.9 L/min.m2) at 48 hours, and 2.0 L/min.m2 (range, 1.2–3.6 L/min.m2) at 3 months).
Plasma BNP and ANP levels
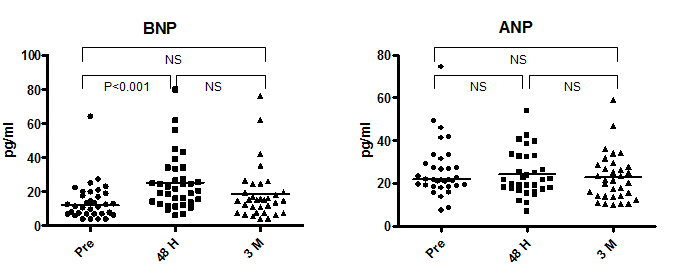
The median plasma BNP and ANP levels before ASO were 12.1 pg/ml (range, 4.0–64.3 pg/ml) and 21.8 pg/ml (range, 7.6–74.5 pg/ml), respectively (Figure 4). The BNP increased significantly at 48 hours (21.8 pg/ml (range, 6.3–80.1 pg/ml vs. baseline: P<0.01) and returned to baseline levels at 3 months (15.0 pg/ml (range, 4.0–76.2 pg/ml) vs. 48-hour P=NS; vs. baseline P=NS). The ANP showed no significant change during follow-up (21.8 pg/ml (range, 7.1–54 pg/ml) at 48 hours, and 21.5 pg/ml (range, 10.2–59 pg/ml) at 3 months).
Degree of LV volume expansion after ASO and its relationship with diastolic function
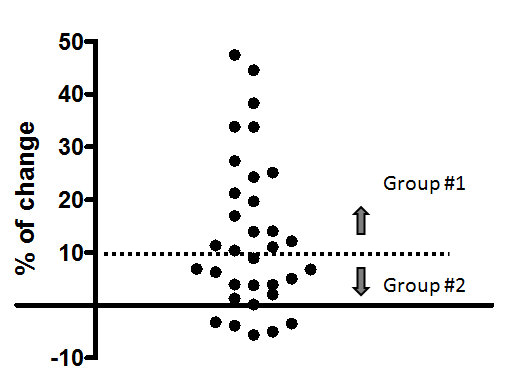
The change in LVEDV in the acute phase after ASO varied among patients; some patients demonstrated no increment in LVEDV after ASO (Figure 5). Thus, patients were categorized into two different groups according to the grade of increment in LVEDV at 48 hours after ASO. Based on the result of reproducibility of RT3DE LV volume measurement in this study (8.2–11.7%), a cut-off value was set at 10%. Group #1 consisted of patients with more than 10% increase in LVEDV at 48 hours after ASO (n=18; 7 men, 11 women), and Group #2 consisted of those with less than 10% increase in LVEDV after ASO (n=17; 5 men, 12 women). Table 2 shows the demographic, hemodynamic and plasma natriuretic peptide data before ASO in these two groups. LV-A was significantly higher and LV-E/A was significantly lower in Group #2 than in Group #1. Pulmonary venous S-wave velocity and S/D was significantly higher in Group #2 than in Group #1. The difference of LV-E/A between the two groups persisted even in the chronic phase after ASO (Figure 6). Pulmonary venous S/D was also significantly higher in the chronic phase (Figure 6). Serum ANP and BNP levels were relatively higher in Group #2, but this difference was only significant in ANP at 48 hours (Group #1: 18.1 pg/ml (range, 7.1–33.1 pg/ml); Group #2: 25.6 pg/ml (range, 12–54 pg/ml); P<0.01) (Figure 7). There was no difference in RV end-diastolic dimension, RV Tei-index, or RVEDP when comparing the two groups (Table 2). LVEDV index was not different when comparing the two groups at baseline but was significantly higher at 48 hours after ASO in Group #1 when compared with Group #2, mainly due to the absence of increment in LVEDV in Group #2 and the significant increment in LVEDV in Group #1 (Figure 8). However, this difference resolved in the chronic phase. CI was not different when comparing the two groups at any of the time points.
Group #1 (n = 18) |
Group #2 (n = 17) |
P-value |
|
Age |
16.8 (10.8–44.3) |
22.8 (6.9–67.5%) |
NS |
Male (%) |
39 |
29 |
NS |
Weight (kg) |
53.0 (30.4–67.0) |
51.7 (20.4–83.3) |
NS |
Height (cm) |
156.0 (140.5–174.0) |
156.7 (124.5–183.0) |
NS |
BSA (m2) |
1.51 (1.11–1.77) |
1.50 (0.85– 1.84) |
NS |
HR (bpm) |
72 (50–94) |
65 (55–86) |
NS |
Qp/Qs |
2.22 (1.50–4.00) |
2.73 (1.24–3.64) |
NS |
RVSP (mmHg) |
27 (20–46) |
26 (20–35) |
NS |
RVEDP (mmHg) |
8 (5–11) |
8 (2–11) |
NS |
LVSP (mmHg) |
91 (79–112) |
85 (70–103) |
NS |
LVEDP (mmHg) |
10 (8–13) |
9 (6–12) |
NS |
RVDd (mm) |
31.4 (21.4–45.3) |
30.0 (20.5–47.0) |
NS |
RV-Tei index |
0.14 (0.01–0.28) |
0.18 (0.01–0.56) |
NS |
LV-Tei index |
0.30 (0.10–0.56) |
0.29 (0.15–0.42) |
NS |
E (cm/s) |
105 (75–133) |
101 (68–138) |
NS |
A (cm/s) |
34 (25–66) |
57 (37–86) |
P<0.01 |
E/A |
2.9 (1.4–4.3) |
1.9 (0.8–3.6) |
P<0.05 |
LV DT (ms) |
224 (143–366) |
215 (164–296) |
NS |
PVF S (cm/s) |
60 (40–89) |
75 (58–117) |
P<0.01 |
PVF D (cm/s) |
66 (41–100) |
63 (36–119) |
NS |
PVF S/D |
0.9 (0.7–1.3) |
1.2 (0.9–1.8) |
P<0.001 |
PVF AR (cm/s) |
24 (20 -39) |
29 (20–43) |
NS |
BNP (pg/ml) |
9.0 (4.0–22.5) |
14.2 (6.1–64.3) |
NS |
ANP (pg/ml) |
21.5 (7.6–41.2) |
25.0 (17.9–74.5) |
P<0.05 |
Table 2: Baseline Demographic, Catheterization, and Echocardiographic Data of Patients in Group #1 and Group #2.
Data are presented as median value (range) or number (%).
A: Late Trans-Mitral Flow Velocity; AR: Atrial Reversal Flow Velocity; BSA: Body Surface Area; BNP: Brain Natriuretic Peptide; D: Diastolic Pulmonary Venous Flow Velocity; E: Early Trans-Mitral Flow Velocity; ANP: Human Atrial Natriuretic Peptide; LV: Left Ventricle; LVEDP: Left Ventricular End-Diastolic Pressure; LVSP: Left Ventricular Systolic Pressure; PVF: Pulmonary Venous Flow; Qp/Qs: Pulmonary to Systemic Flow Ratio; RV: Right Ventricle; RVEDP: Right Ventricular End-Diastolic Pressure; RVSP: Right Ventricular Systolic Pressure; S: Systolic Pulmonary Venous Flow Velocity.
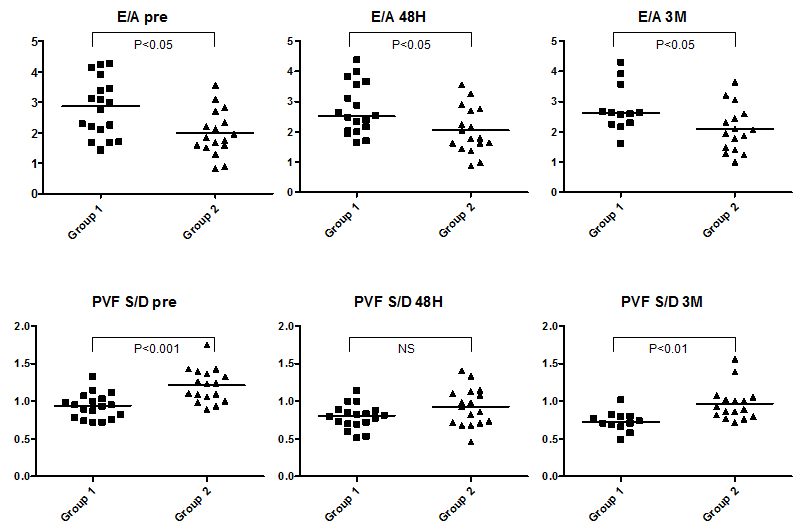
A left to right shunt at the atrial level in patients with ASD causes RV volume overload and LV underfilling. Correction of ASD shunt by ASO causes an acute reduction of preload on RV and a simultaneous acute increase of preload on LV. The increment in LV volume after ASO leads to an increase in LVSV and cardiac output, thereby improving exercise tolerance [8,13]. The present study demonstrated a +12% increase in LVEDV at 48 hours after ASO and a further +14% increase at 3 months after ASO; the increment between baseline and 3 month after ASO was +28%. In contrast, heart rate decreased significantly after ASO, and the CI remained stable in the acute and chronic phase. There was also a significant increase in BNP at 48 hours after ASO, supposedly due to the acute volume load on the LV, and it returned to the baseline range at 3 months, which is consistent with results from previous reports [14]. By contrast, ANP did not change after ASO. All patients in this study tolerated the abrupt ASO-induced hemodynamic change without any symptoms. However, LV volume did not increase at 48 hours in nearly half of patients (Group #2), and these patients had significantly lower LV-E/A and higher pulmonary venous S/D ratio when compared with those patients that demonstrated an acute increment in LV volume (Group #1). Although the LV dilated gradually in the chronic phase in Group #2 and LV volume was similar to that of Group #1 at 3 months, the difference in LV-E/A and pulmonary venous S/D ratio persisted even at 3 months after ASO. This result supports the existence of an intrinsic difference of LV diastolic function between the two groups, which may be related to the degree of LV expansion in early phase after ASO.
The precise etiology of LV diastolic dysfunction in patients with ASD remains controversial. Dexter suggested that RV dilation leading to the leftward shift of the ventricular septum and subsequent LV compression is responsible for LV failure occasionally observed in patients with ASD; this phenomenon is known as the “reversed Bernheim effect” [3]. In an experimental study, Kelly et al. [15] demonstrated that chronic RV volume and pressure overload displaces the pressure-volume curve of LV to the left, toward smaller volumes and decreased compliance [15]. These changes resolved when the RV was empty, and he concluded that the intrinsic LV function is not altered and that the change of pressure-volume curve in the LV is due solely to the effects of RV volume overload. Satoh et al. [5] demonstrated impaired LV relaxation in patients with ASD [5] by showing prolongation of isovolumetric relaxation time and Tau in patients with large shunt. Further, there was a significant positive correlation between Tau and RV end-diastolic pressure. As the shunt through ASD is mainly observed from mid-systole to early-diastole, the RV expands to a greater extent than the LV during these phases and shifts the ventricular septum toward the LV [16]. The leftwards shift of the ventricular septum during early diastole impedes the pressure decline in the LV, resulting in impairment of ventricular relaxation [5].
Most studies demonstrating an impairment in diastolic LV function in patients with ASD conclude that it results from the interaction of both ventricles in a limited pericardial space and that intrinsic LV function was not impaired [4,5,15]. However, it had been difficult to observe the acute change of interaction of both ventricles after ASD closure by open-heart surgery. The ASO enables closure of ASD without opening the pericardium and there are some reports of patients with ASD having developed pulmonary venous edema after ASO [6,7]. Ewert et al. [6] demonstrated the presence of intrinsic LV diastolic dysfunction in some patients with ASD by eliminating the shunt flow using a balloon-catheter, revealing that some patients had significant elevation of left atrial pressure during balloon ASD occlusion, which may represent a contraindication to ASO [6]. This study showed that the shift of the ventricular septum due to ASD shunt flow is not the primary cause of LV diastolic dysfunction in these patients; rather, the intrinsic LV diastolic function or continuing RV dilation or dysfunction, even after shunt occlusion, may determine whether symptoms arise after ASO. Masutani et al. [17] demonstrated that patients with low early diastolic mitral annular velocity before ASO developed exertional dyspnea after ASO [17], which supports a close relationship between intrinsic LV diastolic dysfunction and pulmonary congestion after ASO. In our study, none of the patients developed congestive heart failure after ASO. However, serum ANP concentration was significantly higher at 48 hours in Group #2 than in Group #1, suggesting an elevation in left atrial pressure and wall tension in Group #2. Since the LV-E/A in the patients of Group #2 was mostly within the normal range, it is inappropriate to state that diastolic dysfunction was present in Group #2; rather, this result indicates that the patients with better diastolic function are more likely to tolerate ASO because the LV can rapidly expand its volume after ASO. By contrast, patients with relatively diminished diastolic function require longer time for the LV to adapt and expand its volume. The RV dimension and RV-Tei index were not significantly different between the groups, suggesting that the size or function of the RV did not have a significant influence on LV expansion after ASO. These observations account for the fact that the improvement of exercise capacity after ASO is delayed in some patients [13,14].
ASO induces a 12% LV volume expansion in the acute phase, with an additional 14% LV volume expansion in the chronic phase. The degree of intrinsic LV diastolic function determines the degree of LV expansion after ASO in acute phase. However, in patients without an acute increment in LV volume, the LV dilates gradually, reaching its full potential for expansion in the chronic phase. This may explain why some patients experience a delay in improvement in exercise capacity after ASO.

©2016 Masaki, et al. This is an open access article distributed under the terms of the, which permits unrestricted use, distribution, and build upon your work non-commercially.