Journal of
eISSN: 2373-4396


Research Article Volume 6 Issue 1
From the Division of Cardiology, Newark Beth Israel Medical Center, USA
Correspondence: ajam Wasty, Department of Cardiology C2, Newark Beth Israel Medical Center, 201 Lyons Avenue at Osborne Terrace, Newark, New Jersey, 07112, USA, Tel 973:926:7852, Fax 973:283:0839
Received: June 03, 2016 | Published: June 21, 2016
Citation: Tayal R, Barvalia M, Azim K, Seliem A, Weinberg A, et al. (2016) Determinants of Type II and Type III Aortic Arch in Humans. J Cardiol Curr Res 6(1): 00191. DOI: 10.15406/jccr.2016.06.00191
Introduction: Based on the level of the great arch vessels take-off, three types of aortic arches (AA) have been described in humans, namely Type I, II and III. There are no definitive studies identifying the potential causation of these anatomical variations. We hypothesized that a continual downward drag of a vigorously beating hypertrophied heavier heart over time causes rightward aspect of aortic arch to shift caudad resulting in type II and III arches.
Methods: We reviewed 111 consecutive CT scans of the chest with contrast in patients who also happened to have a 2D echocardiogram performed within the preceding year. AA type was determined by CT scan and then patients’ baseline characteristics and echocardiographic parameters including, but not limited to LV ejection fraction (LVEF), LV mass, LV mass index, LV weight (LV mass plus mass of blood contained in LV cavity) and relative wall thickness were analyzed. After the exclusion of bovine AA, complete data was available in 61 patients. The relationship between these variables and AA type was then tested in univariate and multivariate statistical models.
Results: Univariate analysis revealed increased age, LV mass, LV weight, and LVPWd had significant correlation with Type II and III AAs. However, after multivariate analysis only increased age and LV weight remained independent predictors of AA type. Incidentally, 10 of 11 elderly patients with critical aortic stenosis being evaluated for TAVR had a Type III arch.
Conclusion: Advanced age and LV weight (LV mass plus mass of blood contained in LV cavity) are the most powerful predictors of Type II/III AAs.
Keywords: aortic arch type, severe aortic stenosis, left ventricular weight
IRB, institutional review board; AA, aortic arch; LVEF, left ventricle ejection fraction; BSA, body surface area; LA, left atrium dimension; LVIDd, left ventricular end diastolic dimension; IVSd, interventricular septal end diastolic dimension; LVPWd, left ventricle end diastolic posterior Wall dimension; RWT, relative wall thickness; EDV, end diastolic volume; LVMI, LV mass index; LVWI, LV weight index (LVMI plus weight of blood contained in LV cavity); SD, standard deviation; logLVWI, logarithmic LV weight index; TAVR, transcatheter aortic valve replacement
The aortic arch (AA) is classified as type I, II and III based on the vertical distance between the origin of brachiocephalic artery and the top of the arch.1 In Type I AA, this distance is less than 1 diameter of the left common carotid artery (LCCA). In Type II, this distance is between 1 and 2 LCCA diameters, and in Type III the distance is greater than 2 LCCA diameters.2 In the general population Type I Arch is more prevalent (47%) compared to Type II (36%) and Type III (17%).3 There are no definitive studies identifying the causation of these anatomical variations. However, we do know that all humans are born with a Type I arch.4
We hypothesized that a lifetime of continual downward drag of a pendulant vigorously pulsating heavier heart tends to gradually pull the rightward aspect of the aortic arch caudad creating in extreme cases the so: called Type III Arch. We further hypothesized that the heavier the heart (weight) and the greater the age of the individual (Time), the more pronounced this effect would be. Since most patients with critical aortic stenosis are older (time) and have increased cardiac size and cardiac weight, they should have a higher incidence of Type III AAs. Similarly, patients with significant LVH and LVE from any cause as well will have a Type II or III AA, especially if they are older (time).
Patient selection
After obtaining IRB approval we retrospectively reviewed 111 CT scans of the chest with contrast in patients who had a 2D echocardiogram performed within the preceding year. AA type was determined by CT scan of chest with contrast, then the patient’s baseline characteristics and echocardiographic parameters including, but not limited to left ventricular ejection fraction (LVEF), LV mass, LV mass index, LV weight (LV mass plus mass of blood contained in LV cavity) and relative wall thickness were analyzed. We excluded 34 patients with incomplete data and 12 patients with bovine AA (a congenital variant where the left common carotid artery arises from the brachiocephalic artery). Complete date was available in 61 patients, which comprised our study cohort (n=61).
LV mass was calculated using the ASE (American Society of Echocardiography) equation: LV Mass (g) = 0.8{1.04[([LVIDd + IVSd +PWTd]3 – LVIDd3)]} + 0.6,
Where LVIDd: Left ventricular end diastolic diameter; IVSTd: Diastolic Interventricular septal wall thickness, PWTd: Diastolic posterior wall thickness.5 Relative wall thickness (RWT) was used to differentiate between concentric (RWT ≥ 0.42) and eccentric (RWT ≤ 0.42) hypertrophy.5 End: diastolic volume was calculated using Teichholz formula V= (7/2.4+d) x D3, where V = Volume and d = LV internal diameter. We calculated mass of blood contained in the LV cavity by multiplying end: diastolic volume with density of blood (1.06 g/m3 at 37 degrees Celsius).6 We added this mass to the LV mass to determine LV weight and LV weight index. Since the cardiac cycle is dynamic and the volume of intra cardiac blood varies continuously, the total cardiac weight is difficult to determine; thus, we used LV weight as a surrogate for total cardiac weight.
Statistical analysis
For the analysis of various factors potentially associated with arch types II or III, data were first examined univariately by the student t: test for continuous variables and Fisher’s exact test for discrete data. For the multivariate analysis, we entered variables into a multiple logistic regression model using a univariate p value < 0.25. This model yields a linearized function of a set of covariates (risk factors) that are significantly associated with type II or III arch. The interpretation of a covariate allowed into the final model with a p value < 0.05 is that it is an independent factor associated with type II or III arch, over and above (adjusted for) other potential factors included in the equation. The Prob > ChiSq lists the probability of obtaining, by chance alone, a Chi:square value greater than the one computed if no relationship exists between the response and factor. The prob > chisq is considered significant if it is less than 0.05. Statistical analysis was completed using SAS software, version 9.4 (SAS institute, Inc., Cary, N.C). Demographic and echocardiographic parameters were tabulated using frequency, mean and standard deviation (SD).
Baseline characteristics and demographics are shown in Table 1. Among our 61 study patients, there were 36 Type I AAs, 9 Type II AAs and 16 Type III AAs. The mean age of participants was 51.8 + 19.6, 72.2 + 12.3 and 80.6 + 12.7 years for Type I, II and III arches respectively. Cardiac mass indices were significantly different in the 3 AA types with increasing mass in type II and III compared to type I (Table 2–4 and Figure 1). Univariate analysis revealed increased age (p< 0.001), LV weight index (p=0.002) and LVPWd (p=0.01) had significant correlation with Type II and III AAs, however, after multivariate analysis only increased age and LV weight (our surrogate for the cardiac weight) remained independent predictors of AA type. Furthermore, 10 of 11 (91%) elderly patients within our cohort who had severe aortic stenosis (patients one would expect to have the greatest LV weight for the longest time) had a Type III arch (Figure 2).
Variable |
Mean |
SD |
Age (years) |
62.4 |
21.4 |
BSA (m2) |
1.9 |
0.3 |
LA (cm) |
4 |
0.9 |
Aortic root (cm) |
3.1 |
0.5 |
LVIDd (cm) |
4.5 |
0.9 |
IVSd (cm) |
1.6 |
0.5 |
LVPWd (cm) |
1.4 |
0.3 |
LVEF (%) |
56 |
14.4 |
LVMI (g/m2) |
151.1 |
69.8 |
EDV (ml) |
97 |
46.7 |
LVWI (g/m2) |
206.3 |
88.4 |
RWT (cm) |
0.6 |
0.2 |
logLVWI |
5.2 |
0.4 |
Table 1 Baseline characteristics and analysis of our patient cohort
|
Analysis variable : LVWI and Age |
|||||
|
Arch Type |
N |
LVWI (g/m2) |
Age (years) |
||
|
Mean |
SD |
Mean |
SD |
||
|
I |
36 |
179.1 |
74 |
51.8 |
19.6 |
|
II |
9 |
221 |
120.1 |
72.2 |
13.3 |
|
III |
16 |
259.3 |
76.7 |
80.6 |
12.7 |
Table 2 Age and cardiac mass index by arch types
|
Effect |
DF |
Score Chi: Square |
Pr > ChiSq |
|
Age (years) |
1 |
21.7 |
<.0001 |
|
LVMI (g/m2) |
1 |
8.5 |
0.004 |
|
LVWI (g/m2) |
1 |
10 |
0.002 |
|
LVPWd (cm) |
1 |
6.1 |
0.01 |
|
IVSd (cm) |
1 |
3.5 |
0.06 |
|
LVEF (%) |
1 |
2.7 |
0.1 |
|
BSA (m2) |
1 |
0.3 |
0.56 |
|
LVIDd (cm) |
1 |
0.8 |
0.37 |
|
EDV (ml) |
1 |
0.5 |
0.46 |
|
RWT (cm) |
1 |
0.8 |
0.37 |
Table 3 Univariate model by logistic regression
|
Analysis of maximum likelihood estimates |
|||||
|
Parameter |
DF |
estimate |
standard error |
wald Chi: Square |
Pr > ChiSq |
|
Intercept |
1 |
:16.3 |
5.6 |
8.6 |
0.003 |
|
Age (years) |
1 |
0.1 |
0.03 |
126 |
<0.001 |
|
logLVWI |
1 |
1.9 |
1.1 |
3.6 |
0.05 |
Table 4 Multivariate model by logistic regression
Chronic left ventricular pressure or volume overload from any cause leads to LV hypertrophy. Eventually, all chambers of the heart, especially LV & LA dilate, leading to increased chamber volumes holding increased volumes of blood, resulting in not only increased LV mass but also increased LV weight (LV mass plus mass of blood contained in LV cavity). To date, there are no studies that identify the effect of these variables on the aortic arch type. Our study demonstrates a positive correlation of older age, aortic stenosis, reduced EF and increased LV weight with the presence of Type II and III AAs. Previous work done by our group has demonstrated cresting of the major aortic arch vessels along a centerline traversing the superior most aspect of the arch; we believe this “cresting” results because the arch is literally suspended in the thorax by the major AA branches.7 The arch via the ascending aorta in turn suspends the heart in a pendulum like fashion in the mediastinum. We hypothesize that a lifetime of downward drag by a vigorously pulsating, hypercontractile, hypertrophied and later dilated and therefore a heavier heart exerts an exaggerated downward drag on the rightward end of the AA resulting, over time, in a Type II and finally a Type III arch. Thus, almost all the patients in our study with critical aortic stenosis had a Type III arch.
One clinical implication of the ubiquitous nature of Type III arches in our very elderly aortic stenosis patients relates to percutaneous access for interventions such as TAVR. In specific, with the left arm hyper extended over the head, the trajectory of the left axillary and left subclavian arteries falls along the trajectory of a Type III arch (Figure 3). This trajectory makes an axillary approach an attractive alternative to trans: apical and trans: aortic approaches in patients with advanced lung disease or severe peripheral artery disease (PAD) who are not good candidates for either transfemoral or transapical/transaortic approaches. Finally, this information coupled with the fact that axillary artery size is quite comparable to femoral artery size in most patients,8,9 a totally percutaneous left axillary artery approach utilizing a double Per close large bore arteriotomy closure at the end of procedure is highly feasible for a totally percutaneous TAVR as demonstrated by Shäfer et al.10 and also for totally percutaneous Impella device insertion and removal (Figures 4A to 4E) as shown by our group.8

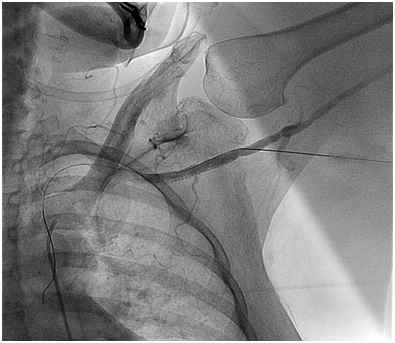
Figure 4A Axillary Artery access with micropuntcure needle utilizing roadmap guidance obtained by injecting contrast through a catheter advanced from R common femoral artery to the L subclavian artery.

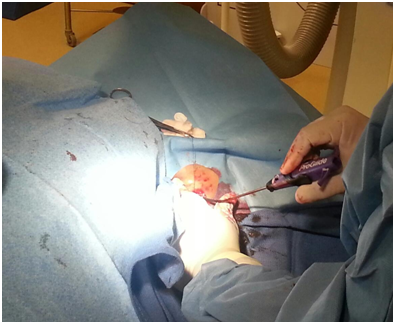
Figure 4B Deployment of perclose prior to insertion of 13.5 Fr sheath for Impella insertion through the L axillary artery for a high risk PCI.

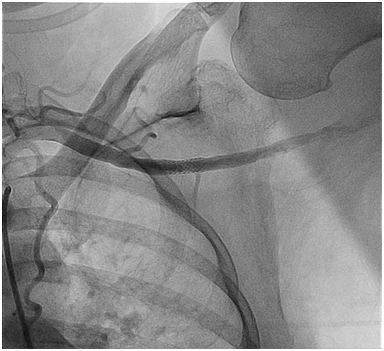
Figure 4C Final L axillary artery Angiogram post a totally percutaneous closure of the large bore arteriotomy at the end of the high risk PCI procedure.
We recognize that there are several limitations to our study. First, the equation for LV mass has limitations in patients with hypertension and asymmetric geometry.5 Secondly, the formula to calculate LV weight (LV mass plus mass of blood contained in LV cavity) is based on calculating end: diastolic volume using Teichholz formula. While this formula may be specific in patients without a synergy, it is inaccurate in patients with left ventricular asynergy.11 Ideally, total cardiac weight would be a sum of the muscle mass of all four chambers in addition to the mass of the contained blood. Since the cardiac cycle is dynamic and the volume of intra: cardiac blood varies continuously, the total cardiac weight is difficult to determine. Because LV weight is easier to calculate, we used LV weight as a surrogate marker of total cardiac weight. Third, we excluded patients with a bovine arch from our study. Finally, the number of patients with critical aortic stenosis is small (only 11). A larger study of all aortic arch types, including bovine arch, in patients with critical aortic stenosis undergoing TAVR is warranted to further validate our findings.
Advanced age, reduced LVEF and increased LV/cardiac weight (LV mass plus mass of blood contained in LV cavity) have a statistically significant correlation with Type II and III AAs. Almost all the patients in our study with critical aortic stenosis who were evaluated for TAVR had a type III arch. This observation coupled with the fact that in the hyper extended left arm a type III arch is a virtual extension of the left subclavian/axillary artery trajectory makes a left axillary artery approach for TAVR and Impella device insertion a viable option in patients with severely diseased aorto: iliac segments and advanced lung disease.
All funding was supported by Department of Cardiology at Newark Beth Israel Medical Center, Newark, New Jersey, USA.

©2016 Tayal, et al. This is an open access article distributed under the terms of the, which permits unrestricted use, distribution, and build upon your work non-commercially.