Journal of
eISSN: 2373-4396


Research Article Volume 10 Issue 1
1Department of Cardiology, Ain Shams University Hospital, Egypt
2Police Hospital, Cardiology Department, Egypt
Correspondence: Hazem M Khorshid, Department of Cardiology, Ain Shams University Hospital, Cairo, Egypt, Tel 202 24821894
Received: October 22, 2017 | Published: November 6, 2017
Citation: Khorshid H, Wadeea B, Sabry E (2017) Correlation of Mitral Annular Plane Systolic Excursion (MAPSE) and Tissue Doppler peak Systolic Velocity with Left Ventricular Systolic Function. J Cardiol Curr Res 10(1): 00349. DOI: 10.15406/jccr.2017.10.00349
Background: Estimation of left ventricular function has major diagnostic and prognostic importance in cardiac patients. The most commonly used measure of the systolic function of the left ventricle is ejection fraction (EF), however, the accuracy is limited especially in patients with poor image quality. Mitral annular plane systolic excursion (MAPSE) and tissue Doppler peak systolic velocity (TD PSV) are measurements of longitudinal function which has been shown to correlate with LV global systolic function.
Objective: To validate the correlation of mitral annular plane systolic excursion (MAPSE) and TD PSV (Sm) at the medial and lateral mitral annuli as surrogates for estimation of LV systolic function.
Methods: The study included 200 patients divided into 2 groups; Group (A) which included 100 patients with normal EF as assessed by biplane Simpson’s method (defined as EF>50%) and Group (B) which included 100 patients with reduced ejection fraction (defined as EF<50%). MAPSE and TD PSV (Sm) were recorded at medial and lateral mitral annuli in the apical four-chamber approach.
Results: The cut off value of MAPSE at medial annulus of ≤ 7mm suggested an impaired systolic function with sensitivity of 73 % and specificity of 100%. While the cut off value of MAPSE at lateral annulus of ≤ 10mm suggested an impaired systolic functions with sensitivity of 82% and specificity of 93%. TD PSV (Sm) cut off value at the Medial and lateral annuli ≤ 7cm/s suggested an impaired LV systolic function with sensitivity of 91% and specificity of 85% for the medial annulus and with sensitivity of 72% and specificity of 93% for the lateral annulus. When the cut-off values of both parameters (TD PSV and MAPSE) were combined to detect LVEF<50, the sensitivity and specificity increased to 95.9% and 100 % respectively for the Medial Mitral annulus and 85.5% and 97.7% respectively for the lateral Mitral annulus
Conclusion: Combining the measurement of both MAPSE and Mitral annular TD PSV increased their sensitivity and specificity for predicting normal or subnormal EF.
Keywords: MAPSE, PSV, tissue doppler, left ventricle function, ejection fraction
EF, ejection fraction; MAPSE, mitral annular peak systolic excursion; TD, tissue doppler; PSV, peak systolic velocity; LV, left ventricular
The assessment of left ventricular systolic function is the most common indication for performing an echocardiogram, however, no perfect measure of systolic function exists and there are limitations to currently available methods.1 The most widely used measurement of left ventricular systolic function is the ejection fraction, which also provides important prognostic information.2 However, its accuracy is limited especially in patients with poor image quality when the endocardial border is not clear enough for tracing where the prevalence of poor image quality was 23-31% in most studies.3 Moreover major inter- and intra-observer variability exists.4
Mitral annular plane systolic excursion (MAPSE) is an easy measure to assess longitudinal function and has been shown to correlate with LV function measurements and is very sensitive in different cardiac diseases.5,6 Tissue Doppler imaging (TDI) also provides an easy method to measure peak systolic velocity of mitral annular longitudinal movement (S’), which is an excellent non-invasive index of global LV systolic function.7 Combining both indices (MAPSE and Mitral annular TD PSV) and correlating them to the EF was not reported before to the best of our knowledge. Hence the aim of the present study was to validate the correlation of mitral annular plane systolic excursion (MAPSE) by m-mode and Mitral annular TD PSV as predictors for EF.
The present study included 200 patients with age ranging between 17–81years. The study was approved by the Ethics committee of Ain Shams University. The objectives of the project and study design were explained completely to the participants and informed consent was obtained from them as well as they were ensured their data would remain private. The patients were divided into 2 groups:
Group (A) which included 100 patients with normal ejection fraction (defined as EF>50%) as assessed by biplane Simpson’s method.
Group (B) which included 100 patients with sub normal ejection fraction (defined as EF<50%) as assessed by biplane Simpson’s method.
The patients were subjected to detailed history talking and thorough clinical examination. All patients underwent full two-dimensional echocardiographic examination using GE vivid 7 machine, and measurements were obtained in accordance with the current American Society of Echocardiography guidelines.8 Echocardiography was performed with the patients in the left lateral decubitus. Two-dimensional imaging examination was performed in the standard fashion in parasternal long-axis view and apical 4-chamber view. Optimization was performed using harmonic imaging, gain, dynamic range, frequency, sector width and focus to improve signal-to-noise ratio and provide optimal endocardial definition.
Echocardiograms were subject to careful visual analysis to detect regional contractile abnormalities which were excluded. LV systolic and diastolic volumes and ejection fraction were derived from apical 2 and 4-chamber views using the modified Simpson's rule algorithm. All echocardiographic and TD recordings were obtained during normal respiration.
MAPSE (mitral annular peak systolic excursion)
Displacement of the mitral annulus was measured in millimeters (mm) by M-mode at two different points (medial and lateral mitral annuli) in the apical four-chamber view. The M-mode alignment was adjusted parallel to the LV walls along the ultrasonic beam. The systolic excursion of the mitral ring was measured from the lowest point of the terminal diastole to the highest point during systole (end of the T-wave in the ECG)
TD Examination of mitral annulus
TD of the mitral annulus was obtained from the apical 4-chamber view after filters were set to exclude high-frequency signals. A 5-mm sample volume was placed sequentially at the medial and lateral mitral annuli. PSV (Sm) measured in cm/sec was recorded for 3 consecutive cardiac cycles at a sweep speed of 100mm/s. The following patients were excluded from the study: patients with significant arrhythmia, congenital Heart disease, valvular stenosis, significant valvular regurgitation, prosthetic valves, regional wall motion abnormality and significant Mitral annular calcification. Also patients with poor echogenicity who were difficult to define the endocardial border were excluded.
Statistical analysis
Mann-Whitney and chi-square tests were used to assess the baseline variables (age, gender, Risk factors). Receiver operating characteristic (ROC) curves and Interactive dot diagrams were plotted to examine the ability of MAPSE and PSV (Sm) to differentiate patients with impaired systolic functions (EF<50%) from those with normal systolic function, and sensitivity and specificity were determined accordingly. All analyses were done using MedCalc v14.8.1 by MedCalc Software.
There was no statistically significant difference between the 2 groups regarding age, gender and prevalence of HTN and dyslipidemia (p >0.05). However prevalence of DM was statistically significantly higher in Group B as compared to group A (p = 0.002) (Table 1). There was a statistically highly significant difference between the 2 studied groups regarding the measured echo parameters (EF% measured by Simpson’s method, TD PSV at medial and lateral Mitral annuli and MAPSE at medial and lateral Mitral annuli), being statistically significantly lower in group B as compared to Group A (p < 0.001) (Table 2).
|
Group A |
Group B |
p-value |
||
|
Age (years) |
54.36 ± 16.3 |
59.32 ± 9.2 |
0.104 |
|
|
Gender |
Males |
38 (38%) |
52 (52%) |
0.064 |
|
Females |
62 (62%) |
48 (48%) |
||
|
DM |
20 (20%) |
41 (41%) |
0.002 |
|
|
HTN |
41 (41%) |
39 (39%) |
0.885 |
|
|
Dyslipidemia |
35 (35%) |
40 (40%) |
0.559 |
|
Table 1 Demographic data and prevalence of risk factors among the 2 studied groups
DM, diabetes mellitus; HTN, hypertension
|
Parameters |
Group A |
Group B |
Independent t-test |
|||
|
Mean |
SD |
Mean |
SD |
t |
p-value |
|
|
EF %(Simpson's) |
61.12 |
5.45 |
37.08 |
7.13 |
22.897 |
<0.001 |
|
MAPSE Med (mm) |
11.96 |
2.23 |
7.34 |
2.51 |
11.465 |
<0.001 |
|
MAPSE Lat. (mm) |
14.12 |
2.74 |
8.48 |
2.74 |
11.906 |
<0.001 |
|
TD PSV Med. (cm/sec) |
9.31 |
1.85 |
6.08 |
1.77 |
10.217 |
<0.001 |
|
TD PSV Lat. (cm/sec) |
9.93 |
2.06 |
6.6 |
1.7 |
9.862 |
<0.001 |
Table 2 The Echocardiographic parameters of both studied groups
EF, ejection fraction; MAPSE, mitral annular plane systolic excursion; TD, tissue doppler; PSV, peak systolic velocity; Med, medial; Lat, lateral
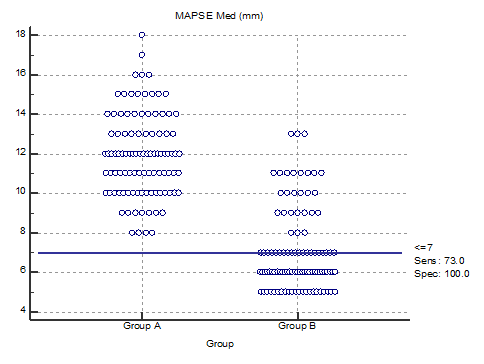
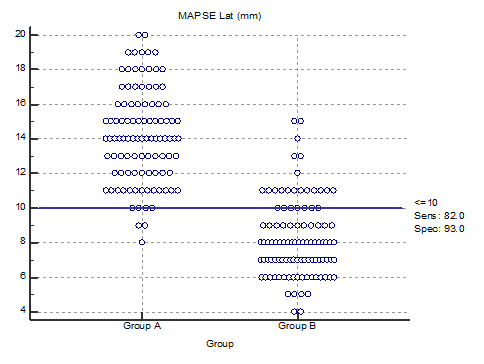
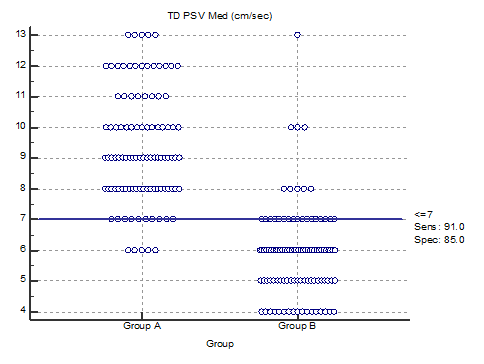
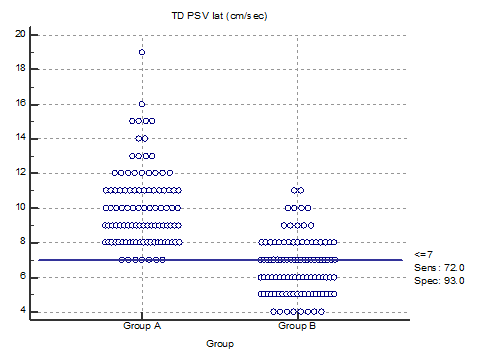
The ROC curve and Interactive dot diagramof MAPSE at the medial mitral annulus showed that the optimal cut off value for detecting subnormal LVEF (LVEF<50%) was ≤ 7mm with sensitivity of 73% and specificity of 100% (Figures 1 & 2), (Table 3). The ROC curve and Interactive dot diagram of MAPSE at the lateral Mitral annulus showed that the optimal cut off value for detecting subnormal EF (LVEF<50%) was ≤ 10mm with sensitivity of 82% and specificity of 93% (Figures 3 & 4), (Table 3). The ROC curve and Interactive dot diagram of TD PSV (Sm) at the medial and lateral Mitral annuli showed that the optimal cut off value for detecting subnormal EF (LVEF<50%) was ≤ 7cm/sec with sensitivity of 91% and specificity of 85% for the medial annulus (Figures 5 & 6), (Table 3), and with sensitivity of 72% and specificity of 93% for the lateral mitral annulus (Figures 7 & 8), (Table 3). When the cut-off values of both parameters (Mitral annular TD PSV and MAPSE) were combined for detecting subnormal (LVEF<50%) , the sensitivity and specificity increased to 95.9% and 100 % respectively for the medial Mitral annulus and 85.5% and 97.7% respectively for the lateral Mitral annulus (Tables 4 & 5).

Figure 2 Interactive dot diagram for the cut-off point between normal and abnormal EF as regard to MAPSE at the Medial Mitral annulus.

Figure 4 Interactive dot diagramfor the cut-off point between normal and abnormal EF as regard to MAPSE at the Lateral Mitral annulus.

Figure 6 Interactive dot diagram for the cut-off point between normal and abnormal EF as regard to TD PSV (Sm) at the Medial Mitral annulus.

Figure 8 Interactive dot diagram for the cutoff point between normal and abnormal EF as regard to TD PSV (Sm) at the Lateral Mitral annulus.
|
Cut-off value |
AUC |
Sensitivity |
Specificity |
+PV |
-PV |
|
|
MAPSE Med (mm) |
<=7 |
93.20% |
73 |
100 |
100 |
78.8 |
|
MAPSE Lat (mm) |
<=10 |
95% |
82 |
93 |
92.1 |
83.8 |
|
TD PSV Med (cm/sec) |
<=7 |
93.20% |
91 |
85 |
85.8 |
90.4 |
|
TD PSV Lat (cm/sec) |
<=7 |
90.50% |
72 |
93 |
91.1 |
76.9 |
Table 3 The sensitivity and specificity of the cut off values of MAPSE and Mitral annular TD PSV (Sm) at the Medial and Lateral Mitral annuli
MAPSE, mitral annular plane systolic excursion; TD, tissue doppler; PSV, peak systolic velocity; Med, medial; Lat, lateral
|
Group |
Total |
|||
|
Group A |
Group B |
|||
|
Combined medial annulus tests |
Prediction: Normal EF (>50%) |
81 |
3 |
84 |
|
Prediction: Impaired EF (<50%) |
0 |
70 |
70 |
|
|
Total |
81 |
73 |
154 |
|
Table 4 Combining medial mitral annular parameters (MAPSE and TD PSV) for predicting EF
Sensitivity: 70/73= 95.9%, Specificity: 81/81 = 100%
|
Group |
Total |
|||
|
Group A |
Group B |
|||
|
Combined lateral annulus tests |
Prediction: Normal EF (>50%) |
88 |
11 |
99 |
|
Prediction: Impaired EF (<50) |
2 |
65 |
67 |
|
|
Total |
90 |
76 |
166 |
|
Table 5 Combining lateral mitral annular parameters (MAPSE and TD PSV) for predicting EF
Sensitivity: 65/76= 85.5%, Specificity: 88/90 = 97.7%
LV longitudinal shortening is a sensitive parameter reflecting cardiac systolic function. It contributes to about 60% of the LV stroke volume.9 Because of their subendocardial location, the longitudinal fibers are more sensitive to affection by various diseases and pathologies.10 Mitral annular plane systolic excursion (MAPSE) and TD PSV are surrogates for the LV longitudinal function.11-13 and there is a close correlation between them.2,3 Both parameters are simple, easily measured and reproducible, even when performed by the beginner practitioners.12,14-16 and in patients with poor echogenicity when endocardial delineation is suboptimal.17-19 as well as in mechanically ventilated obese patients.20
MAPSE
MAPSE has been suggested as a surrogate measurement for LVEF,14 where reduced MAPSE has been shown to correlate with LV systolic function in patients with myocardial infarction, heart failure, atrial fibrillation and critically ill patients with shock.21-23 A recent study validated mitral annular plane systolic excursion (MAPSE)–derived formula to calculate the ejection fraction where EF = 4.8 x MAPSE (mm) + 5.8 in adult males with left ventricular (LV) dysfunction.24 MAPSE also provides important prognostic information in patients with cardiovascular disease.21,23,25,26 Willenheimer et al.11 showed that MAPSE has strong correlation to one-year mortality with 36% mortality in those with MAPSE < 6.4 mm as compared to freedom of mortality in those with MAPSE >10 mm.1 Similar results were found by Nikitin et al.27 In post-myocardial infarction patients with MAPSE <8 mm, the incidence of hospitalization and mortality was 43.8%.26 Significant correlation was also found between MAPSE and serum BNP levels.12 and in a 10-year follow-up study, MAPSE was a strong risk predictor of long-term survival in heart failure.28
The results of the present study showed the cut-off value for MAPSE at medial annulus ≤ 7mm suggested an impaired systolic function with sensitivity of 73% and specificity of 100%. While MAPSE at lateral annulus less ≤ 10mm suggested an impaired systolic function with sensitivity of 82% and specificity of 93%. These results correlate positively with the results of previous studies which showed that mean MAPSE of ≥10 mm was linked with normal EF (≥55%) with a sensitivity of 90–92% and a specificity of 87%.29,30 and a value of MAPSE <8 mm was associated with EF <50% with a specificity of 82% and a sensitivity of 98%.31 with values of lateral MAPSE generally higher than those of septal MAPSE.20,32 In addition, a mean value for MAPSE of ≤ 5 provided the best balanced sensitivity (67.1%) and specificity (76.5%) to predict EF < 30% where a cut off value of ≤ 3.9 could determine EF < 30% in 100% of the patients.24
Mitral annular TD PSV
Peak systolic velocity of mitral annular longitudinal movement (Sm), provides an excellent non-invasive index of global LV systolic function with excellent correlation with established indexes.7 It can also predict the LV wall motion abnormality during dobutamine stress echocardiography.33 Moreover, the prognostic implication of peak systolic velocity of mitral annular longitudinal movement (Sm) has been documented in patients with various cardiac diseases.27,34-37 Sm is a strong predictor of cardiac mortality or rehospitalization for worsening of chronic heart failure in patients with LV dysfunction where Sm < 2.8 cm/sec was associated with worse survival in patients with chronic heart failure and LV EFs < 45%.27,36
The results of the present study showed the cut-off value of PSV (Sm) at the Medial and lateral annuli ≤ 7cm/s suggested impaired systolic function (EF<50) with sensitivity of 91% and specificity of 85% for the medial annulus and with sensitivity of 72% and specificity of 93% for the lateral annulus. These results correlate with Ruan and Nagueh who showed that Sm had strong correlation with LV EF and that Sm < 7 cm/sec was the most accurate parameter in identifying patients with LV EF <45% (sensitivity, 93%; specificity, 87%).38 Vinereanu et al.39 reported in 2002 a value of 8 cm/s as a cut-off point for Sm for detection of LVEF <50% with 80% sensitivity and 89% specificity at the medial mitral annulus and with 80% sensitivity and 92% specificity at the lateral Mitral annulus. However the study included only 51 patients who underwent radionuclide estimation of EF and without exclusion of patients with wall motion abnormalities.39 The results of the present study does not correlate with Gulati et al.16 who reported in 1996 average peak mitral annular velocity at both medial and lateral annuli is > 5.4 cm/s as cut-off point for ejection fraction > 50% with 88% sensitivity and 97% specificity. The study included 55 patients, aged 56 ± 15 years, within 3 hours of radionuclide ventriculographic ejection fraction. Tissue Doppler studies were obtained from each of 6 mitral annular sites without exclusion of patients with wall motion abnormalities which could explain the difference from our results.16
Combined mitral annular TD PSV and MAPSE
To the best of our knowledge combing both parameters for prediction of EF was not reported before. In the present study when combining cut-off values of MAPSE and PSV for predicting impaired systolic function (EF<50) the sensitivity and specificity rose to 95.9% and 100% respectively for the medial Mitral annulus and 85.5% and 97.7% respectively for the lateral Mitral annulus suggesting that combining these 2 simple measurements can give more accurate, reliable and rapid information about the LV systolic function especially in patients with poor echogenicity.
In the present study, combining the measurement of both MAPSE and TD PSV increased their sensitivity and specificity for predicting the EF, suggesting that combining these 2 simple measurements can give more accurate, reliable and rapid information about the LV systolic function especially in patients with poor echogenicity. Further studies combining the measurement of both indices in different subsets of patients should be performed to confirm our results
None.
No financial interest or any conflict of interest exists.

©2017 Khorshid, et al. This is an open access article distributed under the terms of the, which permits unrestricted use, distribution, and build upon your work non-commercially.