Journal of
eISSN: 2373-4396


Research Article Volume 13 Issue 3
1Department of Cardiology, Santa Marta Hospital, Portugal
2Institute of Physiology of Medical Faculty, University of Lisbon, Portugal
Correspondence: Mário Oliveira, Cardiology Department, Santa Marta Hospital, Rua Santa Marta, 1169-024 Lisboa, Portugal, Tel 351.213594311, Fax 351213560368
Received: April 04, 2020 | Published: June 3, 2020
Citation: Oliveira M, Laranjo S, Silva S, et al. Analysis of autonomic activity during head-up tilt in patients with lone paroxysmal atrial fibrillation. J Cardiol Curr Res. 2020;13(3):70-75 DOI: 10.15406/jccr.2020.13.00478
The autonomic nervous system (ANS) has been recognized as an important modulator in the pathogenesis of paroxysmal atrial fibrillation (PAF). Changes in ANS control of heart rate (HR) and blood pressure (BP) variability occur during orthostatism to maintain cardiovascular homeostasis. The wavelet transform (WT) has been used as a tool that provides a time-frequency decomposition of the signal under investigation, allowing intermittent components to be elucidated. Aim: To study HR and BP variability with WT analysis in younger patients (P) with PAF and normal echocardiographic findings, and in healthy individuals (HI) during head-up tilt (HUT). Methods: 17P with lone PAF (age <60 years [33-59], 9 men) and 17 HI (<60years [20-59], 8 men) underwent passive HUT (70º) while on sinus rhythm. Continuous monitoring of ECG and BP was obtained without antiarrhythmic drug medication. Acute changes in RR-intervals and systolic BP were evaluated with WT, and LF (low-frequency power), HF (high-frequency power) and LF/HF calculated for 1) the last 2 minutes of the supine period; 2) the 15 seconds of tilting movement (TM); 3) 1st and 2nd minutes of HUT. Results: RR intervals were identical for the two groups in baseline and during HUT. Supine basal BP was similar for both groups. During HUT, two BP response profiles were observed: a sustained increase in PAF P, and a decrease followed by an increase and further recovery in HI. WT analysis of RR intervals for PAF P, when compared to HI, showed lower LF/HF values in the supine position (2.0±0.5 vs. 2.5±0.3, p<0.05), and a decreased LF power during TM (574±134 ms² vs. 1347±393 ms², p<0.05). In the 1st and 2nd minutes of HUT, changes were comparable in PAF P and in HI. Analysis of systolic BP for PAF P, compared to HI, showed statistically significant differences regarding lower HF values in basal (0.69±0.14 ms² vs 1.05±0.13 ms², p<0.05) and lower LF and LF/HF values during TM (6.3±2.5 ms² vs 8.2±1.6 ms², 8.4±2.9 vs 12.8±4.4; p<0.05). No differences were detected with respect to the 1st and 2nd minutes of HUT. Conclusion: P with PAF presented modified autonomic control of HR and BP in the supine position and during the initial phase of orthostatism. These findings suggest that wavelets analysis may provide a new insight into the assessment of the dynamicity of autonomic cardiovascular regulation and underscore the presence of ANS disturbances in PAF.
Keywords: atrial fibrillation, autonomic nervous system, head-up tilt, wavelet transform
ANS, autonomic nervous system; PAF, paroxysmal atrial fibrillation; HR, heart rate; BP, blood pressure; Wt, wavelet transform; HI, healthy individuals; HUT, head-up tilt; TM, tilting movement; AF, atrial fibrillation, RRI, R-R intervals
Atrial fibrillation (AF) is the most common sustained cardiac arrhythmia in clinical practice. Its prevalence increases with age, having impact on both life expectancy and quality of life.1–4 The occurrence of paroxysmal AF (PAF) represents around 30% of all AF cases, and is more frequent in younger patients without underlying identifiable heart disease.5–7 Mechanisms underlying PAF pathophysiology remain a considerable challenge. The relative contribution of the multiple wavelet hypothesis,8 the focal sources of electrical activity,9 and the electrical rotors10 in explaining PAF remains unknown. Autonomic nervous system (ANS) has important modulating effects on electrophysiological properties related with atrial vulnerability for AF, with acute fluctuations of vagal and/or sympathetic activation being determinant for the occurrence of AF episodes.11,12
During orthostatic stress, dynamic changes in autonomic control of heart rate (HR) and blood pressure (BP) variability occur to maintain cardiovascular homeostasis. These rapid short-term adjustments are mediated by the neural pathways of the ANS.13 The spectral analysis of HR and BP variability have been shown to provide indirect estimates of sympathovagal cardiovascular activity.14 Wavelet Transform has emerged as an useful tool, that provides a time-frequency decomposition of the signal under investigation, enabling transient or intermittent components to be elucidated.15 In the present study, we used the application of wavelet analysis to HR and systolic BP signals to characterize acute ANS modulation of cardiovascular activity recorded during head-up tilting (HUT) in lone PAF patients.
The study enrolled 17 patients (8 females and 9 males, age <60years [33-59]) affected by ≥1 year of clinical history of PAF episodes, and 17 healthy volunteers (HI) (9 females and 8 males, <60years [20-59]). PAF was documented with electrocardiogram (ECG) and/or Holter recordings. Patients with PAF were diagnosed as having lone AF (without clinical or echocardiographic evidence of cardiopulmonary disease). None of these subjects had clinical history of syncope, myocardial infarction, congestive heart failure or diabetes mellitus. Prior to the HUT, all antiarrhythmic drugs were withdrawn for at least 5 half-life times. Patients under amiodarone stopped treatment 4 weeks before the test. Alcohol and tobacco were not allowed in the day of the test. No individuals underwent tilt testing while taking medication with anticholinergic properties. Tests were performed in a quiet environment, with controlled temperature and humidity, during the morning, following four hours of fasting. ECG and BP were monitored continuously using a Task Force Monitor (CN systems, Graz, Austria). Studies were approved by the local ethics and performed after written informed consent.
Head-up tilt protocol
Subjects were placed on a tilt table with a foot plate support, secured with snug restraints (to prevent falling if syncope occurred). After a rest period of 10 minutes in the supine position, the subject was tilted to a 70º head-upright position, at a constant speed within 15 seconds. Subjects were instructed to breath normally. Intravenous cannulation was not used before or during the test. Wavelet analysis was implemented on R-R intervals (RRI) and systolic blood pressure (SPB), derived from continuous monitoring of ECG and arterial BP, respectively (see signal acquisition and processing below). The RRI and SPB data analysis was performed on four periods: 1) the last 2 minutes of the resting period (basal); 2) during the 15 seconds involved the change from supine to standing position (TM), 3) at 70º, during the first minute of tilt adaptation (TT1); and 4) during the second minute of head-up tilting (TT2). In each of these 1-minute periods, data analysis was performed in windows of 10 seconds. The period of 10 seconds that had the largest change from maximum to minimum was the one chosen to compare with control.
Signal acquisition and processing
Data were acquired at 1Kz and analysed on the time-frequency domain using the discrete wavelet transform. We selected the Daubechies 12 (Db12) wavelet because the shape of this particular wavelet resembles the type of feature present in the time series of the signal information.16 Data were then processed in an Origin environment (OriginLab, Origin Lab Scientific Graphing and Analysis Software, Origin Lab Corporation, Northampton, MA, USA). A peak-to-peak routine was implemented to detect ECG and BP peaks to reconstruct the time evolution curves of RRI and SBP, which were computed in a Matlab environment (MathWorks, Natick, MA, USA). The RRI and SPB were interpolated by cubic spline and resampled (resampling period=0.193) to ensure that the centre of the frequency range of interest matched the central frequency associated to one of the scales of the DWT analysis.
Briefly, the resampled RRI and SPB time series were decomposed (fRR(t) and f SPB(t)) into a sum of details and approximation at different scales of resolution. The central frequency associated with each scale (fc) was calculated by fc=Fc/aD, where Fc is the central frequency of the used wavelet (Db12), a is equal to 2-j, where the scale is j and D is the resampling period. The signal was decomposed in 12 scales. The wavelet transform of the analysed signals at scale j and position μ was computed using the relation
where ψ is a wavelet function, W f (μ, j) are the wavelet coefficients at scales and f (t) either fRR(t) or f SPB(t).
The selected wavelet coefficients for each detail related to signal frequencies between 0.038-0.15 Hz (LF) and 0.15-0.6 Hz (HF).17 For the wavelets applied to the continuous SBP signal we considered only the LF values because the meaning of the HF-band in the analysis of SPB variability stills controverse and difficult to validate. The square of the details amplitude (SqA) was then calculated and, for a certain interval of time, the representative value of LF and HF was considered as the average of SqA across the details associated with the frequency ranges of interest.
Statistical analysis
Student’s t test and repeated ANOVA were utilised for the analysis of continuous variables (overall comparison). Pair-wise comparisons of LF, HF and LF/HF between the mean of control values and the mean individual period were assessed by the Bonferroni test. The Chi-square test was used to evaluate the differences in categorical variables of two groups. P<0.05 was considered statistically significant. Data were analyzed using GraphPAD Prism 8.0 Instruments.
Patient characteristics
Seventeen patients with lone PAF were compared with a control group of HI (Table 1). There were no significant differences in age, sex ratio, arterial BP and HR.
|
Characteristic |
PAF group |
HI group |
|
HI group |
(n=17) |
|
|
Age |
48 |
49 |
|
Years |
9±13 |
1±7 |
|
Male gender |
53% |
47% |
|
Heart rate (bpm) |
60±7 |
62±8 |
|
Systolic blood pressure |
124±18 |
117±10 |
|
Diastolic blood pressure (mmHg) |
81±12 |
77±6 |
Table 1 Clinical characteristic of the subjects
*Data with the plus/minus sign are the mean ± SD, p=NS. bpm, beats per minute, PAF, paroxysmal atrial fibrillation; HI, healthy individuals
Head-up tilt
Heart rate and blood pressure changes: All participants completed the protocol of the study without symptoms, AF initiation or fainting. During HUT, HI showed, initially, a non-significant fall in BP, followed by a return to baseline and a further increase, accompanied by an increase in HR (Table 2 and Figure 1). In the group of patients with PAF, mean arterial pressure values increased significantly during the TM, TT1 and TT2 periods (p<0,01; comparing basal with the other periods), also followed by an increase in HR (p<0,001; comparing basal with TT1 and TT2). Two BP response profiles (compared with the baseline) were observed: a sustained increase in PAF patients, and a decrease followed by an increase and further recovery in HI. No significant differences were observed between the two groups for HR response to the HUT during all analyzed periods (Figure 1B). Also, basal supine BP was similar for both groups (Figure 1A). However, the average systolic and diastolic BP increased immediately after the tilt in the PAF group, with mean arterial pressure values significantly higher during the HUT (Figure 1A).
|
Basal |
TM |
TA1 |
TA2 |
|
|
RR intervals (ms) |
||||
|
PAF |
1014±167 |
980±180 |
933±180 |
919±179§ |
|
HI |
963±117 |
974±125 |
923±120* |
885±125* |
|
Systolic blood pressure (mmHg) |
||||
|
PAF |
124±18 |
129±19 |
135±17* |
135±12* |
|
HI |
117±10 |
115±11 |
115±10 |
120±8 |
|
Diastolic blood pressure (mmHg) |
||||
|
PAF |
81±12 |
86±12* |
95±13* |
96±10* |
|
HI |
77±6 |
74±9 |
78±10 |
81±9** |
|
Mean blood pressure (mmHg) |
||||
|
PAF |
96±13 |
101±13* |
109±14* |
109±10* |
|
HI |
90±10 |
88±9 |
90±10 |
94±8** |
Table 2 Changes in RR intervals and blood pressure on head-up tilt (paroxysmal atrial fibrillation patients compared with the healthy volunteers group)
PAF, paroxysmal atrial fibrillation group; HI, healthy individuals group
*p£0,01; **p =0,02; §=p<0,001, when compared to basal. Data are expressed as mean±SD
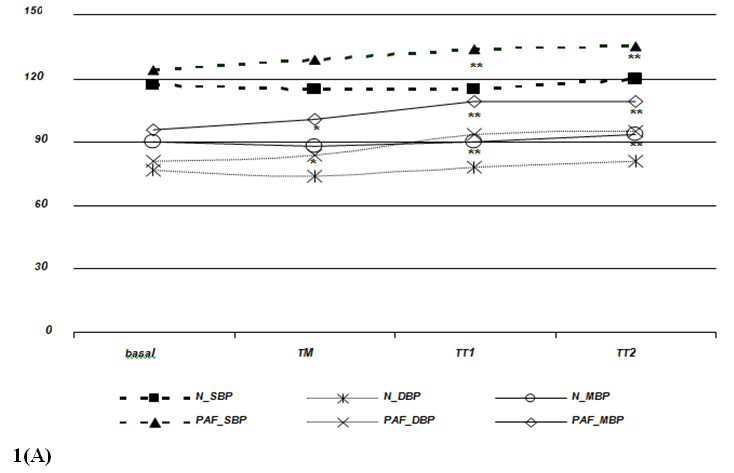
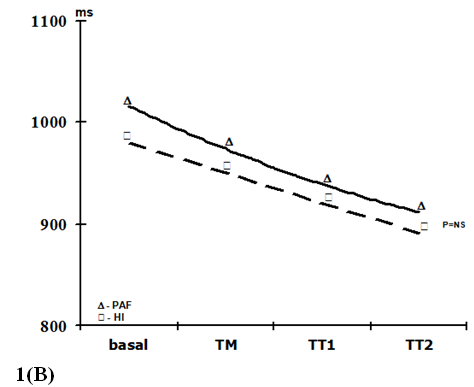
Figure 1 Blood pressure (1A) and heart rate (1B) responses during head-up tilting in patients with paroxysmal atrial fibrillation and in healthy individuals. basal=supine position; TM=during the 15 seconds of tilting movement; TT1=during the first minute of tilting (70º); TT2=during the second minute of tilting (70º); PAF_SBP, PAF_MBP and PAF_DBP=systolic, mean and diastolic blood pressure in paroxysmal atrial fibrillation patients, respectively; N_SPB, N_MBP and N_DBP=systolic, mean and diastolic blood pressure in healthy volunteers, respectively. Data expressed as mean values. (p=NS between HI and PAF patients for basal blood pressure and for RR intervals in each period; *=p£0,01; **=p£0,001).
Heart rate and blood pressure variability
HR and SBP variability were significantly different in patients with PAF compared to HI, during supine rest and in HUT.
Wavelet analysis of RRI showed a significant increase of the LF band during the TM and TT1 periods (compared to basal), and a significant decrease of the HF band in the TT2 period for the HI group, while, in the PAF group, an increase of the LF band was observed only in the TT1 period without no significant changes in the HF band (figure 2). At TM, the LF values were significantly lower in the PAF group than in HI (574±134 ms2 vs. 1347±393 ms2; p<0,05). In basal, the LF/HF ratio was lower in the PAF group (2,01±0,52 vs. 2,55±0,34, p<0,05), followed by a significant sustained increased in both groups (from 4,5±1,5 after orthostasis to 12,2±2,9 during TT2 in PAF, and from 3,29±0,67 after orthostasis to 9,74±3,68 during TT2 in HI, p=NS) (Figure 2). Analysis of SBP for PAF patients showed statistically significant differences regarding lower HF values in basal compared to HI (0.69±0.14 ms² vs. 1.05±0.13 ms², p<0.05) (figure 3). During TM, LF and LF/HF values were also lower in the PAF group (6.3±2.5 ms² vs. 8.2±1.6 ms², 8.4±2.9 vs 12.8±4.4; p<0.05). No differences were detected with respect to the TA1 and TA2 periods.
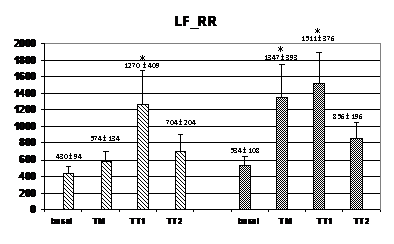
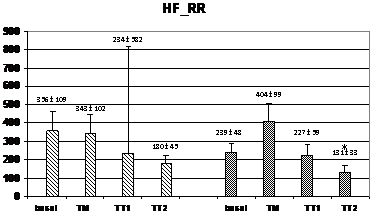
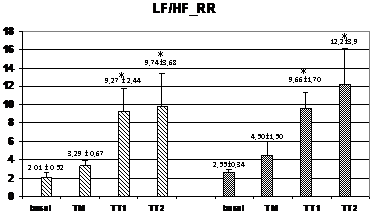
Figure 2 Changes in autonomic outflow parameters obtained from the RR intervals during head-up tilt. basal=supine position; TM=during the 15 seconds of tilting movement; TT1=during the first minute of tilting (70º); TT2=during the second minute of tilting (70º); PAF=paroxysmal atrial fibrillation; HI=healthy individuals; LF_RR=LF band from RR intervals; HF_RR=HF band from RR intervals; LF/HF_RR=LF/HF ratio from RR intervals. Data expressed as mean±SEM. (p<0,05 between HI and PAF patients for basal LF/HF and for LF during TM; *=p<0,05 when compared to basal).
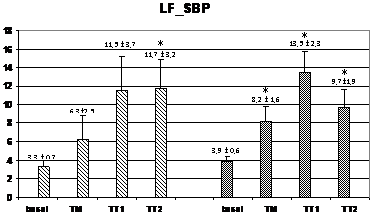
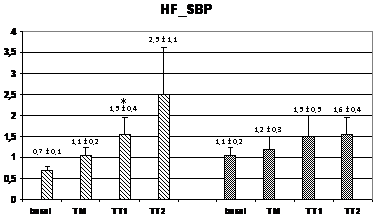
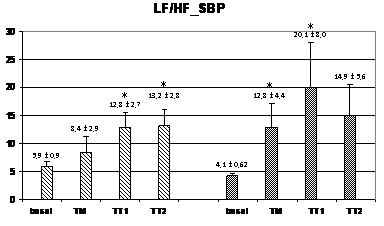
Figure 3 Changes in autonomic outflow parameters obtained from the systolic blood pressure during head-up tilt. basal=supine position; TM=during the 15 seconds of tilting movement; TT1=during the first minute of tilting (70º); TT2=during the second minute of tilting (60º); PAF=paroxysmal atrial fibrillation; HI=healthy individuals; LF_SBP=LF band from systolic blood pressure; HF_SBP=HF band from systolic blood pressure; LF/HF_RR=LF/HF ratio from systolic blood pressure. Data expressed as mean±SEM. (p<0,05 between HI and PAF patients for basal HF and for LF and LF/HF during TM; *=p<0,05 when compared to basal).
This study compared, by using wavelet transforms analysis, the ANS activity involved in the acute adaptation of HR and BP during HUT, in HI and PAF patients. The results have demonstrated that, despite similar clinical characteristics and no differences of mean HR and BP in basal conditions, patients with PAF have different values for autonomic outflow in the supine condition, with occurrence of significant differences in the analysis of the ANS responses during the initial period of adaptation after orthostasis.
The wavelet transform has emerged as a useful tool that provides a time-frequency decomposition of nonstationary signals under investigation, which allows intermittent components to be elucidated. Wavelet analysis is able to reflect a precise, temporally localized, shift in ANS equilibrium.17 This method has been shown to be applicable in short duration analysis, allowing the visualization in time of the contribution of LF and HF to the observed dynamic changes of a particular signal.15,16 It is especially valuable because of its ability to elucidate simultaneously spectral and temporal information. Wavelet analysis has been widely accepted for performing time-frequency decomposition of cardiovascular signals.17–19 There are several types of wavelet functions to be used for the analysis of physiological signals. In this study, the Daubechie type was selected because it has been proposed as the most suitable for BP and HR signal profiles.15,16 We studied the contribution of two sets of frequencies, LF-band (0,038-0,15 Hz) and HF-band (0,15-0,60 Hz), to acute changes in RRI and SBP evoked by HUT.
Physiological effects of the head-up tilt
Changes in autonomic control of HR and BP variability occur during orthostatic stress to maintain cardiovascular homeostasis. The use of non-invasive methodologies to evaluate ANS function, based in frequency domain methods, have demonstrated that analysis of RRI and SBP variability constitutes one of the most widespread tools used to investigate on the coupling mechanisms underlying short-term cardiovascular regulation.20 HUT is a physiological stimulus that is associated with increased sympathetic tone and withdrawal of vagal activity.21 Classically, HUT causes two phases of adaptation: an earlier cardiovascular response, that can be observed during the first 30 seconds after orthostasis, followed by a stabilization period, composed by an early adaptation occurring in the first 1-2 minutes of HUT and a second period related to prolonged orthostasis, that lasts more than 5minutes.15,16,22 The rapid short-term adjustments to orthostatic stress are mediated by the neural pathways of the ANS. Therefore, our results show, by using the wavelet transform analysis applied to the four periods under observation, the modifications of ANS activity underlying HR and BP changes.
The PAF group had lower basal LF/HF for the HRV analysis, and lower HF for the SBP variability. These observations may represent an exaggerated feedback interaction occurring in the direction from SBP to RR interval. It is widely accepted that the sympathetic influences are better seen on the LF band of BP signal whereas the parasympathetic activity is better expressed on HF band of HR recording.15,16 Moreover, an ANS balance in favour of the cardiac influence of vagal activity, with a lower influence of the parasympathetic outflow in the arterial system in the supine position, might be interpreted as a tendency to an enhanced cardiac vagal activity, and a more direct arterial effect of sympathetic nervous system in PAF patients. In fact, it is well known that vagal nerve stimulation can result in significant changes in cardiac electrophysiology that predispose patients to develop paroxysmal atrial arrhythmias.12,23,24 Nevertheless, the observation of a lower basal HF in the analysis obtained from the SBP variability is difficult to explain, because the meaning of the HF-band in the analysis of SPB variability stills controversial and difficult to validate. In fact, HF power of BP variability does not have an autonomic correlate, but rather, it corresponds to the mechanical effects of respiration that may act directly on the pressure gradients of intrathoracic vessels.14 Furthermore, the focus of this study was the analysis of the ANS activity during the adaptation phases to HUT.
In HUT, where an orthostatic challenge is performed, HI showed a significant sustained increase of sympathetic flow derived from RRI and SPB starting during TM, while in PAF patients, this increment occurred later, during the TT1 period. Also, HI had a higher value for LF/HF ratio obtained from the SBP, since the beginning of the orthostatism (Figure 3), indicating a different balance between sympathetic and parasympathetic outflows. Strictly speaking, HRV and SBP variability represent measures of the heart’s response, and the blood vessels' response, to the autonomic outflow. Therefore, the present results support the notion that patients with lone PAF may have abnormalities in the ANS function, has proposed by other authors.25,26
The differences detected in the temporal changes of ANS activity in PAF patients occurred, however, with significant higher values for the diastolic and mean BP during the TM period, associated with higher SBP during TT1 and TT2, despite similar heart rates. These observations could be related with a progressive adaptation of the autonomic cardiovascular receptors due to a certain degree of ANS dysfunction. In fact, abnormalities of the autonomic tone can lead to an up-regulation of the cardiovascular receptors, which may be related with a heightened susceptibility to autonomic cardiovascular responses.27,28 Thus, it could be that the delay observed in the increase of the sympathetic activity for RRI and SBP variability reflects an abnormality of the ANS outflow, whereas the higher BP values with similar RRI during orthostasis analysis may be a result of an increased cardiovascular sensitivity to ANS influences. Also, a complementary view in the interpretation of these data may be in concordance with previous studies showing that essential hypertension is linked to basic alterations in cardiovascular autonomic control, with specific abnormalities being already present at a very early stage of the disease, perhaps even before any sign of increased BP can be observed.29 Akselrod and coworkers showed that mild-hypertensive subjects displayed a marked reduction in the rise of LF-band fluctuations in BP variability during postural changes.30 It is well known, from prospective surveys, that systemic hypertension is the most common disease associated with all types of AF.31–32 Therefore, changes of ANS responses detected during HUT, might also be looked as a potential indicator for the development of hypertension in the future. The physiological meaning of these results, reflecting a complex interaction between adrenergic and vagal tone in PAF patients, represents a challenge that needs to be further explored, both as a contribution to the understanding of the mechanisms underlying PAF and as a marker of clinical outcome.
Study limitations
First, the protocol did not include HR and SBP variability measurements with wavelet analysis beyond the 2 first minutes of orthostatic stress. Therefore, comparison of the autonomic activity occurring during prolonged standing cannot be discussed in this study. Nevertheless, it is accepted that the rapid short-term adjustments in the first two minutes of HUT are mediated by the neural pathways of the ANS. Another limitation lies on the fact that, although the number of subjects included in the study allowed for the identification of significant differences in the parameters considered for the evaluation of ANS function and BP responses during HUT in the group with PAF patients, the resulting sample was relatively small. Thus, further studies in a larger group may be needed to confirm these findings.
Patients with lone PAF present modified autonomic control of HR and SBP in the supine position and during the initial phase of HUT. These findings underscore the presence of ANS disturbances in PAF, and indicate that wavelet analysis allows the evaluation of acute and transient changes of HR and SBP variability, providing a new insight into the assessment of autonomic cardiovascular function in clinical practice.
None.
The authors declare there are no conflicts of interest related to the article.
None.

©2020 Oliveira, et al. This is an open access article distributed under the terms of the, which permits unrestricted use, distribution, and build upon your work non-commercially.