Journal of
eISSN: 2373-4396


Research Article Volume 7 Issue 2
The Joan C. Edwards School of Medicine, Marshall University, USA
Correspondence: Joseph I Shapiro, Dean, Joan C. Edwards School of Medicine, Professor of Medicine, Marshall University, 1600 Medical Center Drive, Suite 3408, Huntington, WV 25701, USA, Tel 13046911700, Fax 13046911726
Received: October 25, 2016 | Published: November 16, 2016
Citation: Shah PT, Martin R, Sanabria J, Khitan Z, Santhanam P, et al. (2016) Adiposity Predicts Pulse Pressure in Subjects with Chronic Kidney Disease: Data from the Modification of Diet in Renal Disease. J Cardiol Curr Res 7(2): 00240. DOI: 10.15406/jccr.2016.07.00240
Obesity is a known risk factor for hypertension, but the mechanisms by which this occurs are still unclear. As the body mass index (BMI) is frequently used to define obesity, but the BMI does not distinguish between adipose and other tissues, we sought to develop another index of obesity. We decided to look at the ratio of BMI to urinary creatinine excretion as the latter measurement is believed to be an index of muscle mass. We used data from the modification of diet in renal disease (MDRD) study as urinary creatinine collections and blood pressure measurements were readily available in this data set. The UCRV correlated well with lean body mass determined by anthropomorphic measurements available on this data set. We found that the BMI/UCRV ratio correlated with either percent body fat (PBF) or total body fat calculated as the product of PBF and weight. We also found that the BMI/UCRV ratio correlated significantly with systolic, diastolic and especially pulse pressure in this population. These data suggest that adipocyte mass has a relationship to blood pressure in subjects with renal disease. Should these data be confirmed in other populations, the BMI/UCRV ratio may prove to be a useful measurement in patients at risk for hypertension and other cardiovascular diseases.
Keywords: Hypertension; Blood pressure; CKD; Correlation; Cardiovascular disease
Obesity has reached pandemic proportions; according to the World Health Organization (WHO), over 500 million adults (10-14% of world population) were obese in 2008, and this number keeps increasing [1-3]. As of 2014, greater than 1/3 of US adults would be classified as obese [4]. There is a strong association between hypertension and obesity, but the mechanism(s) by which obesity predisposes to hypertension has (have) not clearly been defined [5].
The body mass index (BMI) has been used as a way to assess obesity, but unfortunately it does not distinguish between adipose and muscle tissues. Clearly, subjects can have BMI values that would classify them as “obese” while their anthropomorphic measurements would register low percentages of body fat. As creatinine excretion is believed to be a reflection of muscle mass [6], we chose to look at the subjects of the Modification of Diet in Renal Diseases where such data were readily available [7].
A retrospective study was performed using data acquired in the “Modification of Diet in Renal Diseases” or MDRD study [7]. Results from this study have been reported elsewhere [7-11]. These data containing 25,903 records were imported into R Studio and simplified into 840 unique patient records. From these data, linear regression analysis was performed with the quality of the fit reported as an adjusted R2. Regression figures were made with the GGPLOT2 and SCATTER3D packages. Once we had evidence supporting the use of the ratio of body mass index (BMI) to urinary creatinine excretion rate (UCRV), we sorted patients based on this BMI/UCRV value and compared the different quartiles using one way ANOVA. Group means were individually compared using the t-test employing Holm’s correction for multiple comparisons. Significance values are reported at the p = NS, p<0.05 and p<0.01 levels. These data were graphically shown as “pirate” plots showing the actual data as scatter points, the distribution as a bean shape (evoking a pirate’s beard) and the mean +/- 95% confidence intervals shown as the thickness of the top of the bar (https://www.r-bloggers.com/the-pirate-plot-2-0-the-rdi-plotting-choice-of-r-pirates/). Creating these graphs required the loading of the DEVTOOLS and YARRR packages. Once base figures were produced in R Studio, they were exported as jpeg files, and final annotation was performed in Microsoft PowerPoint.
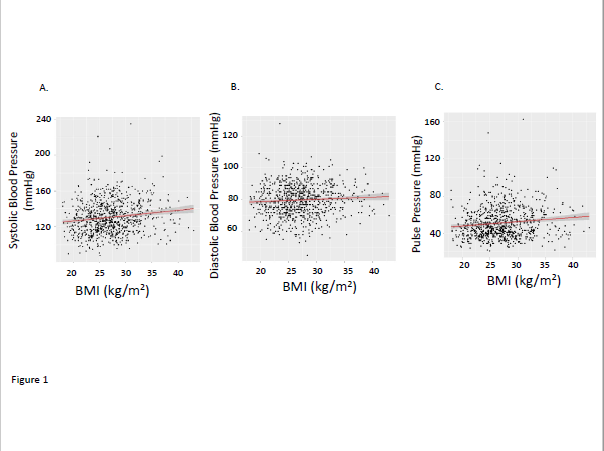
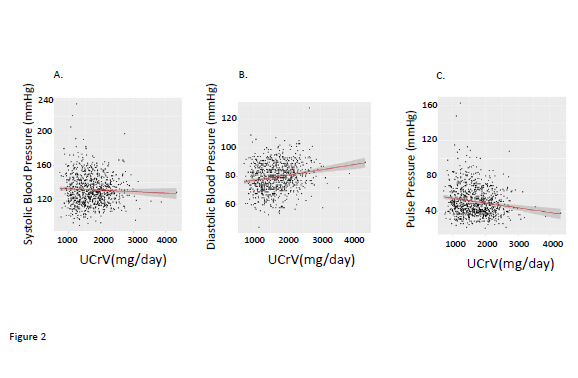
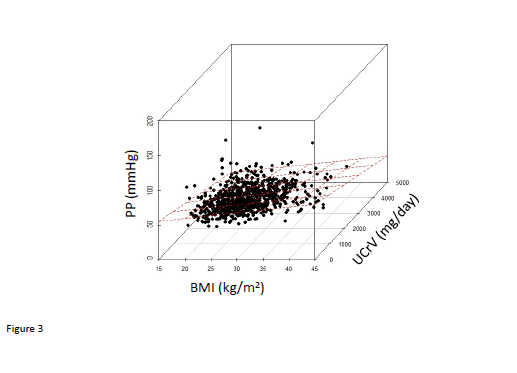
We observed that there were significant correlations between BMI and systolic, and pulse pressures although the correlation with diastolic blood pressure did not achieve statistical significance (Figure 1). Urinary creatinine excretion rate (UCRV) did not correlate significantly with systolic blood pressure but did correlate significantly with diastolic and pulse pressures (Figure 2). When we combined BMI and UCRV, the plane of prediction correlated well with the pulse pressure, achieving an adjusted R2 value of 0.06263, p<0.01 (Figure 3).
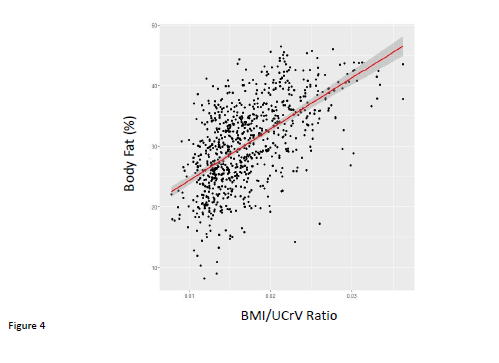
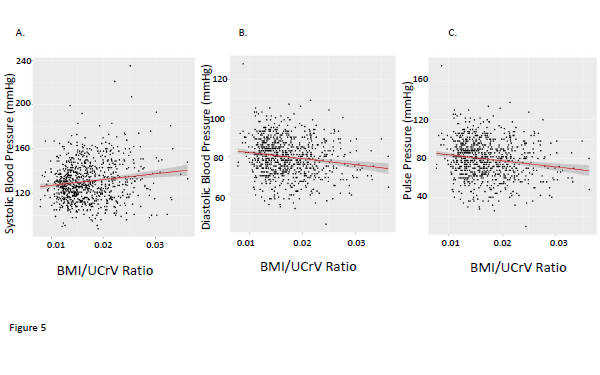
With these observations in mind, we constructed the ratio of BMI/UCRV. UCRV correlated well with the lean body mass calculated as the product of (100-percent body fat)/100 and body weight (in kg) (adjusted R2 = 0.56, p<0.01). This BMI/UCRV ratio correlated quite well with both percent body fat determination determined by anthropromorphic measurements (Figure 4). The BMI/UCRV correlated significantly with the systolic, diastolic and pulse pressures, the latter correlation having an adjusted R2 (adjusted R2= 0.05802, p<0.01) approaching that of BMI and UCRV combined in a multiple regression analysis (Figure 5). The correlation of the BMI/UCRV ratio to pulse pressure was considerably better than that of percent body fat to pulse pressure which achieved an adjusted R2 of only 0.031115 (p<0.01).
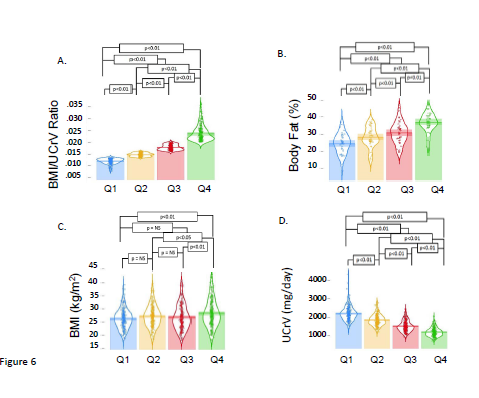
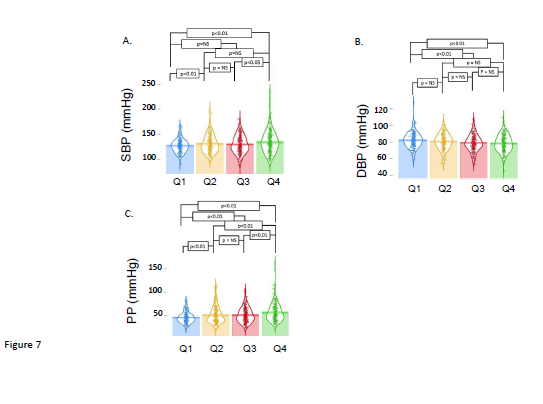
To better understand the predictive capability of the ratio of BMI/UCRV, we divided our patients into quartiles defined by this measurement. As expected the data were distinct and significantly different (all p<0.01). Again, as expected from the regression analysis, the percent body fat of the patients separated into quartiles were also significantly different (all p<0.01). The components of the ratio, BMI and UCRV also differed significantly in the quartiles (all p<0.01). These data are summarized in Figure 6. When we examined systolic, diastolic and pulse pressures, we saw the segmentation of the population into quartiles based on the BMI/UCRV ratio showed varying degrees of difference in these measurements. As we might have inferred from the regression analysis, the separation showed the greatest difference in pulse pressures (Figure 7).
The link between obesity and hypertension is well established and profound [12]. However, there is still considerable uncertainty as to the molecular mechanisms involved. Most of the putative mechanisms which have been proposed and studied involve adipose tissue itself, either through mass, hormonal or cytokine effects producing renal salt sensitivity and/or hypertension itself. Based on these observations, we thought it would be reasonable to examine whether we could develop a biochemical measurement of adiposity and examine its performance.
Urinary creatinine excretion is believed to be determined largely by muscle mass as creatinine is produced by the non-enzymatic degradation of creatine, and creatine is present in a large and predictable concentration in skeletal muscle [13]. Unfortunately, creatinine excretion rates require the collection of timed urine specimens which are not available in most clinical studies. One such study, in addition to the MDRD study examined in the paper, is the famous Intersalt study where such urine collections as well as BMI and blood pressure measurements were made on normal volunteers at 52 centers from across the world. We recently completed a study of those data which was somewhat limited in that individual subject data was not available. When one uses the center mean data, we found a confusing and disturbing negative correlation of the BMI/UCRV to systolic, diastolic and pulse pressures [14]. As these data were absolutely contradictory to our expectations, we sought a patient population where we could further test our hypothesis with individual patient data.
The MDRD study is famous for yielding clinical estimates of glomerular filtration rate, but it should be emphasized that it was developed to test whether dietary protein restriction would ameliorate the progression of renal failure. This study has been reviewed extensively elsewhere, but for the purpose of our interest, we had a group of patients, albeit those with some degree of chronic kidney disease, in which we could compare the baseline values of BMI, urinary creatinine excretion to systolic, diastolic and pulse pressures. As shown in this paper, our ratio correlated with another measurements of adiposity performed on these subjects and predicted the systolic, diastolic and especially pulse pressure in this population to a significant degree.
This study highlights the importance of human body components in CV risk profile rather than simply the body mass. It also adds more weight to body fat content as being the driver of this link. We have shown, among others, the importance of inflammation evident by inflammatory biomarkers profile and adipokines in obese rodents and humans suggesting the pivotal role of adipocytes dysfunction, a hallmark and consequence of obesity, in vascular dysfunction and metabolic syndrome [15-20]. Moreover, abnormal renal sodium handling, salt sensitivity and sympathetic over-activity have also been shown to link hypertension and obesity [21,22].
Our study has limitations. First and foremost, the patients in the MDRD study had variable degrees of renal dysfunction. It is, in fact, possible that our findings are not extendable to a normal population. Second, anti-hypertensives used by some of the study population could have altered the relationship between adiposity and blood pressure. We strongly suspect that the use of such medications to achieve varying degrees of compliance with the standards of the 1980s created some degree of confounding results. Third, we found that the BMI/UCRV ratio correlated best with pulse pressure rather than systolic or diastolic pressure. Although the pulse pressure has been shown to be a better predictor of CV risk in subjects older than 60 years [23], we found this relationship significant throughout the MDRD population. This can point to the relevance of perfusion pressure in subjects with CKD regardless of their age. Finally, it is important to stress that our results show correlation rather than causation and it is required to have different type of study design to determine whether and how the adipocyte mass can affect blood pressure and whether our ratio can serve as a reasonable surrogate.
In this population at risk for CVD, adipose mass assessed by the BMI/UCRV ratio appears to correlate with blood pressure and, in particular, pulse pressure. This ratio needs further to be examined and validated in other populations as well as in interventional studies where some element of causation can be dissected.

©2016 Shah, et al. This is an open access article distributed under the terms of the, which permits unrestricted use, distribution, and build upon your work non-commercially.