Journal of
eISSN: 2373-4396


Research Article Volume 2 Issue 5
Department of Clinical Physiology, Karolinska University Hospital Solna, Sweden
Correspondence: Joana Santa, Department of Clinical Physiology, Karolinska University Hospital Solna, Solnavägen 1, 171 77 Solna, Sweden, Tel 7956573143
Received: March 26, 2015 | Published: May 8, 2015
Citation: Cruz DD, Santa J, Sanches D. Left ventricle assessment-ejection fraction and stroke volume through simpson’ method and 3d transthoracic echocardiography in patients with aortic valve disease. J Cardiol Curr Res. 2015;2(5):119-122. DOI: 10.15406/jccr.2015.02.00075
Objective: Assessment of ejection fraction (EF) results from Simpson’ method from 2D and 3D transthoracic echocardiography (TTE). In addition, it was also assessed stroke volume (SV) from 2D TTE and 3D TTE.
Background: The reference method to calculate LV volumes, SV and EF is cardiac magnetic resonance imaging (MRI). However there are other useful methods such as Simpson’ method by 2D TTE and 3D TTE.
Method and Results: Thirty patients were examined. EF was calculated by 2D TTE and was compared with 3D TTE result. SV was calculated by 2D TTE using the following formula:
and the final results were compared with 3D TEE results.
Results: Were found significant differences related with EF and SV between 2D TTE and 3D TTE. Low inter-observer variability was obtained (coefficient of variability 6%). Both methods presented a strong correlation (ICC was 70% between 2D TTE and 3D TTE in EF measurement and ICC of 71% between those two in SV measurement).
Conclusion: 3D TTE presents higher EF results then 2D TTE and has a strong correlation. In the other hand, 3D TTE presents lower SV results comparing with LVOT measurement, having a strong correlation. The inter-observer variability coefficient by 2D TTE was low.
Keywords:ejection fraction, left ventricular stroke volume, three-dimensional echocardiography, two-dimensional echocardiography, left ventricular outflow tract, simpson’ method
EF, ejection fraction; TTE, transthoracic echocardiography; SV, stroke volume; MRI, magnetic resonance imaging; AV, aortic valve
According to WHO, cardiovascular diseases, including the chornic diseases represent the first cause of death in global terms. It is estimated that in 2008, 17.3 million people have died of cardioascular diseases, accounting for 30% of all deaths. Of these deaths, an estimated 7.3 million that occurred from coronary heart disease and 6.2 million have occurred by AVC.1 In Europe the most common cause of aortic valve disease is ‘calcific degenerative disease’ and 2% of the population have congenitally bicuspid aortic valves.2 Aortic valve (AV) disease is the result of a restricted systolic opening of valve leaflets (valve stenosis), leakage backward (valve insufficiency) or both. AV stenosis has some causes such as acquired ones (rheumatic aortic stenosis), congenital abnormality (bicuspid aortic valve) or even buildup of calcium on valve. This one represents a progressive process with age that consists in fibrosis and calcification being the major cause of morbidity and mortality in the elderly. AV insufficiency can happen by structural abnormalities (bicuspid aortic valve), calcification of AV or by acute processes developed by infective endocarditis.3,4 3,4 The clinical features can be asymptomatic or angina, exertional dizziness, breathlessness and syncope. The general and most appropriate treatment is a corrective one with a cardiac surgery.5 One important assessment in previous group of patients is EF and SV calculation. Currently, there are different non-invasive 2D TTE methods to obtain it. Both measurements are of high clinical importance for diagnosis, and treatment planning of patients with cardiac diseases. EF is obtained through visualization of changes in the size of cavity along cardiac cycle and is directly correlated with myocardial mechanics (longitudinal, circumferential and radial) [5,6]. The ejection fraction normal range acceptance for men and women is ≥55%. About diastolic volume indexed to BSA is same for men and women (35-75 mL/m2). In case of systolic volume indexed to BSA is the same for men and women (12-30 mL/m2). During the study were compared EF results through Simpson’ method (2D TTE) and 3D TTE and SV results assessed with LVOT area and 3D TTE.6
Simpson’ method
Is by far the most commonly used approach in clinical practice and can be called also “rule of disks.” Is called the “rule of disks” because the ventricle is divided along it long axis in series of disks with same height. The volume of each disk is obtained by the product of disk area and height.6 Some advantages of this technique include rapid assessment imaging, without exposure to ionizing radiation, portability, non-invasive and inexpensive. On the other hand, disadvantages include cases with poor image quality which accuracy endocardial border trace may not be possible, cases with dyssynchrony since that is difficult to identify the end-systolic and end-diastolic times and cases with regional wall motion abnormalities. Further limitations are: narrow echocardiographic windows, assumptions of an ellipsoid shaped ventricle and operator experience.7–10 The accuracy in results is increase by the use of multiple views and intravenous contrast which helps in better endocardial border definition improving LV EF determination.11
3D Transthoracic echocardiography
This technique symbolizes a major innovation in cardiovascular ultrasound. In 1960s was first describe the effort to record and display ultrasound images of 3D. In the beginning of 1990, von Ramm and colleagues developed the first real-time 3D echocardiographic, able of obtain volumetric data at frame rates enough to represent cardiac motion.11 New ultrasound equipment and techniques allows real-time 3D acquisition and presentation of cardiac structures from any spatial point of view. 3D permits the evaluation of cardiac chamber volumes, mass and EF without geometric assumptions.6,11 The ability to generate a three dimensional volume independent of imaging plane provides more accurate information regarding left ventricular volume when compared to a standard such as cardiac MRI. It also helps to avoid the foreshortening of long axis which allows the identification of true apex.7,10 It is useful in 3D stress imaging and volumetric evaluation of regurgitant lesions and shunts with 3D color.7 Now-a-days, matrix phased-array transducers notably improved image quality. A variety of sophisticated measures of global and regional ventricular function can be extracted from the same three-dimensional volume.12 However it is important to be aware of the 3D disadvantages. It acquisition and processing requires particular knowledge, which sonographers may not obtain during their formal training. Furthermore, quantification of LV volumes and ejection fraction is time consuming once it requires time to reconstruct the ventricular chamber and calculate volume.9,12 The image acquisition obligates a regular rhythm, stable probe position and breath-hold to prevent stitching artifacts. The equipment and probes are also still not universal among research facilities, and in cases of a larger probe and lower frame rate the more demanding is the images acquirement.6,9,13
Patient selection
The clinical study group consisted of 30 participants (22 men, 8 women, age 73, 55 ± 10, 53 years, BSA mean 1, 88 ± 0,17). Exclusion criteria were arrhythmia (atrial fibrillation/flutter) or clinical condition preventing breath holding for the time of full-volume acquisition (4 heart beats) (Table 1). The inclusion criteria was aortic valve disease. For each patient was registered age, height, weight, BSA, resting HR, systolic blood pressure and diastolic blood pressure.
|
Patient characteristics (n=30) |
|
|
Variables |
Mean ± SD |
|
Age (yrs) |
73,55 ± 10,53 |
|
Males |
22 |
|
Females |
8 |
|
Height (cm) |
172.9 ± 8,61 |
|
Weight (kg) |
75.5 ± 11,62 |
|
BSA (m2) |
1,88 ± 0,17 |
|
Resting HR (bpm) |
60 ± 9 |
|
Systolic Blood Pressure (mmHg) |
158.1 ± 20.3 |
|
Diastolic Blood Pressure (mmHg) |
86.3 ± 9.2 |
Table 1 Patient characteristics (n=30)
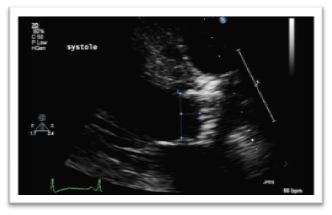
A complete 2D TTE study was performed in all subjects, using a Philips iE33 xMATRIX (USA) equipped with x5 transducer. All acquisitions were performed by same operator with subject in left lateral position. LVOT diameter measurements had an image recorded in 2D parasternal long-axis view with zoom mode activated. The gains were adjusted to optimize the blood tissue interface. The measure was made inner edge to inner edge, in mid-systole, parallel and adjacent to the aortic valve or at the site of velocity measurement. About LVOT VTI, the image was recorded with pulsed-wave Doppler in five-chamber view by placing the sample volume of PW Doppler at the base of the aortic leaflets. The proper time axis was bigger than 100 mm/s in order to obtain a better delineation, with low wall filter setting and adjustment of baseline and scale to maximize the size of velocity curve. VTI was traced.14,15 Apical two-chamber and four-chamber view were recorded for assessment of EF by Simpson’s biplane method. Matrix-array transducer was used for the acquisition of the 3DE data sets from four consecutive cardiac cycles during end expiration breath-hold in apical view (Figures 1–4).

Figure 3 Two-dimensional echocardiography with LVOT diameter measurement in parasternal long axis view.
Image analysis
EF by Simpson’ method biplane was measured twice by two independent readers. The measures were made blinded in relation EF 3D TTE values obtained previously by a third reader. Each observer made two consecutive measurements and the mean value was recorded. When LV volume assessment was performed through Simpson’ method, papillary muscles were excluded from the cavity. Was recorded and traced the LV endocardial border in apical four and two chamber views and the measures were performed in end-systole and end-diastole to obtain end-systolic and end-diastolic volumes, respectively.
Related to SV, was obtained by two different methods: 2D TTE with formula,
and 3D TTE (end-diastolic volume less end-systolic volume). A difficulty allied with SV analysis with LVOT diameter is the fact that diameter is squared and small errors are amplified. Some factors may increase the probability of errors such as image quality, annular calcification, septal hypertrophy.
Statistical analysis
Was performed using commercially available software IBM SPSS Statistics 22 and Microsoft Office Excel 2007. All variables were tested for normality using the Shapiro-Wilk test since the sample of patients was 30. Values of p < 0.05 were considered statistically significant. Paired sample t-test was performed to compare the significance of difference [3D EF% - 2D EF%] variable. Inter-observer variability was calculated according to the following formula:
The intra-class correlation coefficient (ICC) with two-way random was also measured and was obtained 71, 2% between two raters. Wilcoxon test was performed to compare the 3D SV (ml) with 2D SV (ml) since the normality was not observed through the Shapiro-Wilk test. The Bland-Altman graphs was performed for assessment the systemic bias and limits of agreement between the different methods.
All 30 patients had suitable image.
Comparison of EF by Simpson’ method and 3D TTE
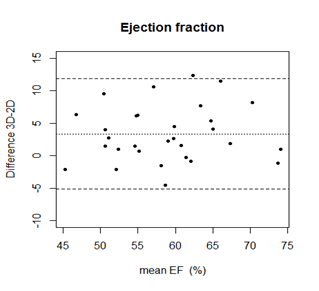
Mean EF 3D TTE was (60, 3% ± 7, 89) and (57, 1% ± 7, 52) to 2D TTE. The minimum EF with 2D TTE was 43, 6% and maximum was 74, 28%. For 3D TTE minimum EF was 44, 19 and maximum EF was 74, 40%. Paired samples t-test showed significant differences between EF by 2D TTE and 3D TTE (p < 0,05) (Figure 5–8).

Figure 8 Bland Altman graph for EF by 2D and 3D TTE assessment. Central line represents mean and border lines are limits of agreement.
Comparison of SV by LVOT area and 3D TTE
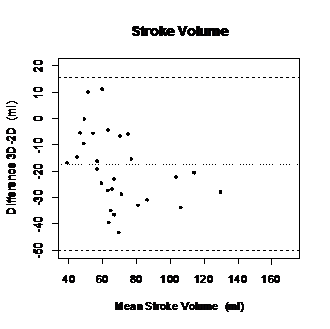
Mean SV 3D TTE was (63, 95 ± 30, 13) and (81, 23 ± 28, 14) to 2D TTE. The minimum obtained with 3D TTE was 30, 8 ml and the maximum was 130,6 ml. In 2D TTE the minimum was 46, 46 ml and the maximum 125, 14 ml. Wilcoxon test (p value ≤ 0, 05) showed an absence of significant differences between LVOT area and 3D TTE biplane assessment (Figure 9–12).

Figure 10 Bland-Altman graph displaying differences of mean values between 2D TTE and 3D TTE derived SV.
The assessment of LV volume and EF is essential to the practice of cardiology. These measures may be used to inform prognosis in most cardiac patient populations. However, no consensus on the best method to routinely measure EF and volumes is accorded. Regardless cardiac MRI is the reference method to determine LV volumes and LV EF, it presents some limitations such as the cost, availability, and incompatibility with metallic hardware making it unsuitable for patient screening or monitoring on large scale.16 Therefore our aim was understand if there were differences between 2D TTE and 3D TTE. Accordingly with EF results from our study it is possible to conclude that there are significant differences (t-test showed p < 0,05) between 2D TTE and 3D TTE. However, a major disadvantage of using 2D TTE measurements as an endpoint is the relatively high interobserver and test-retest variability.8,17 This can be explained by difficult to exclude papillary muscles and trace endocardial border during endocardial tracing.8,7 The interobserver variation coefficient obtained was 6%, a small one. Some studies have been shown that 2D TTE slightly underestimate both end-diastolic (EDVs) and end-systolic volumes (ESVs) when compared to cardiac MRI. The same do not happen with ejection fraction.7–9 Our analysis showed that EF values by 3D TTE has constantly higher values then EF by 2D TTE but to have conclusions about this clinical importance these results should be compared with gold-standard method, cardiac MRI. This might be explained when ultrasonic beam is not through the center of LV and the transducer is not at true apex. These may lead to foreshortening of LV long-axis dimension which turns important to record the high long-axis dimension.18 That situations are avoided with 3D TTE making automated 3D quantification better suited for accurate and reproducible measurements of LV volumes and EF than manual 2D methods. Regarding volumes, 3D TTE has shown a large improvement toward the values of cardiac MRI and can also be considered the most accurate ultrasound technique for determining LV function.7,9 There are some factors that can have influence in LV EF and SV such as: blood pressure, inotropic state and heart rate. When the aim is to obtain a reliable comparison in measurements related with LV EF and SV from 2 different methods, a patient examination under the same hemodynamic conditions is need.9 In relation to SV, according to our results, there are significant differences between SV assessed by
and 3D TTE (Wilcoxon test p < 0,05) and both variables present a strong correlation (r = 0,703). The differences can be explained by the fact that this technique is operator-dependent in LVOT area and LVOT VTI assessment. Additional, the diameter is squared in order to determine SV and thus small errors in measuring LVOT area are amplified.19,20 Another reason, is because 2D LVOT diameter was made counting with a cylindrical shape of LVOT.
The first limitation is the small number of patients (n=30) that can influence the final conclusions in terms of comparability between different variables. The offline analysis was performed by inexperienced observers which may affect the results. However, the inter-observer variability was low, especially in ejection fraction assessment (CV 6%). The images were not taken in the same cycle but all individuals were in sinus rhythm without any significant variations in heart frequency. Other limitation is the absence of cardiac MRI but 3D TTE has shown proofs that has a good agreement with first one and is an accurate and feasible technique.7
Currently there are several ways to measure LV EF and SV and all present limitations. Is important a full knowledge of all methods to choose the proper one for each patient. Criteria such as: cost of exam, patient age, contraindications and local availability of techniques, should be considered before method selection. Accordingly with our study, 3D TTE presents higher EF results then 2D TTE and has a strong correlation. In the other hand, 3D TTE presents lower SV results comparing with LVOT measurement, having a strong correlation. The inter-observer variability coefficient by 2D TTE was low. In order to conclude about the accuracy of these techniques it would be necessary the gold standard (MRI). However, three-dimensional TTE volumes show better agreement with cardiac MRI and tend to be greater with less inter- and intra-observer variability than 2D TTE volumes.
None.
The authors state that there is no conflict of interest.
None.

©2015 Cruz, et al. This is an open access article distributed under the terms of the, which permits unrestricted use, distribution, and build upon your work non-commercially.