Journal of
eISSN: 2469 - 2786


Research Article Volume 5 Issue 2
Structural Biology and Bioinformatics Division, Indian Institute of Chemical Biology (CSIR), India
Correspondence: Pratikchhya Adhikari, Department of Microbiology, St. Xavier College, Maitighar, Kathmandu, Nepal, Tel 9845196965, Tel 9.18008E+11
Received: June 22, 2017 | Published: August 8, 2017
Citation: Sengupta N, Mukherjee D, Bhattacharyya D. UDP-galactose 4-epimerase from Kluyveromyces fragilis: substrate specific inactivation during catalytic turn over. J Bacteriol Mycol Open Access. 2017;5(2):271-279. DOI: 10.15406/jbmoa.2017.05.00131
UDP-Galactose 4-epimerase, an enzyme with bound NAD, reversibly converts UDP-Galactose (UDP-Gal) to UDP-Glucose (UDP-Glc). This enzyme from Kluyveromyces fragilis was inactivated during the conversion of UDP-Gal to UDP-Glc by 30min under standard assay conditions, while it remained active for over 4h during the reverse reaction. The rate of inactivation and reduction of the bound NAD to NADH were similar. The rate of inactivation and formation of enzyme-bound NADH were dependent on the concentrations of enzyme and UDP-Gal. After complete inactivation, no further NADH fluorescence could be generated. Rate of inactivation of epimerase with increasing UDP-Gal concentration followed a linear dependency. Differences in the conformational changes at the catalytic sites imparted by UDP-Gal and UDP-Glc were evident from the patterns of thermal inactivation of the complexes of epimerase with substrate analogs. With saturating concentration of UDP-Gal, the Arrhenius energy of activation (Ea) during inactivation was found to be nearly zero. The favorable interaction of UDP-Gal with epimerase was further confirmed by analyzing the X-ray crystallographic structure and molecular modeling studies of epimerase from a related species, Saccharomyces cerevisiae. Thus, the high rates of formation and dissociation of the epimerase and UDP-Gal complex seems to impart and release of stress on the enzyme leading to its inactivation.
Keywords: substrate dependent inactivation, catalytic turn over, abortive complex, molecular modeling
GG, glycylglycine; UDP-Gal, UDP-galactose; UDP-Glc, UDP-glucose; D(+)-Gal, D(+)-galactose; D(+)-Glc, D(+)-glucose
Reversible conversion of UDP-Gal and UDP-Glc, an essential step of galactose metabolism through Leloir pathway, is catalyzed by UDP-Galactose 4-epimerase (Epimerase) in most of the organisms.1-3 Till date, the enzyme has been purified and characterized from different organisms ranging from E. coli to human. Epimerase from all sources require NAD+ as essential cofactor. The enzyme from yeast Kluyveromyces fragilis is a homodimer containing two moles of tightly bound NAD+ per dimer.4
Ideally, all enzyme-catalyzed reactions are reversible in nature. The enzymatic conversion of substrate to product follow the reaction pathway mentioned in Eq. 1,
E + S ⇋ E-S ⇋ E-I ⇋ E-P ⇋ E + P (Eq. 1)
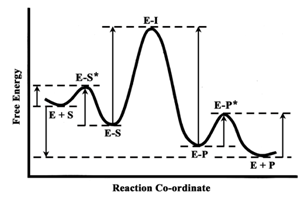
Where the notations used are ‘E’, enzyme, ‘S’, substrate, ‘E-S’, enzyme-substrate complex, ‘E-I’, transition state complex, ‘E-P’, enzyme-product complex, and ‘P’, product. ‘E-S’, ‘E-I’ and ‘E-P’ are the reaction intermediates specific for an enzyme-catalyzed reaction. These intermediates are incorporated by the enzyme for minimizing the energy requirement to form the transition state for catalysis.5 The energy profile in an enzyme-catalyzed reaction is represented in Scheme 1. This scheme shows that the energy requirements for forward and backward reactions are often non-identical. Practically, many of the reactions are irreversible and direction of catalysis is determined by different factors. The enzyme of our interest, epimerase, and displays a distinctive reversible reaction, which indicates formation of the reaction intermediate, is equally favorable from both the directions.
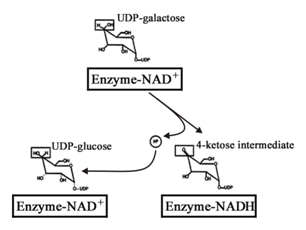
The mechanism of epimerase action has been studied by several researchers for the past few decades, which was found to proceed through a transient intermediate, the enzyme-bound UDP-4-keto-hexopyranose, by oxidation with concomitant reduction of NAD+ to NADH.1,6-8 The ketone intermediate then undergoes non-stereospecific reduction by NADH to yield either UDP-Glc or UDP-Gal where hydride transfer takes place from NADH to either face of the ketone.9,10 The mechanism of hydrogen transfer involving rotation of the UDP-4-keto-hexopyranose intermediate at the catalytic site is outlined in Scheme 2. Previous experiments on E. coli epimerase established that under certain conditions the catalytic intermediate is found free.11 This intermediate is formed due to intermolecular hydrogen transfer between the substrates and the enzyme.
Epimerase from E. coli is inactivated when the enzyme bound NAD+ is converted to NADH.11,12 Formation of NADH during turn over can be confirmed and measured by fluorescence spectrophotometer. Catalytically formed NADH undergoes reoxidation and regenerates active enzyme. Formerly, E. coli epimerase was found to be inactivated in a substrate induced method where the enzyme bound NAD+ becomes NADH in presence of NaBH4. It has also been demonstrated that there is a positive correlation between the inactivation of the E. coli epimerase and the increase in NADH absorbance.11 This inactivation does not involve the UDP-4-keto-hexopyranose intermediate; and, during catalysis, the enzyme-bound intermediate can be replaced by the substrate producing a free intermediate and an abortive complex of enzyme-NADH-substrate.11 All these studies on substrate induced inactivation of epimerase were carried on using UDP-Glc as substrate and there were found no specificity in case of inactivating the enzyme.
Yeast epimerase, as studied so far, have similarities to the E. coli enzyme in many respects. But it also differs in having the mutarotase at its C-terminal half. Further, epimerase from K. fragilis contains a 5’-UMP molecule bound at one of the catalytic sites and exhibits regulation between the two catalytic sites.4 Therefore, there might be some variation in the mechanism of substrate induced inactivation of the enzyme. The phenomenon of such substrate dependent inactivation in case of the epimerase from the yeast K. fragilis was first indicated by Dutta & Bhaduri [unpublished data, 13]. They studied the mechanism of inactivation at equilibrium where concentrations of the substrate and the product were same. The equilibrium studies well revealed inactivation of the yeast epimerase during its catalytic turn over. But it was not clear whether UDP-Gal or UDP-Glc was responsible for inactivation of the enzyme as there were equal amounts of UDP-Gal and UDP-Glc present in the reaction mixture at that point. Studies were, therefore, made to investigate the actual basis of inactivation by UDP-Gal or UDP-Glc. The main probe used here was the consequent NADH fluorescence resulting from enzyme inactivation. Mass spectrometric analyses were done to identify the isolable enzyme bound intermediate formed during catalysis. The analyses of the previously studied X-ray crystal structures of the enzymes from E. coli, S. cerevisiae and human revealed the differences in the binding of UDP-Gal and UDP-Glc. Molecular docking studies and molecular dynamics calculations were attempted further to get better results.
Here we present evidences for the substrate specific inactivation of the yeast epimerase with UDP-Gal as substrate. We also propose that binding of UDP-Gal with the epimerase structurally destabilizes the enzyme more than that of UDP-Glc, which in turn leads to inactivation of the enzyme.
Enzymes
Epimerase, UDP-Galactose 4-epimerase (EC 5.1.3.2); UDP-Glc DH, UDP-Glucose dehydrogenase (EC 1.1.1.22); Galactose oxidase (EC 1.1.3.9) and HRP, Horseradish peroxidase (EC 1.11.1.7) were used in this study.
Reagents
D(+)-Gal, D(+)-Glc, GG, b-NAD, UDP-Gal, UDP-Glc, 5’-UMP, UDP, Sephadex G-50, hydroxyapatite, o-dianisidine, HRP and galactose oxidase were purchased from Sigma, USA. Urea (GR) was re-crystallized from hot ethanol. Yeast strain Kluyveromyces fragilis (ATCC No. 10022, renamed as Kluyveromyces marxianus var marxianus) was purchased from Microbial Type Collection Center and Gene Bank, IMTECH, Chandigarh, India. YNB (yeast nitrogen base), yeast extract powder and Bactopeptone Type II were from Hi-media, Mumbai, India. UDP-Glc dehydrogenase (DH) was partially purified from goat liver up to the heat denaturation step.14 This preparation was left for 15 days at –20˚C in 50 mM Na-acetate, pH 5.5 by which time the contaminating epimerase activity was lost.
Purification of epimerase
Cell growth, harvesting and purification of epimerase have been carried out using the protocol described earlier.4,15,16 Homogeneity of the preparation was verified by SDS-PAGE and PAGE. An initial kinetic lag in the conversion of UDP-Gal to UDP-Glc by epimerase during coupled assay because of its association with 5’-UMP.4,17 The specific activity of the purified enzyme was 65-70 U/mg and does not contain any bound NADH.4
Enzyme assay
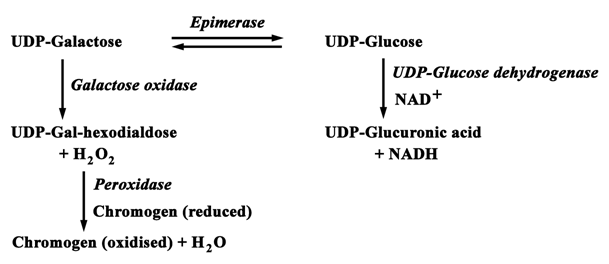
The forward reaction by epimerase, i. e., conversion of UDP-Gal to UDP-Glc was continuously monitored at 340 nm and 25 ˚C using UDP-Glc DH as the coupling enzyme.16,17 The assay mixture contained 0.1 M GG (pH 8.8), 0.5 mM NAD, 0.3 mM UDP-Gal and 10 units of UDP-Glc DH in 1 ml and was compulsorily incubated for 10 min whereby any UDP-Glc present in UDP-Gal as impurity was removed by the coupling enzyme. The assay was initiated by adding 0.001 - 0.3 units of the epimerase. UDP-Glc DH was assayed with UDP-Glc as substrate in presence of NAD at 340 nm under the same conditions as of epimerase assay.14,18 The backward reaction, i. e., conversion of UDP-Glc to UDP-Gal by epimerase was monitored at 425 nm using galactose oxidase as the coupling enzyme, at 25˚C.19 The 1 ml reaction mixture contained 0.1 M GG (pH 8.8), 0.2 mM UDP-Glc, 0.002 % o-dianisidine, 8 - 10 units of HRP and 10 - 12 units of galactose oxidase and was incubated for 10 min prior to the reaction to remove any trace of UDP-Gal present in UDP-Glc as impurity. HRP is the coupling enzyme required for galactose oxidase assay.19 Here also the assay was initiated by addition of 0.001 - 0.3 units of epimerase. Epimerase assay in both the directions is presented in Scheme 3.
NADH fluorescence
The epimerase (0.5 mg/ml) was incubated with 0.5 mM UDP-Gal, 0.5 mM NAD and 20 units of UDP-Glc dehydrogenase in 0.1 M GG, pH 8.8. The reaction mixture was incubated at 25˚C for 5 h; aliquots were passed through Sephadex G-50 spin column at every 1 h interval starting from the 0th h to remove any unbound NAD, NADH and other small molecules. The eluted samples were then treated with 8 M urea at 25˚C for 10 min whereby no trace of coenzyme fluorescence remained.4 Now, the epimerase in different concentrations was incubated with 0.3 mM UDP-Gal, 0.5 mM NAD and 20 units of UDP-Glc dehydrogenase in 0.1 M GG, pH 8.8. The epimerase concentrations were varied from 0 - 0.5 mg/ml in different experimental sets. The reaction mixtures were then incubated at 25˚C for 16 h and then passed through Sephadex G-50 spin column.22 The samples were then treated with 8 M urea at 25˚C for 10 min. Again, the epimerase (0.5 mg/ml) was incubated with 0 - 1 mM UDP-Gal in presence of 0.1 M GG, pH 8.8, 0.5 mM NAD and 20 units of UDP-Glc dehydrogenase. The reaction mixtures were incubated for 16 h at 25 ˚C and passed through spin column (Sephadex G-50) to remove any unbound particle. The samples were then dissociated completely by 8 M urea at 25˚C for 10 min. As control, epimerase (0.5 mg/ml) in GG buffer without substrate and coupling enzyme was incubated at same conditions, passed through Sephadex G-50 spin column and dissociated using 8 M urea. After complete dissociation in all the cases, the samples were analyzed for the presence of characteristic NADH fluorescence (ex: 340 nm; em: 380 - 500 nm).
Mass spectrometry
A Q-TOF Micro (Micromass) instrument with micro channel plate detectors was used for the mass spectrometric analysis. Positive ionization electro spray mode (ESI-MS) at a desolvation temperature of 200˚C was applied. As collision gas Argon was used at a pressure of 2 kg/sq cm having collision energy of 10eV. Epimerase (0.05 mg/ml) was dialyzed extensively against water at 4˚C, lyophilized and reconstituted in 10 mM K-phosphate, pH 7.0 at a concentration of 0.5 mg/ml approximately. The solution was centrifuged to remove any undissolved particle. Now, the enzyme was incubated with 0.5 mM UDP-Gal, 0.5 mM NAD and 20 units of UDP-Glc dehydrogenase in 0.1 M GG, pH 8.8 at 25˚C for 2 h, whereby the catalysis had been completed. The sample was then passed through Sephadex G-50 spin column22 and the eluted sample was then provided for ESI-MS. The MS data obtained were analyzed and analyses for 5’-UMP and NAD mass had not been included here.
Kinetics of inactivation
The epimerase (0.5 mg/ml) was incubated with 0.1 M GG, pH 8.8, 0.5 mM NAD and 20 units of UDP-Glc dehydrogenase in presence of 0 - 5 mM UDP-Gal. All the reaction mixtures were incubated at 25˚C for 4 h and aliquots were passed through spin column (Sephadex G-50) to remove any unbound small molecule.22 The eluted samples were then assayed for residual activities and the rates of inactivation were measured in each case of UDP-Gal concentration.
Thermal stability with substrate analogs
Epimerase (0.25 mg/ml) was incubated with its substrate analogs, i. e., 0.25 mM UDP in combination with 2 mM D(+)-Gal or D(+)-Glc at 25˚C for 30 min. Epimerase without any substrate analog was also incubated under identical conditions, as a positive control. The samples were then incubated at 25˚C and 45˚C for 2 h and assayed at every 15 min to check their stability. It had been verified earlier that the carried over concentrations of neither UDP nor D(+)-Gal or D(+)-Glc would cause any inhibition of the coupling enzyme.
Arrhenius energy of activation
Reaction rates of epimerase were measured between 20 - 40˚C at 2° intervals. The energy of activation (Ea) was calculated from the Arrhenius equation,21,22
(Eq. 2)
Where, ‘k’ is the rate constant, ‘R’ is gas constant, ‘T’ is absolute temperature (K) and ‘A’ is frequency or pre-exponential factor.21Calculations for the apparent Ea for enzyme catalysis were based on rate measurements at saturating substrate concentration, 0.35 mM UDP-Gal, where both the sites of epimerase operate.21 Ea was calculated separately for the initial phase of catalysis and for the phase of inactivation.
To determine the conformational changes imparted by the binding of UDP-Gal and UDP-Glc, analytical and molecular modeling studies utilizing X-ray crystallography were necessary. Crystals of K. fragilis epimerase has not yet been resolved. Therefore, the structures of epimerase from E. coli and S. cerevisiae were compared through sequence alignment using ClustalW2. For molecular modeling studies, first, the SWISS-MODEL of the epimerase domain (N-terminal domain, up to 356 amino acid residues) of S. cerevisiae was formed. Thereafter, energy minimization was performed using Accelrys, 2000 (San Diego, CA) package using the cff-91 force field on a Silicon Graphics OCTANE workstation.23,24 Now, this SWISS-MODEL was superpositioned on E. coli epimerase coupled with UDP-Gal and UDP-Glc (Protein Data Bank Accession Nos. 1A9Z and 1A9Y, respectively25) using the software MODELYN. From the E. coli models, 3-D structures of UDP-Gal and UDP-Glc were obtained followed by addition of hydrogen and energy minimization. These structures were then placed on the superposed SWISS-MODEL of S. cerevisiae epimerase and energy minimization of both the assemblies were done up to their stabilization. Energy minimization steps were performed with a convergence criterion of 0.001 kcal/mol, using the combination of steepest descent and conjugate gradient methods (100 times each for one step) until satisfactory conformational parameters were obtained. Total energy of the enzyme assembled with UDP-Gal and UDP-Glc were calculated separately.
An UV-Vis recording spectrophotometer (Specord 200, Analytical Jena, Germany) was used to quantify all the kinetic measurements and the initial kinetic lag of epimerase coupled assay. Other optical measurements were done with a Biochrom S2000 diode array spectrophotometer (UK). All fluorescence analyses were done with a Hitachi F-7000 recording fluorescence spectrophotometer setting the excitation and emission slit widths at 2.5 nm each and using 700 ml quartz cuvette. Protein estimation was done after Lowry et al.26 or using the Bio-Rad Protein Assay Reagent (catalog no. 10044) as par manufacturer’s protocol (Bio-Rad Laboratories) using BSA as reference. The following values were used: NADH, e340 nm = 6.3´ 103 M-1cm-1; NAD, e260 nm = 17.8 ´ 103 M-1 cm-1, 5’-UMP, UDP-Gal and UDP-Glc, e260 nm = 1.0 ´ 104 M-1 cm-1; o-dianisidine, e425 nm = 1.13 ´ 104 M-1 cm-1. The raw data obtained from all the kinetic studies were plotted and analyzed using the software Microcal Origin (version 6.0), Northampton, USA.
Substrate induced inactivation
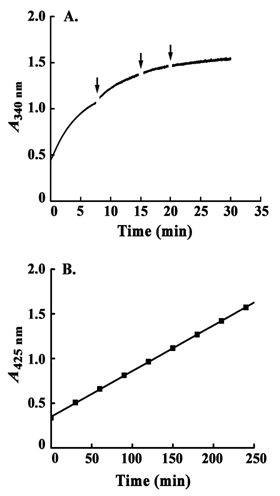
During the catalysis by yeast epimerase, substrate induced inactivation of the enzyme, if any, was studied first. As the reaction is completely reversible, coupled assay systems for both the forward and backward reactions were employed. This made the reactions unidirectional and excluded simultaneous presence of UDP-Gal and UDP-Glc. In case of the forward reaction using UDP-Gal as substrate, the reaction showed completion within 30 min (Figure 1A). No rise in the reaction rate was observed by further addition of UDP-Gal, UDP-Glc dehydrogenase and NAD to the assay mixture. On the contrary, the reaction with UDP-Glc showed a linear rise in reaction rate for 4 h (Figure 1B). These results demonstrated inactivation of the yeast epimerase during catalysis in presence of UDP-Gal only.
NADH fluorescence
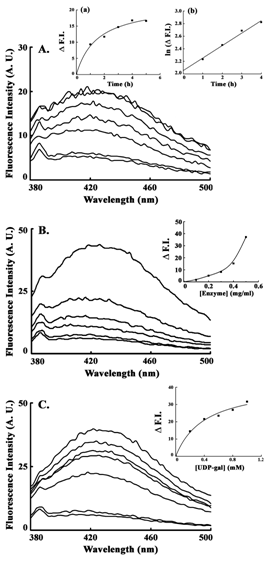
From the results of the previous experiments, it was indicated that the inactivation was due to UDP-Gal. Further experiments were done for the forward reaction (using UDP-Gal as substrate) to confirm the phenomenon. Time dependent inactivation was evident from the resultant increase in the intensity of NADH fluorescence (Figure 2A). Fluorescence intensity at 420 nm (Emmax for NADH) was plotted against time (h), which showed a well-fitted (R2 = 0.9914) hyperbolic pattern (Figure 2A, Inset-a). A secondary plot of the ‘ln’ of increase in fluorescence intensity versus incubation time up to 4 h yielded a straight line (R2 = 0.9865), from which the rate of NADH formation was measured as 0.8 ± 0.02 fluorescence unit/M UDP-Gal/mg-enzyme (Figure 2A, Inset-b). The increase in NADH fluorescence was observed with increasing enzyme concentration (Figure 2B). Rate of NADH formation was demonstrated from the plot of fluorescence intensity (at 420 nm) against enzyme concentration (Figure 2B, Inset). Increase in substrate concentration (UDP-Gal) also exhibited consequent increase in formation of NADH (Figure 2C) and rate of increase in fluorescence intensity was evident from the plot against UDP-Gal concentration (Figure 2C, Inset). This also demonstrated a hyperbolic pattern (R2 = 0.9881). In all experiments NADH fluorescence was measured under denaturing condition to eliminate interference of the characteristic coenzyme fluorescence.
Mass spectrometry
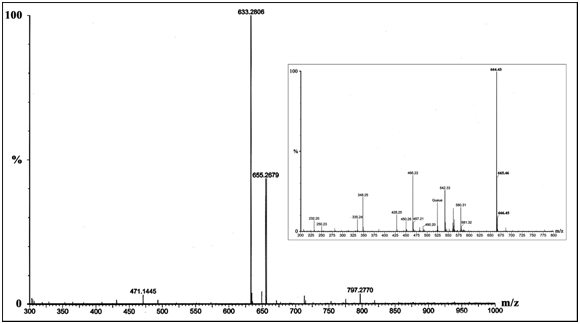
The bound reagent present in the preparation of inactive abortive enzyme complex was identified by MS analysis for small molecules. The MS-data obtained from the preparation yielded two major fragments of m/z 633.28 [UDP-Gal, Na+] and 655.27 [UDP-4-keto-hexopyranose, 2Na+, H+]. Two other fragments of very low abundance [471.14 and 797.28] were ignored from our analysis as they did not show any significant resemblance with the any of the derivatives. The MS-data of the final preparation has been shown in Figure 3. Analysis for 5’-UMP (368.15, disodium salt) mass had not been included in this study as its derivatives did not yield such fragments.15 MS analysis for NAD+ (663.43) as a control yielded the major fragments of m/z 664.43 [NAD+, H+], 665.46 [NAD+, 2H+] and 666.45 [NAD+, 3H+] (Figure 3, Inset). Any of the other fragments of low abundance showed no similarity with the fragments obtained from the experimental preparation.
Kinetics of inactivation
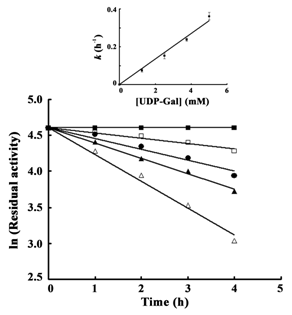
Concentration of UDP-Gal was varied to determine the rate of inactivation of epimerase in a time dependent manner. Residual activities were estimated in each case considering the activity at the 0th h as 100%. Enzyme with 0 mM UDP-Gal showed 100% activity even after 4 h of incubation; on the contrary, epimerase incubated with the maximum concentration of UDP-Gal used here (5 mM) retained only 18.7% activity after 4h. The rates of inactivation with different UDP-Gal concentrations were plotted as ln of residual activity against time (h). Well-fitted linear dependency with a downward slope was observed in each case (Figure 4). The lines obtained for 1.25 mM, 2.5 mM, 3.75 mM and 5 mM UDP-Gal showed R2 values of 0.9617, 0.9945, 0.994 and 0.9889, respectively and all of them obeyed 1st order rate kinetics. In each case, the inactivation rate per hour was plotted against UDP-Gal concentration, which derived a straight line with R2 value of 0.985 (Figure 4, Inset).
Thermal stability
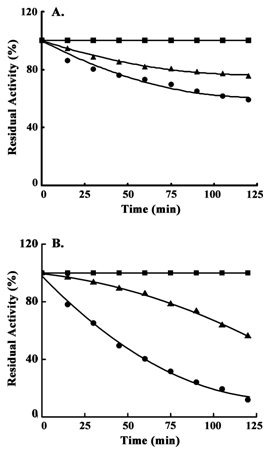
Previous results indicated that there should be differences in the stability of epimerase after binding with UDP-Gal and UDP-Glc. To avoid catalytic turnover of epimerase, substrate analogues were used that could impart similar stress to the catalytic site upon binding as of UDP-Gal or UDP-Glc and stability of the two different enzyme-substrate complexes were assumed. Rates of thermal inactivation in presence of the substrate analogues were determined and then measured in terms of residual activity (%). Incubation of the yeast enzyme with UDP in combination with D(+)-Gal or D(+)-Glc showed different degrees of stability (Figure 5). In case of stability at 25˚C, enzyme pre-incubated with UDP and D(+)-Gal showed ~1.6 times faster rate of inactivation (R2 = 0.9612) than that of the enzyme previously incubated with UDP and D(+)-Glc (R2 = 0.9934) (Figure 5A). Further, epimerase in presence of UDP and D(+)-Gal showed the rate of inactivation at 45˚C (R2 = 0.9955), which was ~ 2.7 times faster than the enzyme in presence of UDP and D(+)-Glc (R2 = 0.9974). The inactivation rate also demonstrated two distinct patterns with a positive and a negative slope, respectively (Figure 5B). In case of experiments at both 25˚C and 45˚C, activities of the epimerase without any substrate analogue at 0th min of incubation were considered as 100% and the residual activities remained the same (100%) for the entire period (2 h).
Arrhenius energy of activation
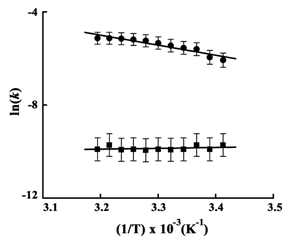
The Arrhenius plots for epimerase for the initial catalytic rate and the rate of inactivation were constructed at pH 8.8 between 20 - 40˚C Figure 6). The well-fitted linear dependencies (R2 being 0.9435 and 0.8483, respectively) indicated absence of thermal denaturation within the temperature range. The activation energies (Ea) were calculated using Eq 1. The derived Ea value for catalysis was 17.91 ± 2.1 kJ/mol and the value for inactivation was -1.45 ± 0.17 kJ/mol. This calculated value of energy of activation during inactivation of epimerase was nearly zero. This indicated that there was no catalysis due to inactivation of the enzyme molecules.
Analysis of crystal structures and molecular modeling studies
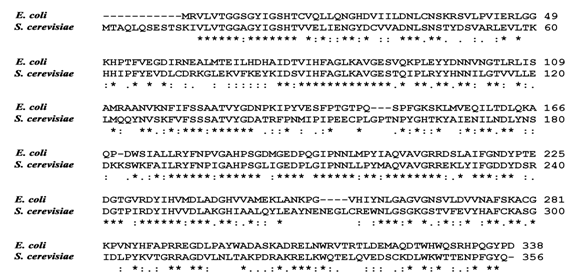
The X-ray crystallographic structure of epimerase from K. fragilis has not been solved yet. Therefore, to have an idea about the structural differences upon binding of UDP-Gal and UDP-Glc with this enzyme, the structures of epimerase from E. coli and S. cerevisiae were compared. Epimerase is structurally conserved from bacteria to human. However, epimerase from S. cerevisiae contains mutarotase at its C-terminal domain. The first 356 residues of the polypeptide chain forming the epimerase domain, therefore, were taken for sequence alignment. First, sequence alignment of the two proteins was done using ClustalW2 (Figure 7). The result showed high degrees of sequence homology along different stretches of the enzymes mainly constructing the NAD+ binding region. In E. coli epimerase, the amino acid residues Asp-31, Asn-35, Ser-36, Lys-84, Asn-99, Tyr-149 and Lys-153 are conserved and form the NAD+ binding motif, among which Asp-31 is involved in anchoring the adenine part.27 In E. coli, the residues Ser-124, Tyr-149, Asn-179, Asn-199, Arg-231, Arg-292, Asp-295 and Tyr-299 are responsible for binding UDP-Glc among which Arg-292 and Asp-295 are strictly conserved.27 These are also indicated in the sequence alignment results (Figure 7).
The superposed view of SWISS-MODEL of the epimerase domain of S. cerevisiae on E. coli epimerase was demonstrated in Figure 8. The root-mean-square deviation calculated for superposition was 0.556 Å which was well below the limit of 1 Å. UDP-Gal and UDP-Glc were then placed on the superposed SWISS-MODEL of S. cerevisiae epimerase. After energy minimization, different parameters of the assemblies ofS. cerevisiae epimerase with UDP-Gal and UDP-Glc were calculated and compared (Table 1). The structures of the assemblies showed that UDP-Gal was accommodated at the catalytic site, while UDP-Glc could not be assembled within the catalytic site of the enzyme (Figure 9A & Figure 9B).
Substrate induced inactivation of epimerase from E. coli was evident and confirmed from the early studies.6,11,12 Epimerase from K. fragilis was also found to be inactivated in presence of substrates at the equilibrium.13 But it was not known from the previous studies whether the inactivation was due to UDP-Gal or UDP-Glc or both. The substrates could impart some negative conformational stress inactivating the enzyme during turn over. To unravel the exact cause, both the forward and backward reactions were independently carried on for prolonged period (4h) involving the two coupling assay systems (Scheme 3). By this, in each case, the product formed was removed from the assay mixture by the coupling enzymes so that it could not be accumulated to start the reaction at opposite direction. Therefore, interaction of the enzyme with only UDP-Gal or UDP-Glc was studied independently and compared (Figure 1). In case of reaction with UDP-Gal, the assay attained completion within 30 min. Further addition of assay reagents (except the enzyme) could not increase the reaction rate indicating inactivation of epimerase molecules present in the reaction mixture. In case of the backward reaction, i. e., with UDP-Glc a sharp contrast in the pattern was observed. The reaction rate showed linearity up to 4 h indicating continuation of the catalytic process at same rate. It confirmed that the inactivation of yeast epimerase was due to binding with UDP-Gal. UDP-Glc did not render any considerable inactivation of the enzyme during catalysis. This convinced us to continue the further studies using UDP-Gal as substrate.
Presence of enzyme bound NADH after inactivation of the epimerase prevents the initial oxidation of the substrate for catalysis. It was established from the earlier experiment that inactivation of epimerase during catalysis was due to the presence of UDP-Gal. Completion of catalysis indicated turn over of all active enzyme molecules present in the reaction mixture. This in turn indicated the production of enzyme-bound NADH and significant increase in NADH fluorescence. Inactivation of epimerase during catalysis was measured in a time dependent manner, where a continuous increase was noticed (Figure 2A). From the plot of fluorescence intensity (at 420 nm) vs time, it was evident that initially the fluorescence intensity increased linearly with time, finally giving a parallel zone to the abscissa (after 4 h). This established that all the enzyme molecules present in the reaction mixture were inactivated by that time and no further NADH formation was occurred. This phenomenon was also found to depend upon the amount of enzyme present as there was significant increase in fluorescence intensity of NADH with increasing epimerase concentration (Figure 2B). But the profile of the rate of NADH formation indicated that there might be some natural inactivation of enzyme molecules, i. e., not due to catalytic conversion, at low enzyme concentrations (Figure 2B, Inset). Inactivation of epimerase had a negative correlation with the concentration of UDP-Gal, and the dependency was hyperbolic having a higher rate of inactivation at low UDP-Gal concentration. At higher substrate concentration the inactivation was lower (Figure 2C). The process of slow inactivation by high concentration of substrate was studied earlier on bacterial enzyme at equilibrium conditions to get the UDP-4-keto-hexopyranose intermediate.6,7
The previous studies on E. coli epimerase showed that UDP-Glc forms an abortive complex with epimerase upon inactivation. The keto-intermediate becomes free from the enzyme leaving an enzyme-NADH-substrate abortive complex.11,12 With experiments on K. fragilis epimerase inactivation during catalytic turn over was confirmed in presence of UDP-Gal. To ensure formation of an abortive enzyme complex, MS-analysis was done with the epimerase which had undergone turn over (Figure 3). The obtained MS-data showed a fragment of highest abundance (m/z 633.28) that was of the substrate [UDP-Gal, Na+] in the enzyme-bound form. This suggested formation of an enzyme-NADH-substrate complex also in this case. However, there was a fragment of lower abundance (m/z 655.27) showing presence of the enzyme-bound intermediate [UDP-4-keto-hexopyranose, 2Na+, H+]. Thus, there might be simultaneous occurrence of abortive complexes of enzyme-NADH-substrate and enzyme-NADH-intermediate in the preparation of inactive yeast epimerase. Further supportive evidences for the presence of enzyme-NADH-intermediate are yet to be established.
Inactivation of yeast epimerase in presence of different concentrations of UDP-Gal was again confirmed by measuring the residual activities (%) of the aliquots taken at every 1 h interval. It was demonstrated from the results that increasing concentration of UDP-Gal increased the rate of inactivation consequently (Figure 4). The rate of inactivation per hour with increasing substrate concentration showed a well-fitted linear dependency (Figure 4, Inset). The pattern observed in the case of NADH fluorescence with increasing UDP-Gal concentration was reflected in these results.
Earlier results showed UDP-Gal induced inactivation of epimerase during catalysis. But there was no inactivation observed in presence of UDP-Glc. This implied that there might be some conformational change at the catalytic site which could alter the catalytic stability of epimerase. Therefore, thermal stability of the epimerase pre-incubated with substrate analogs (UDP and D(+)-Gal / D(+)-Glc) were studied and compared. The results provided information about the variations of structural changes imparted by the two substrates (Figure 5), which in turn indicated that UDP-Gal renders some alteration in the conformation that destabilizes the enzyme more rapidly than that imparted by UDP-Glc.
To determine the Ea of epimerase for catalysis, the steady state rates were measured (0 to 30 s of reaction), whereas to calculate the Ea for the substrate dependent inactivation, the rates from 1500 to 1800 s of reaction were measured. During that period no rise in absorbance (at 340 nm) was observed under standard assay conditions due to inactivation of the enzyme (Figure 1A). In case of Ea for catalysis, the calculated value was real (17.91 ± 2.1 kJ/mol). On the other hand, the derived value of Ea for inactivation was negative and close to zero (-1.45 ± 0.17 kJ/mol), which could not be true (Figure 6).
During our studies to verify substrate specific inactivation of yeast epimerase, we observed inactivation due to UDP-Gal. This indicated that there might be differences in the binding energies of the two substrates with epimerase. Isothermal titration calorimetry (ITC) was attempted with epimerase titrated with UDP-Gal and UDP-Glc individually as ligand. But the experiment did not yield any significant result might be due to the reversibility of the reaction. The coupling assay system could not be employed here, which came to be the major drawback in this case. Therefore, the ITC could not be considered as a useful probe to distinguish between the binding patterns of UDP-Gal and UDP-Glc. For this reason, a second approach was used to solve the problem. X-ray crystallographic structures of epimerase from E. coli,25,27,28 S. cerevisiae29 and human sources30 are presently known. There are also some studies to distinguish between the binding characteristics of UDP-Gal and UDP-Glc to the E. coli enzyme involving its crystal structure.28 Neither the amino acid sequence nor the crystal structure of K. fragilis enzyme is known so far. The structure of epimerase from K. fragilis could be constructed from that of the enzymes from these three sources. Further, sequence alignment results of S. cerevisiae and E. coli enzymes demonstrated high sequence homology and conserved nature of the enzyme (Figure 7). Analyses of the known structures indicated that the catalytic site of epimerase, especially in case of yeast is rather flexible and does not attain any rigid conformation. Thus, the catalytic site conformation is not merely feasible to interpret, for which modeling studies to differentiate binding consequences of UDP-Gal and UDP-Glc seem to be difficult in case of yeast epimerase. Previous studies on the structure from S. cerevisiae, the nearest relative of K. fragilis, revealed that the catalytic site were to some extent flexible containing multiple conformations and was not apparently possible to interpret.29 In case of S. cerevisiae, the crystal structure revealed that there are breaks between Phe-233 and Arg-240, and Tyr-305 and Val-315 within the polypeptide chain. These regions lie near the substrate-binding pocket and are indicative of multiple conformations of the catalytic sites.29 For this, the SWISS-MODEL of this enzyme was constructed from the amino acid sequence instead of using the PDB structure. The conformation of the catalytic site thus depends on substrate binding.
From the modeling studies it was found that the total energies (summation of van der Waals energy and electrical energy) of both the assemblies were similar (Table 1). That was because UDP-Glc was not incorporated at the catalytic site as in case of UDP-Gal (Figure 8A & Figure 8B), and it indicated that UDP-Gal more easily binds to the catalytic site imparting a higher rate of stress due to binding. Similar values of total energies of the assemblies indicated that, in this case, E-S and E-P complexes were at the same energy level as shown in Scheme 1. But the energy required for formation of these two complexes, i. e., the energy barrier from E-S* to E-S and E-P* to E-P were different here.
Parameters |
Epimerase with UDP-Gal |
Epimerase with UDP-Glc |
No. of Hydrogen bonds |
5 |
4 |
van der Waals energy |
-73.57 kcal/mol |
-81.65 kcal/mol |
Electrical energy |
-27.66 kcal/mol |
-22.72 kcal/mol |
Total energy |
-101.23 kcal/mol |
-104.37 kcal/mol |
Table 1 Parameters of S. cerevisiae epimerase assembled with substrates after energy minimization
All the observations led us to the conclusion that yeast epimerase gets inactivated during catalytic turn over only in presence of UDP-Gal. In a completely reversible mechanism, reactions in both the directions follow the same path of catalytic intermediates (Scheme 1). Inactivation of the enzyme in only one direction indicates that there must be any destabilizing factor during the formation of either E-S* or E-P* complex, according to Scheme 1. In this case of epimerase from K. fragilis, during the forward reaction, i. e., the reaction with UDP-Gal as substrate, the enzyme gets inactivated. This means, formation of the keto-intermediate via binding of UDP-Gal to the enzyme (E-S*) is abortive. On the contrary, during the backward reaction, i. e., the reaction with UDP-Glc as substrate, formation of E-S* from the intermediate does not impart such conformational change inactivating the enzyme. Epimerase, the last enzyme in the galactose metabolism pathway, regulates the rate limiting step.31,32 Therefore, the basic purpose for such substrate specific inactivation of epimerase might be to maintain the galactose pool in the cell, while any other underlying reason is yet to be determined.
This work was supported by the Department of Science and Technology (Grant No. SR/SO/BB-66/2005) awarded to DB. NS was supported by UGC-NET Senior Research Fellowship. K. Sarkar (IICB) provided ESI-MS data.
The author declares no conflict of interest.

©2017 Sengupta, et al. This is an open access article distributed under the terms of the, which permits unrestricted use, distribution, and build upon your work non-commercially.